EXY is at a critical turning point.EXY is at a critical turning point which will judge its course in the future. Looking at the data in the charts, it is obvious that the sellers are trying to lead the index to lower price levels.
Starting from the analysis of the trend and its momentum, in the price chart on the left, there is a downtrend lately which has led to the break of the lower limits of the uptrend channel, creating two lower lows as well as two lower highs. Continuing the analysis with the averages, which follow the tr
Linear Regression
SHORT Trade Based On Price ActionThis is a trade setup based on timeframe agreement and price action.
Looking at the relationship across the timeframes, these are some of the things to take notice of:
====DAILY CHART====
The daily chart shows good evidence of bearishness: there are lower lows and lower high; and the price is overbought, interacting with the upper linear regression channel.
====LOWER TIMEFRAMES====
The lower timeframes generally agree with what we are seeing on the daily chart. However the H4 is currently enc
SHORT Trade Based On Price ActionThis is a trade setup based on timeframe agreement and price action.
Looking at the relationship across the timeframes, these are some of the things to take notice of:
====DAILY CHART====
The daily chart shows good evidence of bearishness: there are lower lows and lower high; and the price was recently overbought, interacting with the upper linear regression channel.
====LOWER TIMEFRAMES====
The lower timeframes agree with what we are seeing on the daily chart, producing lower lows and lower
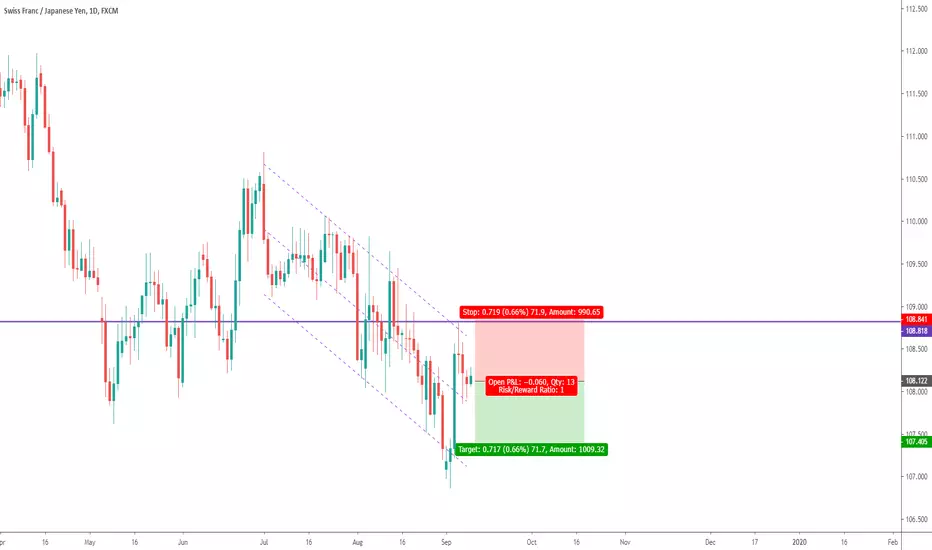
SHORT Trade Based On Price ActionThis is a trade setup based on timeframe agreement and price action.
Looking at the relationship across the timeframes, these are some of the things to take notice of:
====DAILY CHART====
The daily chart shows good evidence of bearishness: there are lower lows and lower high; and the price is overbought, interacting with the upper linear regression channel.
====LOWER TIMEFRAMES====
The H4 also shows good signs of bearishness, although there are some clear signs of recent support as discu
EURUSD Timeframe Agreement & Price Action For Shorts Trade setup to short based solely on timeframe agreement and price action.
DAILY
good signs of bearishness and signs that price could be oversold (based on linear regression channel)
H4
broken support which was holding up the price
HOURLY
Started to show lower lows and lower highs. Entry based on seeing reversals off of either the upper linear regression channel or the average of linear regression channel.
STOPLOSS PLACEMENT
Using the lower highs on the hourly for stoploss placement, as
USDTRY: Daily swing trade opportunityWe have a nice swing trade op in this pair, go long at market, stop loss should be placed below the recent low.
I think the pair has room to rally back to resistance (see red line on chart). Linear regression and speed lines help us, along with oscillators and bar by bar analysis, as well as the use of RgMov, to determine the trend and where trend following or short term reversal opportunities arise. I'd say the odds of success here are big, but given the tight stop I wouldn't risk a full unit (
ETHUSD Ichimoku+RSI Neutral-Bull ForeshadowingTrade with care! This is still a bear market, but just as corrections can go down, they can go up. Right now it looks like the market will correct upward, and 330 USD looks like an optimistic target. This still needs to be analyzed over the next few days, but I wouldn't be surprised if a huge rally came up. Sell volume is going down for both ETH and BTC and long positions are coming in.
My main telltale-heuristic sign is USDT, which despite the huge selloff is stabilizing at 1:1. Watching it te
Tesla's 1:6 trade opportunityThis morning Tesla's r(0.988) linear regression just touched a new low at 260.1, there are two possible scenarios:
Red arrow: Tesla's uptrend is over and investors should probably SHORT targeting 248.00.
Green arrow: Tesla is currently undervalued and may bounce back to the near resistance level at 286.88 continuing the r(0.988) linear regression.
My pick this time is a 1:6 LONG trade expecting the price to go back to the regression channel.
---
"We go to school to learn to work ha
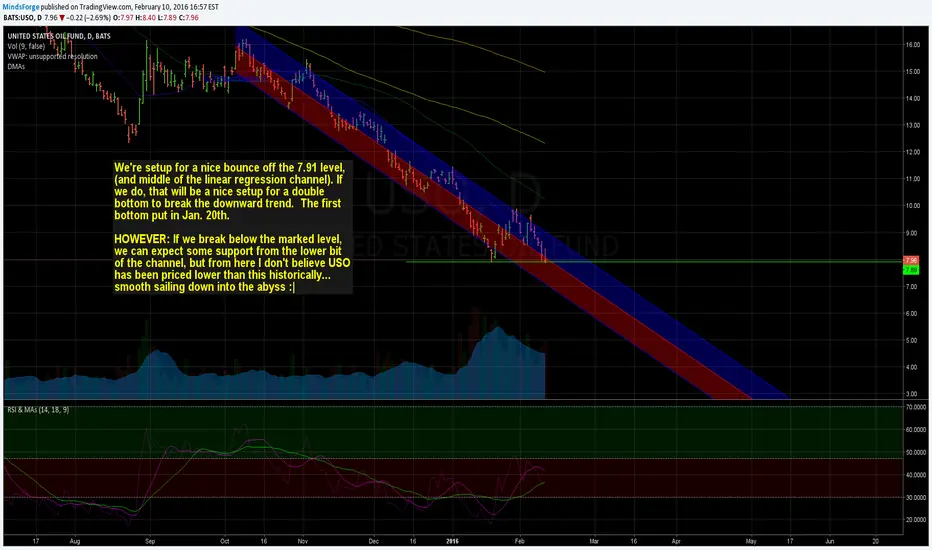
USOIL: Daily view, linear regression and range movement analysisIn this chart I graph the linear regression channels that correspond to each leg in this trend. The trend is mostly up, and it's likely that we're seeing the start of the next major uptrend leg here, since we have found huge buying when retesting the bottom of the long term linear regression channel. Technicals are bullish, without even factoring the fundamentals.
The yearly SMA matched this spot, as well as the lowest volume level since the bottom in oil, which is a really strong support, so b
Uptrend in Tiffany & CoTiffany & Company is an American luxury jewelry based on NY. I'm closely watching this chart, a linear regression r(0.944) shows a nice, systematic uptrend that started a few months ago. Be careful trading this asset since an increased security near the Trump's Tower initially led investors to consider the possibility of a sharp decrease in sales .
---
"The trend is your friend." - Unknown
T
Linear regression suggest an uptrend in RUSSELL 1000A r(0.942) linear regression on Russell 1000 index suggests an uptrend in the coming months. There are two possible scenarios:
(1) the trend continues to travel along the linear regression channel eventually reaching the ~120 level.
(2) in a less likely pattern, the price breaks the 5 regression channel, and then bounces back in the strong support level at ~86
I am going LONG on this. Traders should take special care trading and watch for worldwide events that may have a negative impac
AUDUSD: Key Hidden Levels and Linear regression analysisAUDUSD found support at the upper deviation of the recent downtrend's linear regression channel today. This level coincides with the mid point of the recent VIX 75% retracement, or 'smart money buying spree' key level, which happens after VIX spikes by 5 points or more, and the smart money 'buys the dip' in risk assets, making VIX retrace 75% of its recent climb, reducing option volatility, calming the market and putting a floor below the recent sell off lows. This range, gives 3 levels to monit
SPX: Watching it closely with no positionI'm holding a few trades (refer to my recent posts) but not in any SPX position.
I think we can have a great buy signal soon, so I'm following VIX and the 'Time at mode', linear regression channels and speed lines signals in SPX.
This is a 2-day chart, the timeframe in control of the current downtrend.
The time and price target suggests price can drop to 2095.3 by or before November 9th.
I'll be paying close attention, because if we get a buy signal in that zone, it could be an excellent trade
U
Trading with the Trend, $NYXNyx Gaming Group has just had a 46% price increase in the past two weeks up until its peak. Price is now very overbought and as stated on the chart there are several bearish indications of why this is a good short sale. Also as you can see on the chart, price recently bouced back from the top lin reg line as it did a couple months ago. Price target is middle lin reg line.
NShort
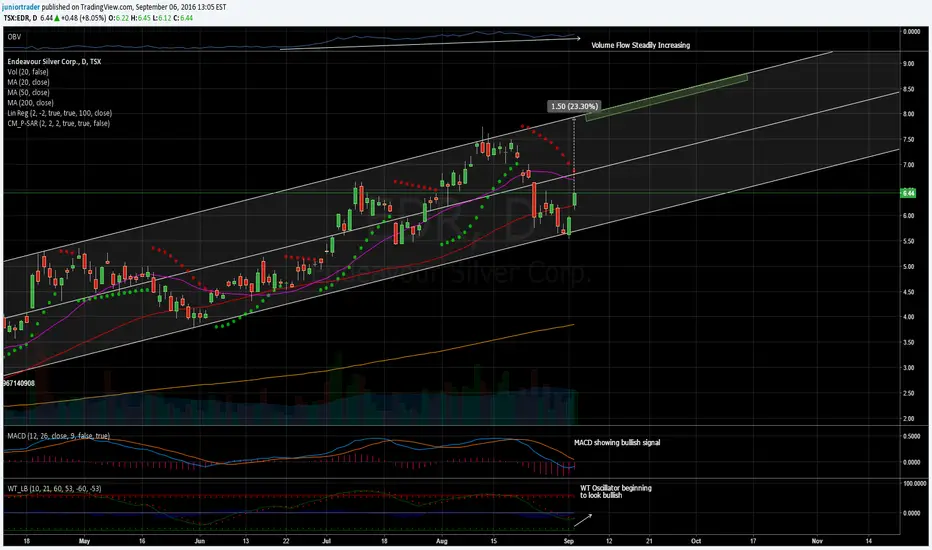
Trading with the Trend, $EDRAs you can see by looking at this chart, price action has been following the upwards linear regression channel. It has just bounced from trading at the bottom lin reg line and is showing several bullish indications as stated on the chart. My price target is around the upper lin reg line (green rectangle).
Trade valid until price closes below bottom lin reg line.
Trading with the Trend, $SVMSilvercorp Metals Inc. is looking like it is ready to continue following its upwards trend. As stated on the chart, there are several bullish indications that support why I believe this will continue to climb. If price breaks above the mid reg line, I am watching for a price target close to the upper lin reg line around $4.65 - $5.00
Trade valid until price closes below lower lin reg line.
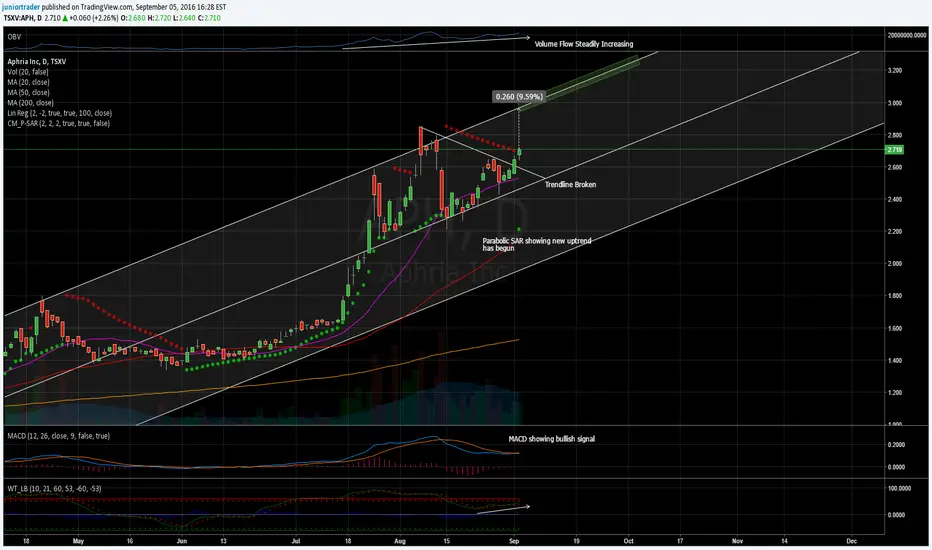
Trading with the Trend, $APH$APH, Aphria Inc. has been uptrending for months now. Using the lin reg lines you can see that it has bounced off of the top and has recovered using the mid line as a support. As stated on the chart there are several bullish indications and Im looking for a price target somewhere along the top lin reg line (green rectangle on chart).
Trade valid until price closes below mid lin reg line.
ALong
ANF Following Linear Regression ChannelAnfield Nickel Corp looks to be at a great price to buy. Looking at the linear regression channel, you can see it is trading near the bottom of it with several indicators showing price will soon begin to move upwards with the channel. Firstly the MACD is about to crossover to a bullish signal, Then the WaveTrend Oscillator is showing price oversold with a slight curve beginning to move up, and lastly the Parabolic SAR is showing the end of a downtrend.
ALong
Horizontal Channel Short, MYCCPrice has bounced off of resistance on the horizontal channel and is on the move down. DMI showing bearish trend, MACD sell signal, 13 Day MA about to cross 9 Day MA, Parabolic SAR about to show sell signal. Volume has also gone down by a large amount. Price targer around $13.24, then will reshort if the trend breaks the middle support.
MShort
Strong Short, Tronox Ltd.Very good short play on Tronox Ltd. This stock has broken its upwards trend posting a lower high after 4 higher highs in a row and it is at the top of the linear regression channel. TROX has bounced off of a resistance line and is experiencing decrease in volume. The MACD is also about to crossover to a sell signal and the Directional Movement Index is showing a downwards trend. Also, the stock is in oversold territory showing at 65 and is about to cross under the 9 Day MA.
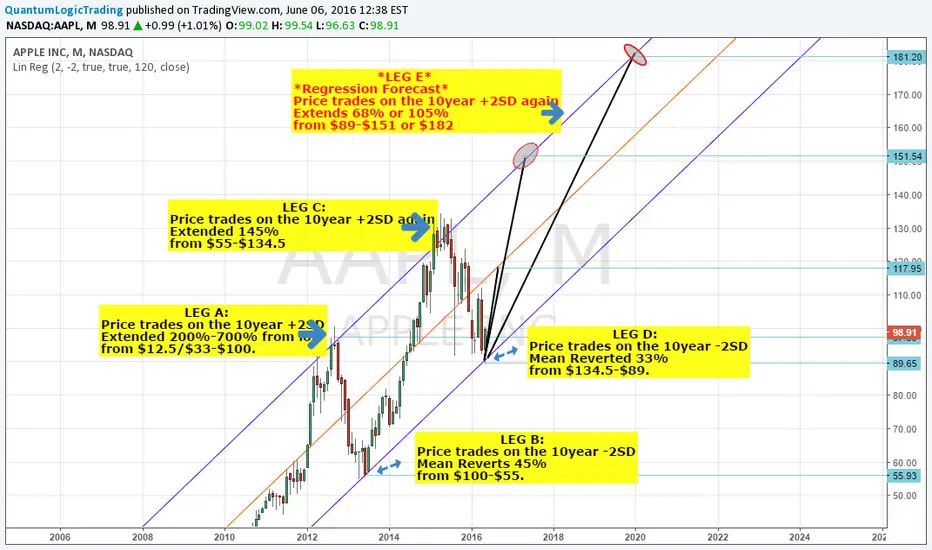
APPLE LONG: $151-$182 - CYCLICAL ANALYSIS & REGRESSION FORECASTAnalysing Apple's (AAPL) historical cyclical price movements and using the +/- 2SD of the linear regression to forecast a naive regression price for the next extension phase.
* Extension leg Regression Forecast*
1. For leg A (Extension Leg 1) we use a start point of $12.5 or $33 (phase doesnt have a clear start), or we could assume a mean value of (12.5+33)/2= $22.75.
- Leg A is then, $12.5, $23.5 or $33 divided by $100, which means Leg A is a price increase of = 700%, 310% or 200%
2