Must-have indicator for a bull market: LSMA 129CME_MINI:NQ1! BINANCE:BTCUSDT
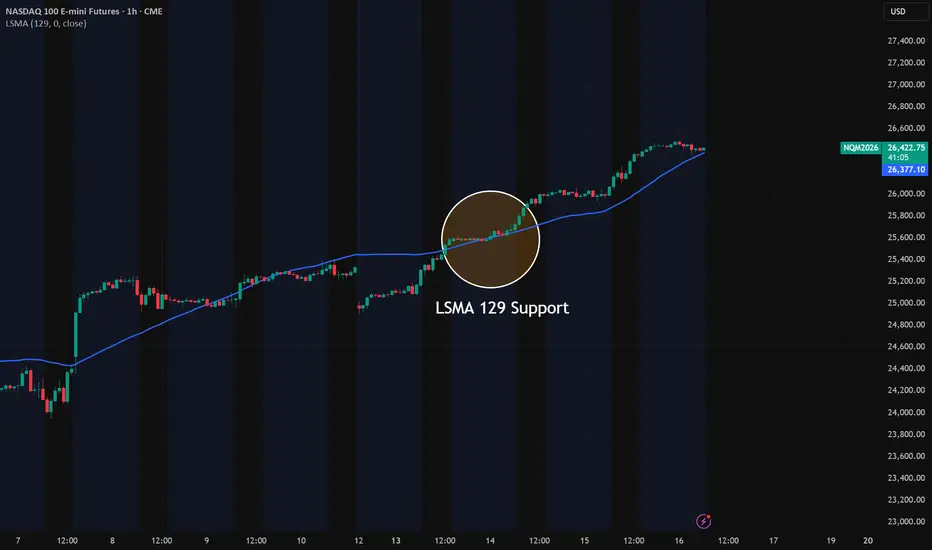
Hi, this is ChartInfo. When there’s a strong uptrend, I always make sure to check if the price is finding support at a moving average called the LSMA. Let’s dive into the LSMA, a powerful auxiliary indicator for support in a bull market.
1. What is LSMA (Least Squares Moving Average)?
LSMA is a moving average that applies the statistical method of "Linear Regression" to price data. That’s why it’s also frequently called the "Linear Regression Indicator."
W
Least Squares Moving Average (LSMA)
Bearish Reversal Alert on EUR/USDTechnical Outlook:
LSMA Indicators: The 45 period LSMA in red and the 53 period LSMA in blue are both trending downwards towards the pivotal 50 level, reflecting a bearish sentiment taking hold.
TSI Behavior: The True Strength Indicator has just crossed and is angling downwards, with the lines beginning to diverge, enhancing the bearish signal's credibility.
MACD Crossover: The MACD line crossing at 46, following last Friday's rally, now exhibits a downward trajectory, aligning with the
BTC/USDHere is a closer look at the BTC/USD 1 day chart:
At the moment of typing this BTC/USD is ranging sideways within the range of around $31,479 and around $29,627 as highlighted by the Horizontal Dotted White Lines with Yellow Shading.
BTC/USD is in a Ichimoku Y-Wave Pattern otherwise known as a Broadening Wedge Pattern or a Megaphone Pattern on this 1 day timeframe.
We have contraction of the Bollinger Bands Upper and Lower Bands. Note that at the moment of typing this BTC has found support f
BTC/USD and its crucial support and resistance areaLooking at this Daily BTC/USD Bitstamp chart from around Oct 2020 to 29th July 2023 (today) we can see a few obvious chart patterns that BTC is still in on this daily chart.
1) Ichimoku Y-Wave Pattern AKA a Broadening Wedge Pattern/Megaphone Pattern
2) Ascending Channel Pattern
3) Descending Channel Pattern
4) Rising Wedge Pattern
We can clearly see the crucial range that BTC must break ABOVE and turn into strong support, which is around $28,709 to $32,360 as highlighted by the channel with
VET/USD - My Longterm PlanVeChain update with my opinions and what i plan to do if my opinions are correct:
Here is a closer look at the 1 day VET/USD chart:
While VET did have a nice move up from $0.0152 to $0.032, that impetus is gone and VET is now making Lower Highs and Lower Lows.
Notes:
VET is still in its Descending Channel Pattern.
VET is back in the Bearish Zone of the Ichimoku Cloud.
VET is under both its 50MA and 200MA levels.
The 50MA has crossed back under the 200MA on this 1 day timeframe.
If we look
V
BTCUSDT A Head & Shoulders to builtBTCUSDT have a Head & Shoulders pattern to built in a Zig Zag downward, in which a wave 1 can be expected for an 2-D swing trade as a breakdown from the micro symmetrical triangle is expected. Thereby, a new supply target will expecting for a reaction. This will be an increase of confidence for the sell-side. Displayed on this H4 chart: daily LSMA (least squares moving average) resistance plus AVWAP (anchored volume weighted average) from peak of wave (ii) of this ending diagonal (as showed on m
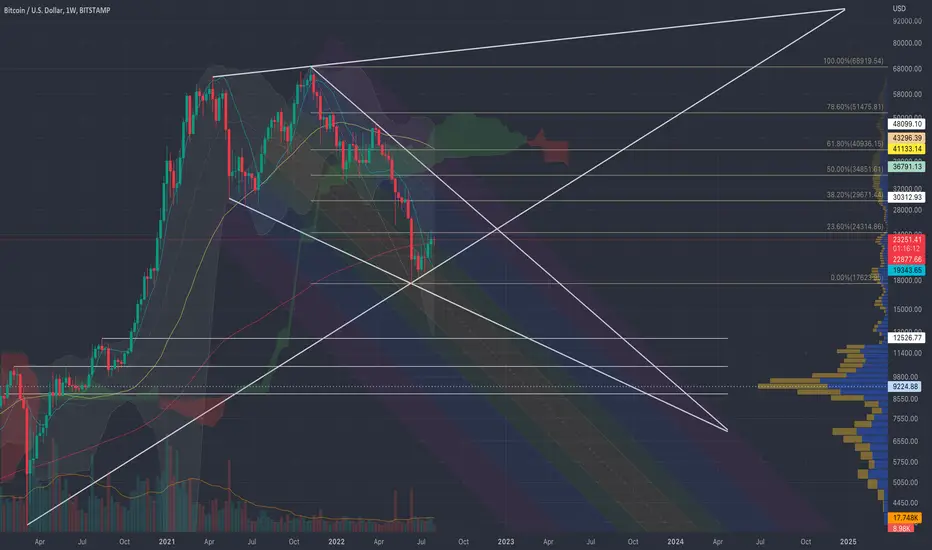
BTC/USD - is BTC still in a downtrend?Let’s have a look at the BTC/USD 1 week chart and see what this chart and indicators are telling us.
BTC is still in a massive Falling Wedge Pattern.
BTC is also still in a massive Ichimoku Y-Wave pattern.
Note that the 50MA is still traveling DOWNWARDS towards the 200MA so we still might see a Death Cross on this 1 week timeframe.
At the moment of typing this, BTC has crossed back under its Least Squares Moving Average (LSMA) on this 1 week timeframe. A successful close below the LSMA and s
BTC/USD - Will we see a Death Cross on the Bitcoin 1 week chart?Looking at the BTC/USD 1 week chart, we can see that the 50MA (Yellow Line) is now getting really close to the 200MA (Red Line). A crossover would signal a Death Cross on this 1 week timeframe.
Looking at the entire history and available data on this BTC/USD 1 week chart, we can see that the 50MA has never crossed under the 200MA on this 1w timeframe. Note that the 50MA did come very close to crossing under the 200MA around the week of the 30th Nov 2015 but in the end, it didn’t happen.
Othe
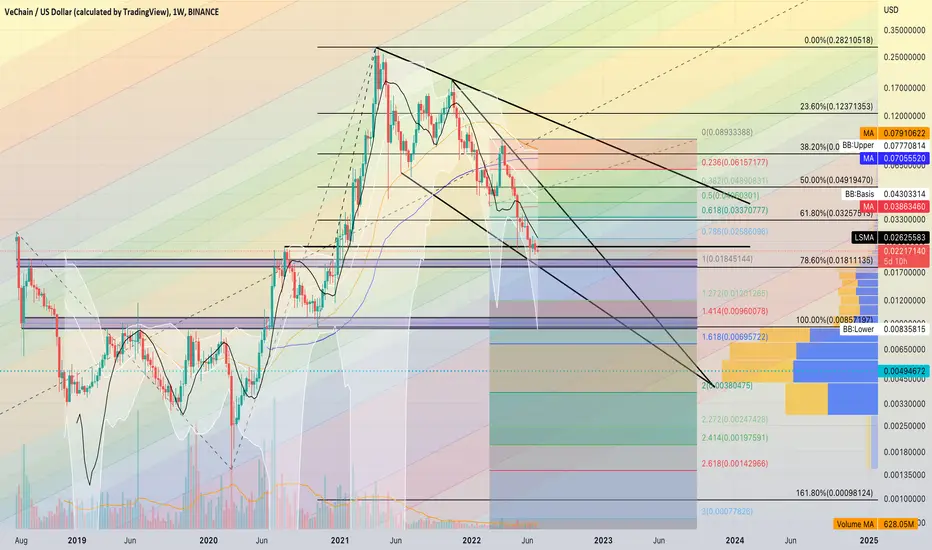
VET/USD - 1w chart Update and my opinionLet’s have another quick look at the VET/USD 1w chart.
Here is a closer look at this 1w chart.
VeChain is still in its Descending Wedge Pattern on this 1w chart. Note that VET failed to close a weekly candle above its upper descending trend line of its Descending Wedge Pattern at around $0.0286. $0.0286 was also the previous high from Mon 23rd Jul 2018.
VeChain is still below its Least Squares Moving Average (LSMA) on this 1w chart.
VET is still below its Bollinger Bands Middle Band Basis
V
BTC OutlookAccording to LSMA, we can assume that Bitcoin has ended the bear market.
LSMA is a technical analysis tool that studies past market data, such as the price and trading volume, and uses it to predict the future direction of an asset’s price.
I have put this indicator in 2 different bear markets' ends of 2015, 2019 and the current year 2022.
2015: The indicator was in a pass between below and above the price. It finally stayed at the same level at the bottom, while price stayed above it and bea
BTC/USD 4hr chart analysisBTC/USD 4hr chart analysis:
On the 17th, BTC had broken downwards out of its Ascending Wedge Pattern on this 4hr chart.
BTC had found some support from its support level at around $21,264 but has now dropped below it. A successful 4hr close below this level will possibly take BTC to its support area at around $20,834 to $20,494.
The Ichimoku Cloud Lagging Span (Chimkou Span) is indicating momentum is downwards at the moment.
The Ichimoku Cloud Conversion Line (Tenkan Sen) is indicating that
BTC/USD - Is it a Rising Wedge or a Falling Wedge?Quick BTC/USD 1 week chart update:
BTC is in a massive Rising Wedge Pattern.
BTC is also in a massive Falling Wedge Pattern.
At the moment of typing this, BTC is still back above its 200MA on this 1 week timeframe.
At the moment of typing this, BTC is still way below its 50MA on this 1 week timeframe.
At the moment of typing this, BTC is still way below its Bollinger Bands Middle Band Basis 20 period SMA. Note that the Upper Band is curving downwards and the Lower Band is starting to curve
UPDATE: MATIC UP 82% after bullish daily signal MATIC pumped 82% after the bullish Supertrend Ninja - Clean signal (green vertical line on the background).
MATIC broke out of the bullish Zone of the Ichimoku Cloud , which is bullish. The RSI is in the bullish zone at 68. If we take a look at the Average Directional Index ( ADX DI) its bullish. The +DI (Green Line) is above the -DI (Red Line). While the Trend Strength is becoming stronger. Since the ADX (Orange Line) is above its 9 Period EMA (Black Line). Currently MATIC is also above its B
M
ADA/USD - 1 day chart analysisHere is a closer look at this ADA/USD 1 day chart:
ADA is in a Ichimoku P Wave (the 2 converging Blue Trend-lines on Chart) on this daily timeframe. This P Wave is potentially Bearish because it is an inverted P. Note that the bottom trend-line of the P Wave is near the 38.20% ($0.430) Fib Retracement level.
The Ichimoku Cloud Conversion Line (Tenkan Sen) is indicating that the Mid-Point of the Short-Term Momentum is upwards at the moment. Note that the Conversion Line (Tenkan Sen) is still u
VET/USD - weekly chart updateLooking at the VET/USD 1 week chart we can see that VET is in a massive Falling Wedge Pattern. A Falling Wedge Pattern is potentially a Bullish Reversal Pattern. Note that the APEX of the Falling Wedge Pattern is located around the end of October 2023. A weekly candle CLOSE BELOW the Lower Converging Trend-line can easily invalidate this pattern as we saw with the previous weekly Rising Wedge Pattern that got invalidated.
Here is a closer look at this VET/USD weekly chart:
At the moment of t
V
BTC/USD - Weekly Chart Falling Wedge Pattern and a P WaveBTC is in a massive Falling Wedge Pattern. A Falling Wedge Pattern is potentially a Bullish Reversal Pattern. Note that the APEX of the Falling Wedge Pattern is around March/April 2024.
BTC is in a Negative Ichimoku P Wave Pattern. BTC has been in 2 Previous P Waves from the all time high and both P Waves ended with further drops to the downside.
BTC is also in a massive Ichimoku Y Wave Pattern. This gives us a new All Time High potential target for BTC if it does eventually rise and especiall
VET/USDThis is a longterm analysis of a possible 3 year outlook for VET/USD using the 1 week chart.
Here is a closer look at this VET/USD 1 week Chart.
On this 1 week timeframe, VET has been back above its Least Squares Moving Average (LSMA) since the week of 7th March 2022. Note that a weekly close ABOVE the LSMA is considered a BUY SIGNAL for this indicator.
VET is also back ABOVE its Bollinger Bands Middle Band Basis 20 Period SMA for this 1 week timeframe. Note that the Upper and Lower Bands a
V
BTC/USD - 1 day chart analysisLooking at the BTC/USD daily chart we can see that BTC is still under its Least Squares Moving Average as well as still under its Bollinger Bands Middle Band Basis 20 Period SMA. Note that we have expansion of the Lower Bollinger Band.
BTC is still in a Descending Pitchfork Pattern and has found some support from its Upper Green Pitchfork Support Line. Note that BTC is still above the Descending pitchfork Median Line. A drop to the Pitchfork Median Line would take BTC to around $20,000 which is
VET/USD - UpdateAs I mentioned in my previous VET post in March, there was always a possibility that VET would drop out of the Bottom Trend-line of its Ascending Wedge and Invalidate that Ascending Wedge Pattern, which has happened. VET also failed to get back above its 0.236 Trend-Based Fib extension Level on that previous chart so we know that $0.087 is the price that VET needs to close a daily candle above solidified with a successful re-test as support.
So let’s move on.
Using a longterm Modified Schiff P
V
ADA/USDA quick look at the ADA/USD 1 day chart:
ADA is still below its Longterm upwards Pitchfork (Blue A,B,C) Median Line on this 1 day timeframe.
ADA is also below its smaller descending Pitchfork (Black A,B,C) Median Line on this 1 day timeframe.
ADA is still below its Bollinger Bands Middle Band Basis 20 Period SMA for this 1 day timeframe. Note that the Lower Band is till pointing downwards and the Upper Band is now moving downwards.
At the moment of typing this, ADA is trying to get back and
BTC/USD 1WLooking at the Trend-Base Fib Extension we can see that BTC found some support from its 0.5 Fib Level at $30,329. If this support level fails then the next Fib Levels are 0.618 at $26,100 and 0.786 at $20,077.
Looking at the Bollinger Bands, we can see that BTC is still way below its Bollinger Bands Middle Band Basis 20 Period SMA on this 1 week timeframe. Note that at the moment BTC is below its Bollinger Bands Lower Band.
Looking at the Least Squares Moving Average (LSMA) we can see that BTC
ADA/USDAt the moment of typing this, ADA is still below its longterm Pitchfork Median Line and has been below it since the 3rd March 2022.
ADA is also in a Descending Pitchfork Pattern (Black A,B,C). At the moment, ADA is still above its Descending pitchfork Median Line. At the moment, ADA has found some support from its Descending Upper Yellow Pitchfork Support Line.
At the moment ADA is back above its Least Squares Moving Average (LSMA) for this 1 day timeframe.
At the moment, ADA is also back abo
BTC\USDA quick BTC/USD update:
At the moment, BTC is testing its crucial Descending Resistance Line of its Triangle Pattern as well as testing its crucial Resistance Area. Note that BTC has found resistance from this Descending Resistance Line 3 times previous and you can clearly see the interactions of the previous Daily Candles with this Resistance/Support area.
Note that the APEX of the Triangle Pattern is located around the 23rd April 2022.
At the moment of typing this, BTC is back above its Lea
BTC/USD - 0.236 Trend-Based Fib Extension levelThe Trend-Based Fib Extension level 0.236 at $42,492.75 is the level BTC needs to close above and successfully re-test as support for continued upwards momentum on this 1 day timeframe. This level is also where its descending trend-line is located exactly on the 0.236 level.
At the moment, BTC is also back above its Least Squares Moving Average, its Bollinger Bands Middle Band Basis 20 Period SMA as well as its VPFR POC for the fixed range of 14x daily candles that i have selected. Note that BT