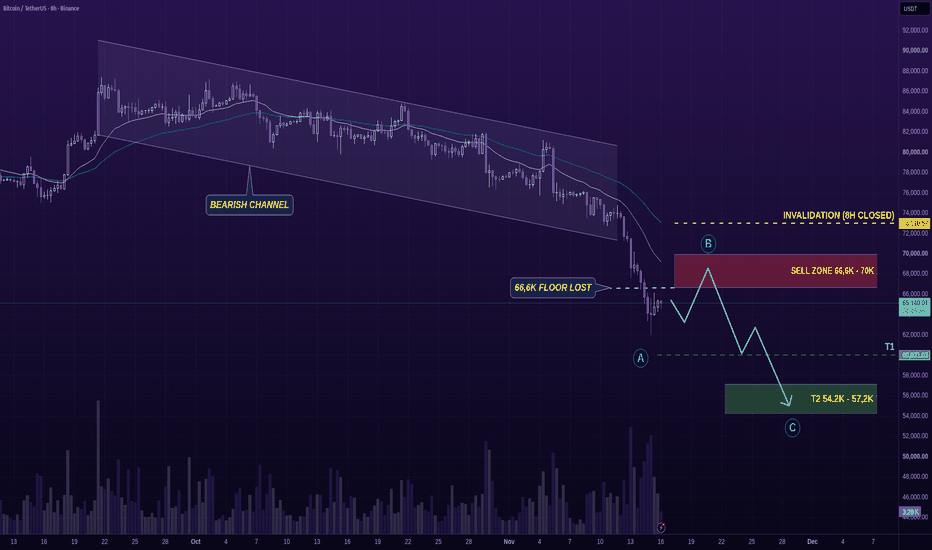
BTCUSDT (8H) – The Broken Floor Changes WaveBitcoin has lost another important floor, and the latest selloff has pushed price below $66.6K. But after such an aggressive decline, I am more interested in the next failed recovery than another red candle. Here's the map.
🗺️ Ethan Map
Ⓐ The structure: BTC remains under pressure inside its broader descending channel on the 8H chart. Lower highs continue to define the trend, while EMA 21 and EMA 50 are both overhead.
The loss of $66.6K is particularly important. A level that previously attr
M-pattern
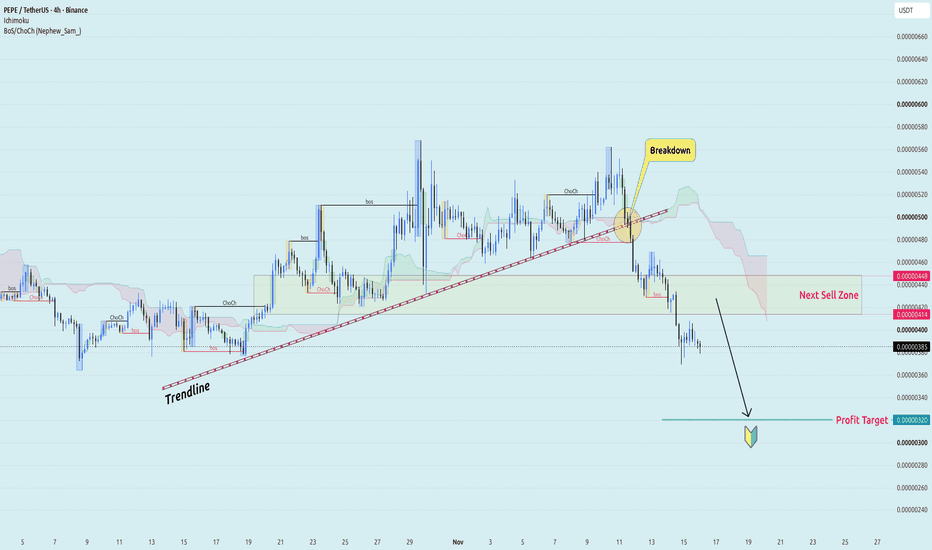
PEPE/USDT – Broken Trendline , Sellers Stills Control🟢 BINANCE:PEPEUSDT has lost an important part of its bullish structure. The H4 chart shows a decisive breakdown below the rising trendline, followed by successive bearish structure breaks and a sharp decline beneath the Ichimoku cloud. Buyers have attempted to stabilize the price, but the broader structure continues to favor sellers.
The area I'm watching is 0.00000414–0.00000448. Previously a support region, it now represents a potential selling opportunity if PEPE manages a corrective rebo
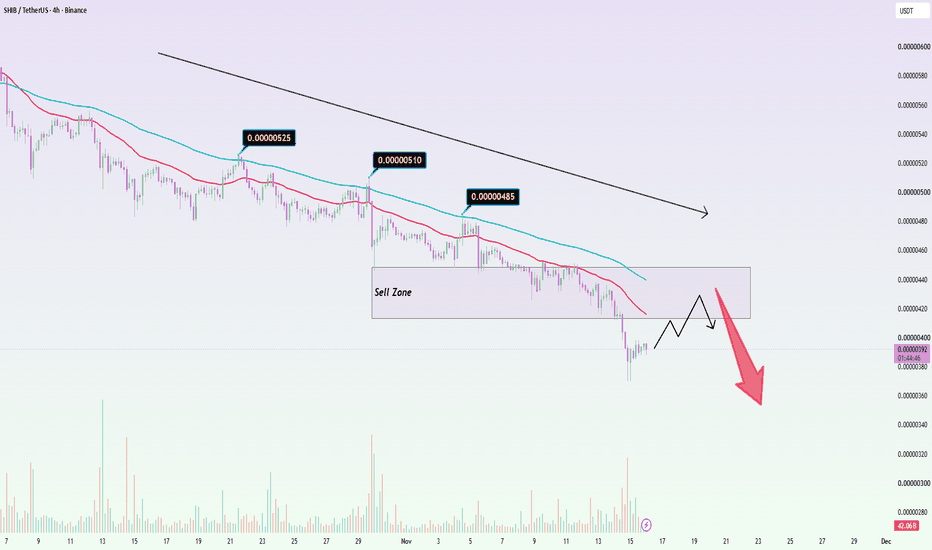
SHIBUSDT: Lower Highs Keep Winning, Another DropShiba Inu continues to struggle, and the latest breakdown suggests that sellers are far from finished. Despite a modest recovery from recent lows, SHIB remains firmly bearish, with price trading around 0.00000392.
Looking at the 4H chart, the pattern is difficult to ignore. Each recovery has ended at a lower high, falling from 0.00000525 to 0.00000510 and then 0.00000485. Both EMAs continue sloping downward, while the recent breakdown below 0.00000415 confirms that sellers remain in control.
T
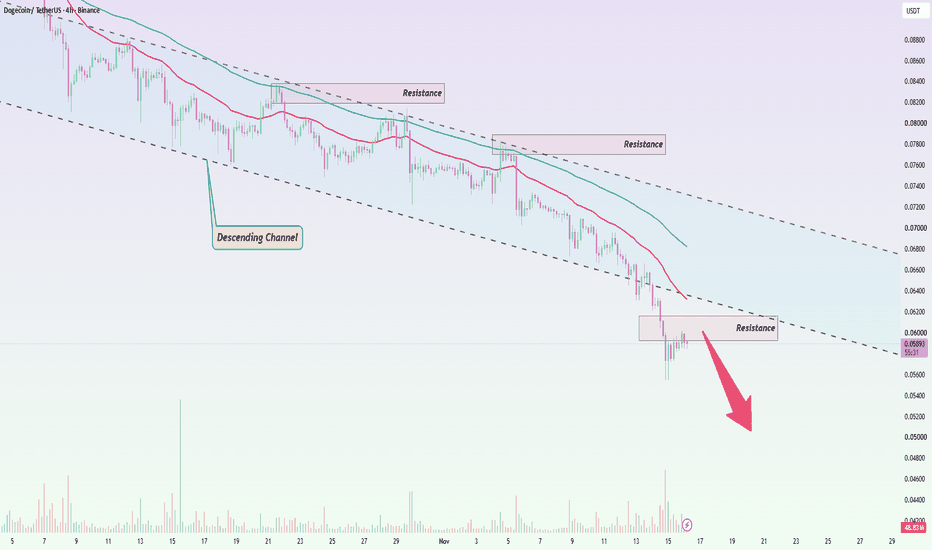
DOGEUSDT: Next Bearish Step, Downward WaveDogecoin's latest decline is becoming difficult to ignore. After weeks of failed recovery attempts, DOGE has fallen below its descending channel, with price now hovering around $0.059. The recent bounce looks more like a temporary pause than the beginning of a meaningful reversal.
On the 4H chart, sellers have consistently defended lower resistance levels, while both EMAs continue sloping downward. The latest breakdown has brought $0.059–$0.0615 into focus as a potential resistance zone. This f
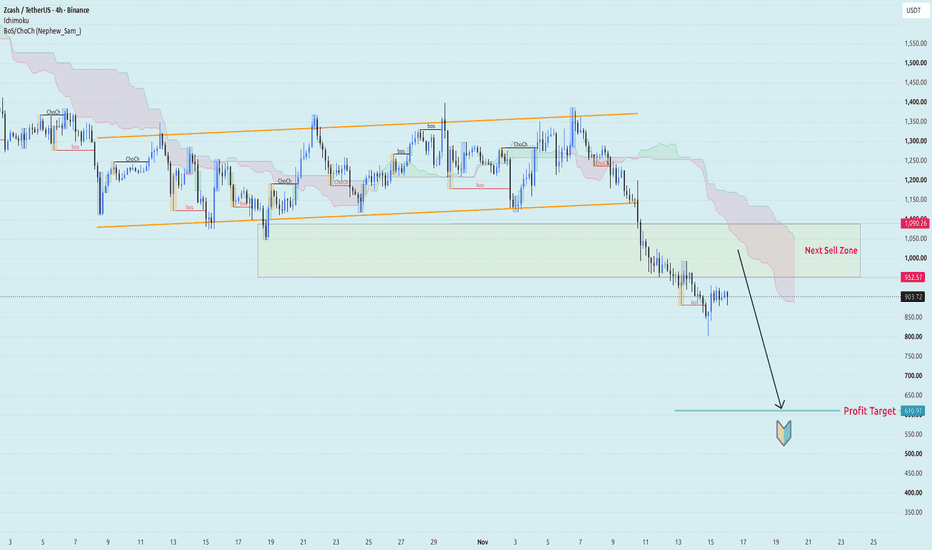
ZECUSDT – Broken Channel Leaves 610 in Focus🟡 BINANCE:ZECUSDT has suffered a significant structural breakdown on the H4 chart. After repeatedly testing the lower boundary of its previous ascending channel, price finally broke through support and accelerated lower, establishing a new sequence of bearish structure breaks.
What stands out is the market's failure to reclaim lost support. With ZEC trading near $903 and the Ichimoku cloud still overhead, I see the $952.57–$1,090.26 resistance zone as the next area where sellers could regain
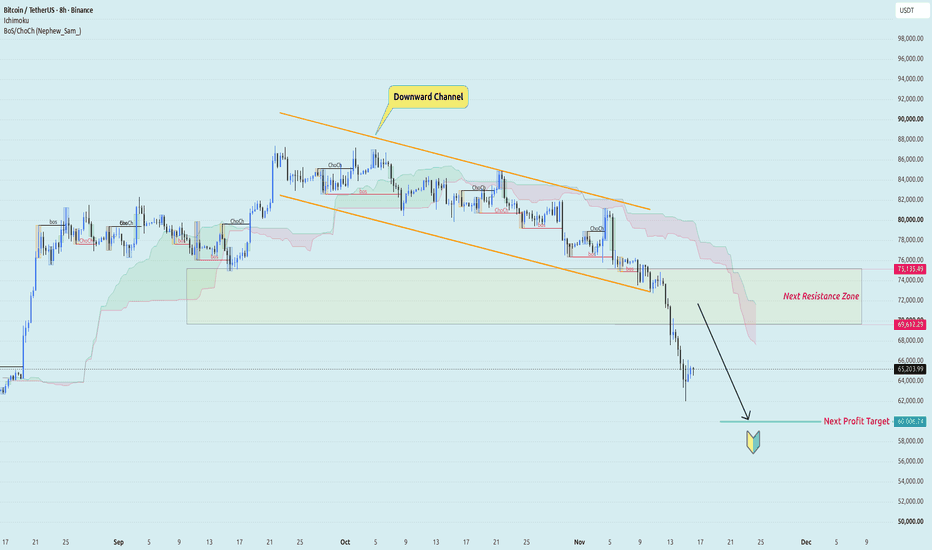
BTC/USDT – Broken Floor Puts 60K in Focus🟠 BINANCE:BTCUSDT has extended its decline beyond the lower boundary of the descending channel on the H8 chart. Repeated bearish structure breaks, lower highs and persistent resistance from the Ichimoku cloud confirm that sellers remain firmly in control.
The important shift is that 69,612–75,135, previously a support area, is now overhead resistance. With Bitcoin already near $65K on the chart, I would rather wait for a corrective rebound into this zone than chase an extended decline. A fai
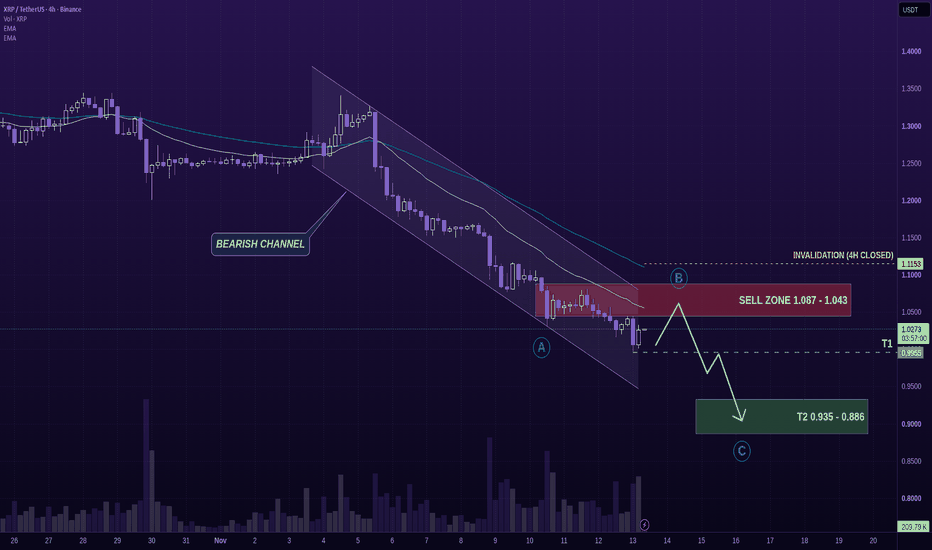
XRPUSDT (4H) – Channel Keeps Sellers in ControlXRP has been falling inside a descending channel, and every recovery is struggling to change the bigger picture. The question now is whether the next bounce will attract buyers — or give sellers another opportunity. Here's the map.
🗺️ Ethan Map
Ⓐ The structure: XRP continues to respect its bearish channel on the 4H chart, with lower highs and lower lows confirming the broader selling pressure. Both EMA 21 and EMA 50 remain above price, reinforcing the bearish structure.
Ⓑ The entry: I am wa
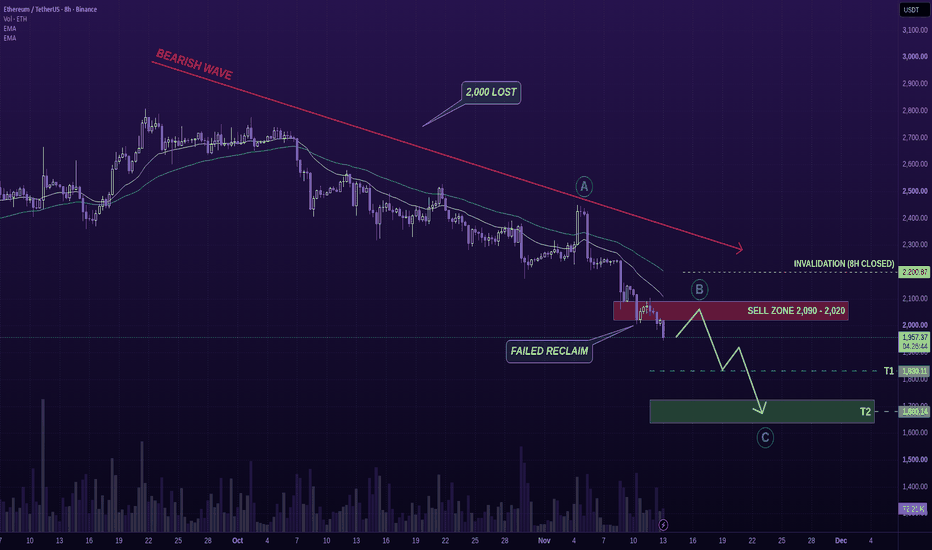
ETHUSDT (8H) – Lost 2,000 Level Invite SelloffEthereum has already lost the $2,000 level, and that changes the tone of this chart completely. What used to act as support is now at risk of turning into resistance. Here's the map.
🗺️ Ethan Map
Ⓐ The structure: ETH remains in a clear bearish wave on the 8H chart. Price is trading below both EMA 21 and EMA 50, while the broader sequence still points to lower highs and lower lows. The loss of $2,000 is the key technical shift here.
Ⓑ The entry: I am watching the sell zone at $2,020–$2,090.
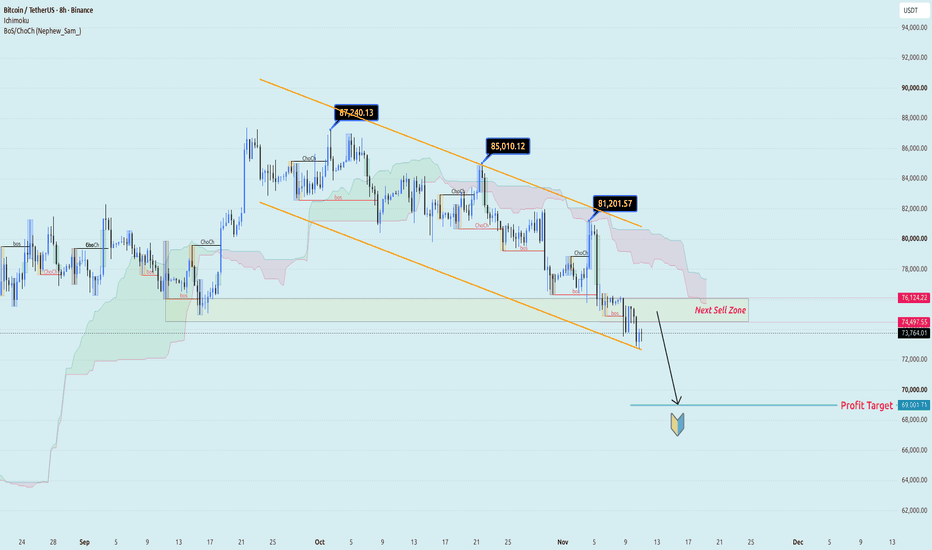
BTC/USDT – Lower Highs Keep 69K in Focus🟠 BINANCE:BTCUSDT remains bearish on the H8 chart, moving within a descending channel. Three successive lower highs at 87,240, 85,010 and 81,202 confirm weakening buying momentum, while the latest breakdown has pushed price below previous support and Ichimoku resistance.
I'm watching the 74,498–76,124 sell zone. A rebound into this area followed by rejection would confirm that former support has become resistance, reinforcing the bearish continuation setup.
🎯 Target: 69,002
Macro Market
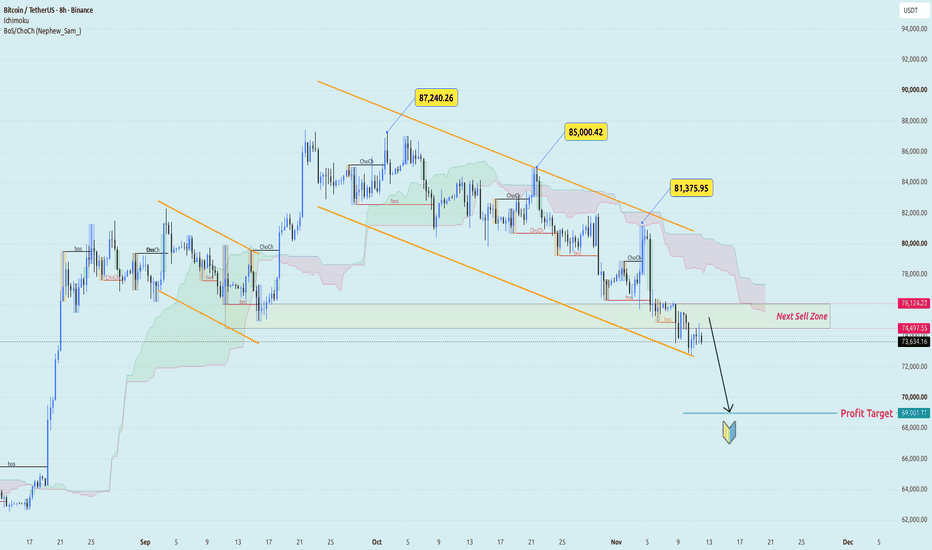
BTC/USDT – Lower Highs Keep 69K Within Reach🟠 BINANCE:BTCUSDT remains firmly bearish on the H8 chart, with successive lower highs at 87,240, 85,000 and 81,376. Price continues to weaken within the descending channel, while repeated bearish structure breaks and overhead Ichimoku resistance reinforce sellers' control.
I'm watching the 74,498–76,124 sell zone. A recovery into this former support area, followed by rejection, could trigger another bearish leg toward the lower target.
🎯 Target: 69,002
Market Context: the US Dollar has
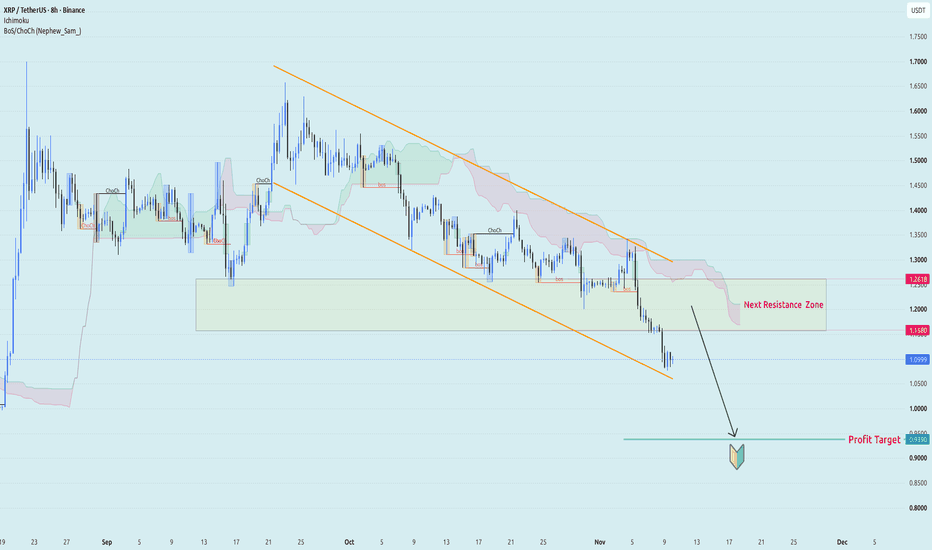
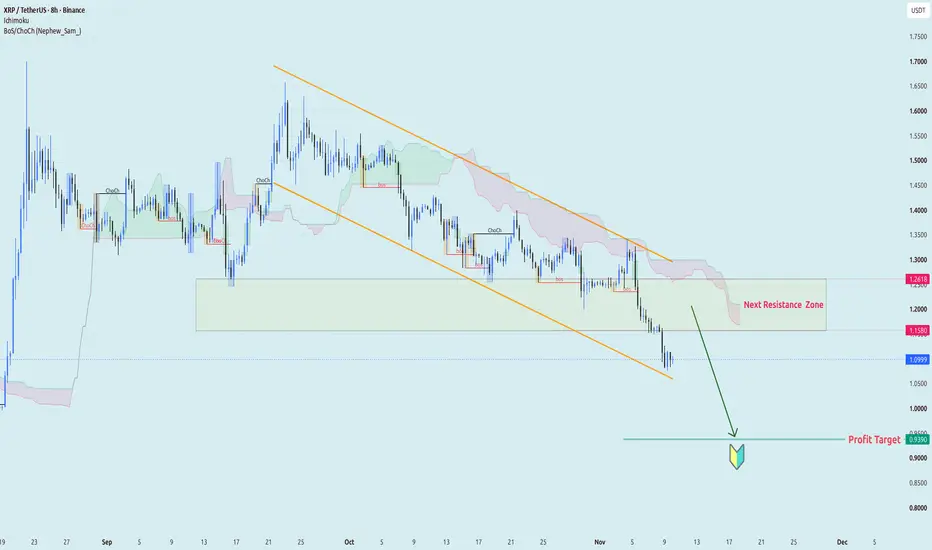
XRP/USDT – Broken Support Opens Path Downward⚫ BINANCE:XRPUSDT continues to decline within a descending channel on the H8 chart. Repeated bearish structure breaks and persistent trading below the Ichimoku cloud suggest sellers remain firmly in control.
The latest breakdown has turned 1.1580–1.2618 into an important resistance zone. I'm watching for a recovery into this area, where renewed selling pressure could trigger another downward move.
🎯 Target: 0.939
Market Context: XRP spot and futures activity continues to show sell-side
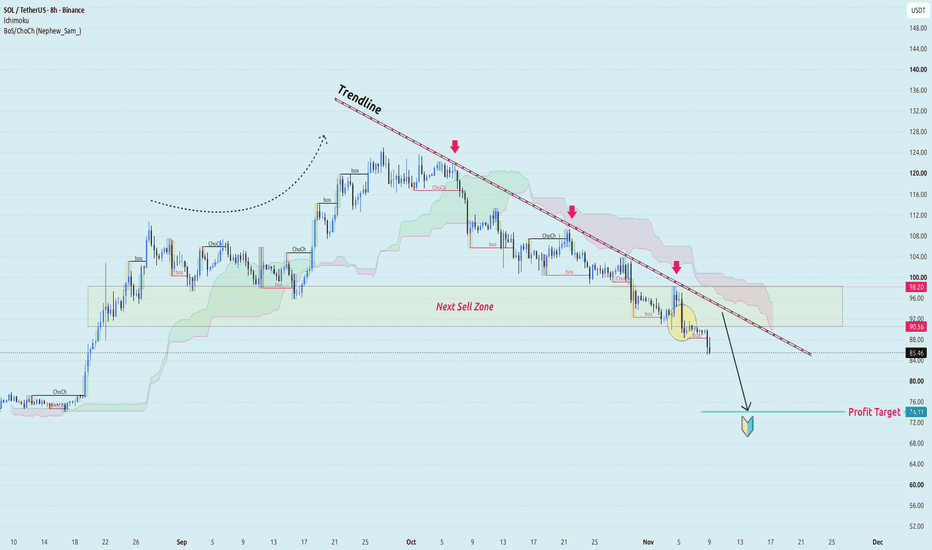
SOL/USDT – Breakdown Below Pressure🟣 BINANCE:SOLUSDT remains under strong bearish pressure on the H8 chart. Price has broken below the $90 support area, extending its lower-high structure beneath the descending trendline and Ichimoku cloud.
I'm watching the 90.56–98.20 sell zone. A recovery into this former support area, followed by rejection, would reinforce the bearish continuation setup.
🎯 Target: 74.11
Market Context: SOL-focused ETFs recorded $26.3M in net outflows last week, marking five consecutive weeks of withd
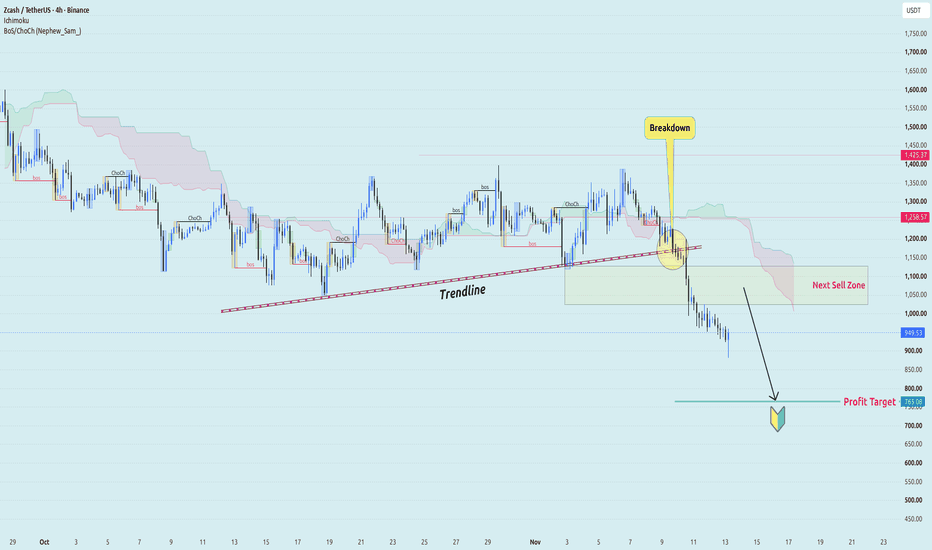
ZEC/USDT – Trendline Breakdown Eyes to 765🟡 BINANCE:ZECUSDT has lost its rising trendline on the H4 chart, triggering a sharp selloff below previous support. Successive bearish structure breaks and price remaining beneath the Ichimoku cloud suggest sellers continue to dominate.
The breakdown has shifted the market structure decisively lower. I'm watching the $1,040–$1,140 resistance area for a potential recovery and rejection before another bearish continuation.
🎯 Target: $765.08
Market Context: a stronger US Dollar, rising Tr
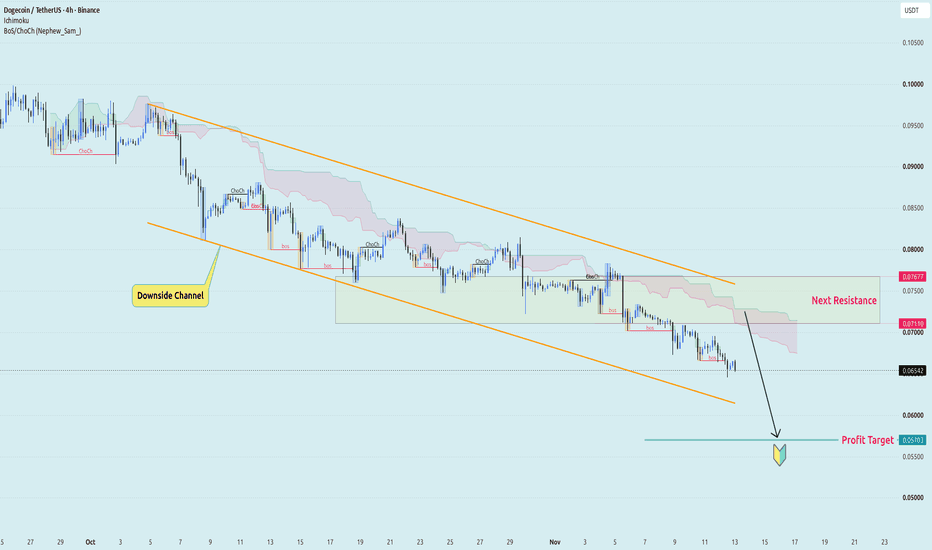
DOGE/USDT – Downtrend Still Points Toward 0.057🟡 BINANCE:DOGEUSDT continues to lose ground on the H4 chart, with lower highs and repeated bearish structure breaks keeping sellers in control. Price remains below the Ichimoku cloud, while the descending channel continues to define the broader trend.
The key area is 0.07110–0.07677, where previous support has turned into resistance. A weak rebound followed by rejection could provide the next SELL opportunity, with the lower channel boundary as an intermediate level to watch.
🎯 Target: 0.0
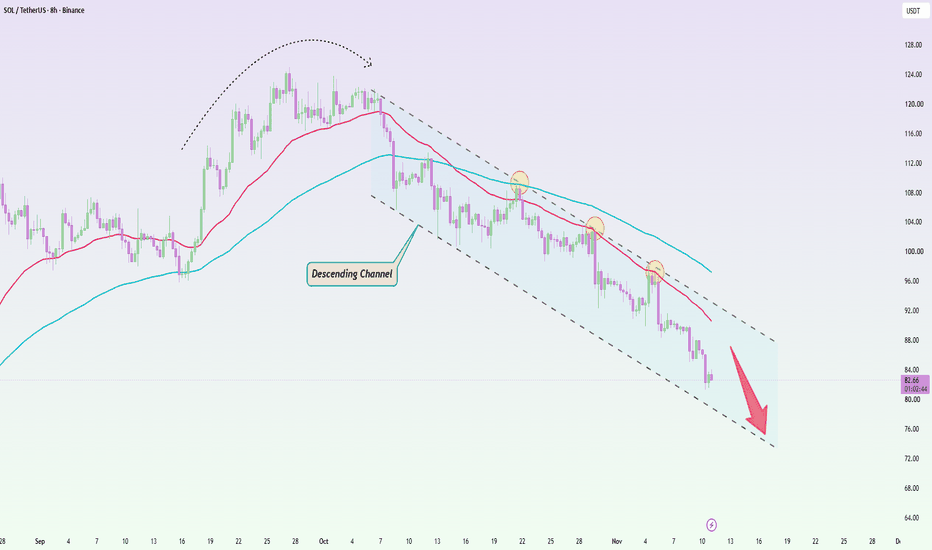
SOLUSDT: Lower Highs Keep Winning, Next TargetSOL remains firmly bearish on the 8H chart, with repeated rejections along the descending channel confirming that sellers continue to dominate. Each recovery has produced a lower high, while price has now slipped toward 82.5.
Both EMAs are still declining above price. The 87–90 resistance area could attract another wave of selling if SOL attempts a short-term recovery. So far, there is little evidence of a sustained trend reversal.
The macro environment reinforces this weakness. October's US C
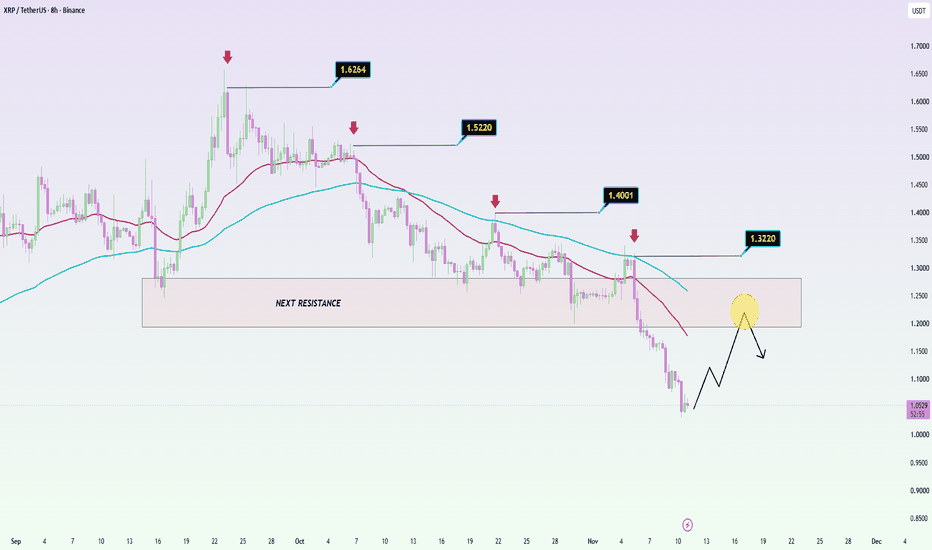
XRPUSDT: Can Bounce — Downtrend Not OverXRP remains under heavy selling pressure, but after such an extended decline, a short-term recovery could be developing. The bigger question is whether buyers can sustain that rebound.
On the 8H chart, successive lower highs at 1.6264, 1.5220, 1.4001 and 1.3220 confirm a persistent bearish structure. Price remains below both declining EMAs, while the former 1.20–1.28 support zone has become major resistance.
The macro backdrop also favors caution. October's US CPI rose 0.4%, above the 0.3% for
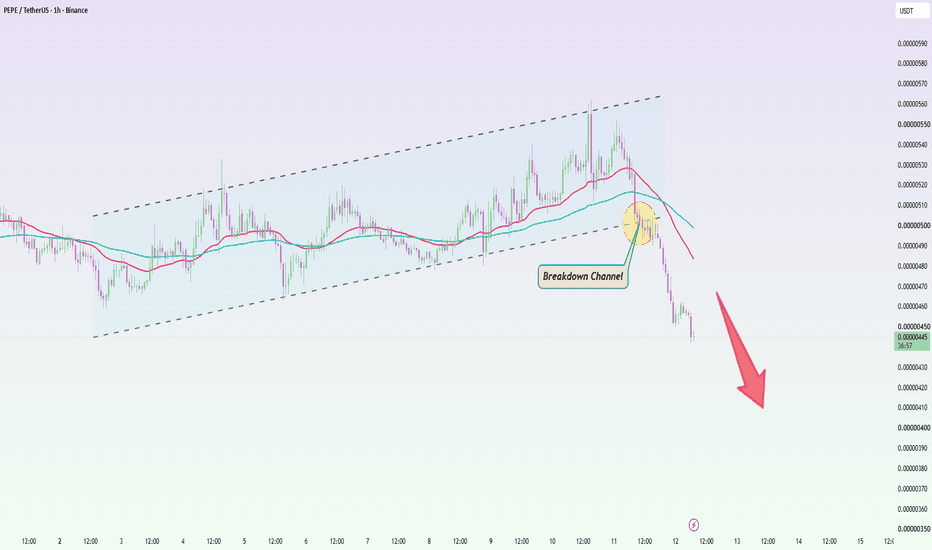
PEPEUSDT: Breaks Rising Channel — Sellers BackPEPE's recent recovery has taken a sharp bearish turn. After several attempts to extend its upward movement, price has broken below the ascending channel, suggesting that buyers have lost control of the short-term structure.
On the 1H chart, PEPE is trading around 0.00000446, beneath both declining EMAs. The breakdown near 0.00000500 has accelerated selling pressure, while the former channel support now acts as resistance. Any recovery toward 0.00000485–0.00000510 could face renewed selling.
T
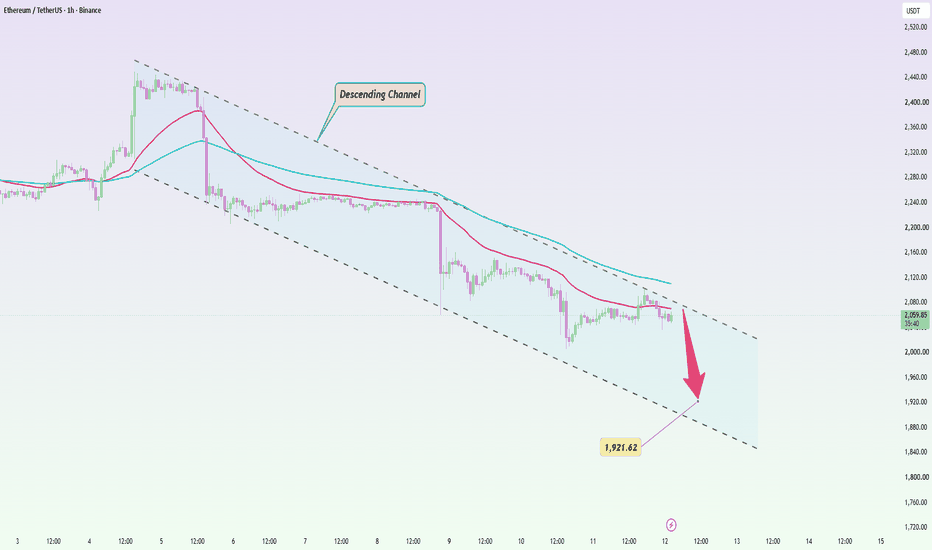
ETHUSDT: Descending Channel Keeps 1,920 in FocusEthereum continues to face selling pressure as repeated recovery attempts fail to break the descending channel. With price hovering around 2,058, sellers remain in control of the short-term trend.
On the 1H chart, ETH is trading below both declining EMAs, while the 2,080–2,120 resistance area continues to limit upside. The series of lower highs suggests that any recovery could become another opportunity for sellers to regain control.
The macro backdrop reinforces this weakness. US inflation ex
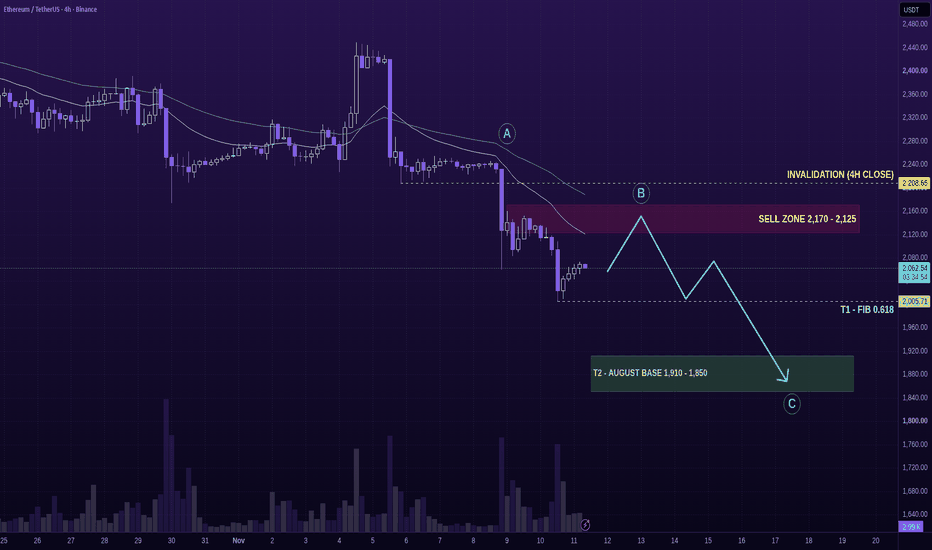
ETHUSDT (4H) – Broken Support, August Base BelowETH bounced from the $2,005 area, but a bounce is not a trend reversal. The old floor has broken, and sellers may get another chance higher up. Here's the map.
🗺️ Ethan Map
Ⓐ The structure: ETH lost its $2,206–$2,250 shelf and keeps making lower highs on the 4H. Both EMA 21 and EMA 50 sit overhead. The recovery from the recent selloff remains a countertrend move until buyers prove otherwise.
Ⓑ The entry: watch $2,125–$2,170 for a bearish 4H rejection. This is where I want sellers to show up,
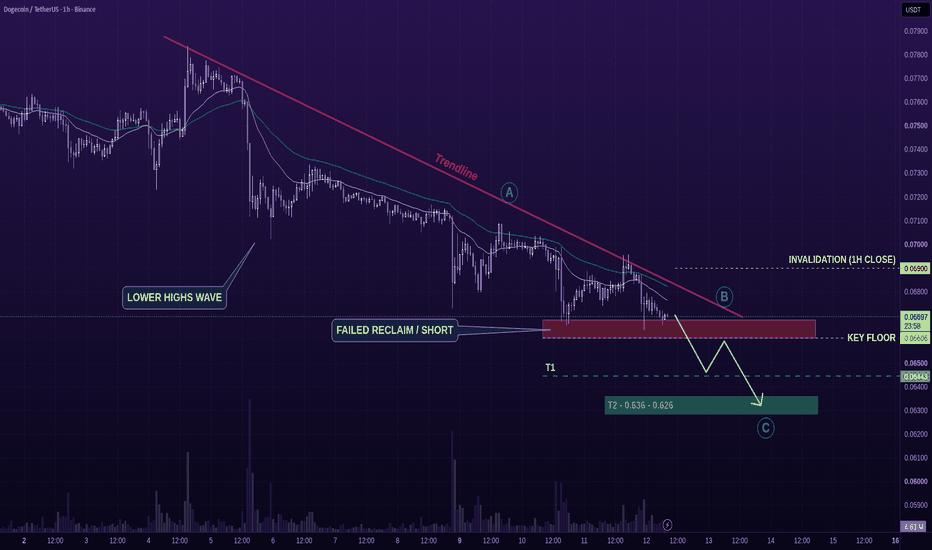
DOGEUSDT (1H) – Lower Highs Keep the Pressure onDOGE is trying to stabilise, but the structure still looks heavy. The market keeps printing lower highs, and price is sitting right on a floor that now looks vulnerable rather than strong. Here's the map.
🗺️ Ethan Map
Ⓐ The structure: DOGE remains trapped under a descending trendline, with a clear lower-highs sequence across the 1H chart. EMA 21 and EMA 50 are both overhead, which tells me buyers still have not regained short-term control.
Ⓑ The entry: the key level is 0.06606. I am not inte
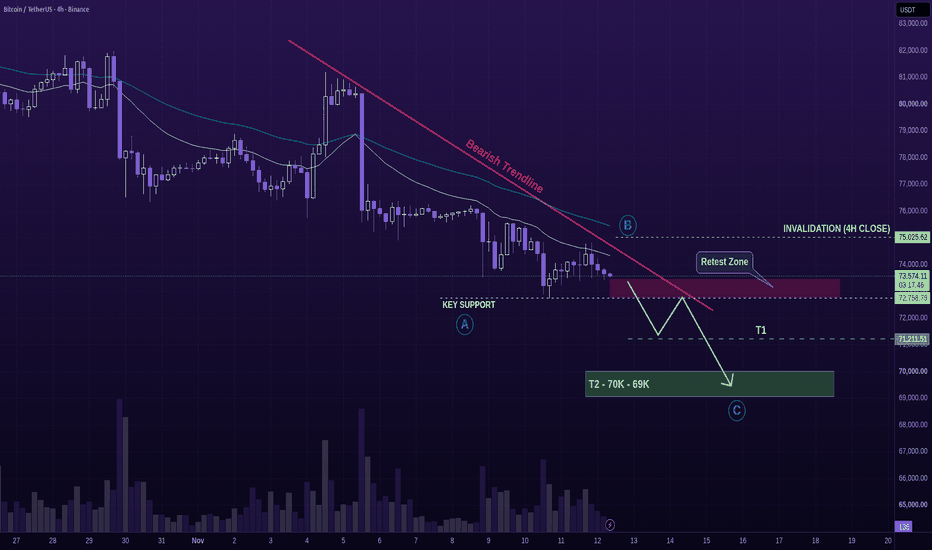
BTCUSDT (4H) - Retest Open the Next Leg DownBitcoin is trying to stabilise, but every recovery still faces selling pressure. The real test is not whether BTC can bounce — it is whether buyers can reclaim broken support. Here's the map.
🗺️ Ethan Map
Ⓐ The structure: BTC continues to form lower highs beneath a descending trendline. EMA 21 and EMA 50 remain overhead on the 4H chart, keeping the broader structure bearish.
The key level is $72,758.79. This is where the next directional move could be decided.
Ⓑ The entry: I am watching fo
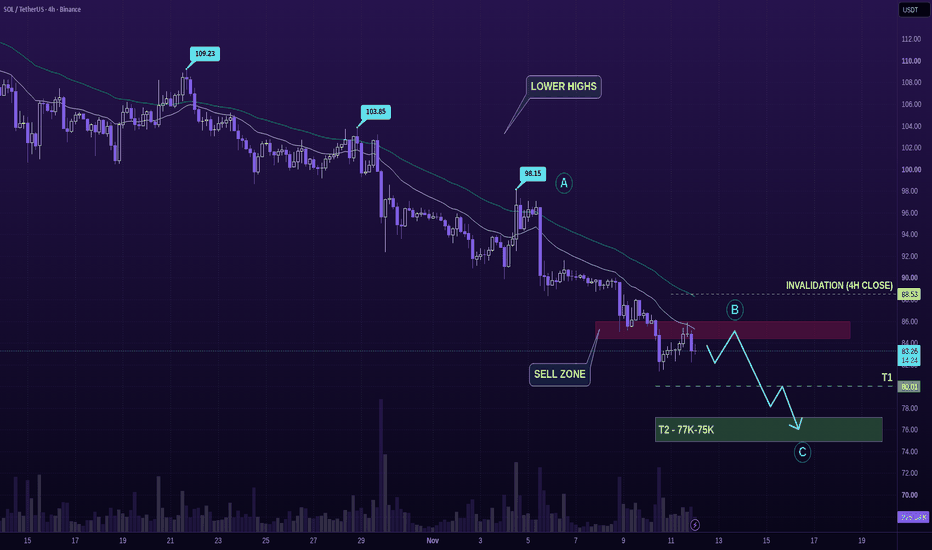
SOLUSDT (4H) – Lower Highs Keep Solana Under PressureSolana is trying to bounce, but the bigger 4H structure still points lower. Price remains below both EMA 21 and EMA 50, while every rebound continues to print a lower high. Here's the map.
🗺️ Ethan Map
Ⓐ The structure: SOL has been in a clear sequence of lower highs, with the swing highs stepping down from 109.23 to 103.85 to 98.15. That tells me sellers still control the market, and the current rebound looks more like a relief bounce than a real reversal.
Ⓑ The entry: I am watching the sel
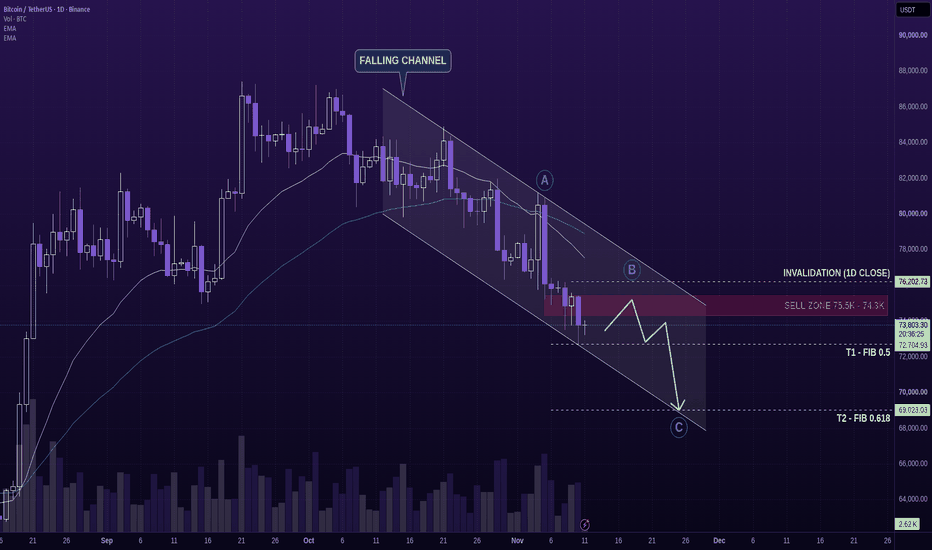
BTCUSDT (1D) – The Bouncing Trap, Next Bearish AimSince mid-October, Bitcoin has been sliding inside a falling channel: every high lower, every bounce sold. Hot CPI just knocked it to the channel floor at 72.7K. I’m not shorting the floor. I’m waiting for the bounce. Here’s the map.
🗺️ Ethan Map
Ⓐ The channel: highs keep stepping down (84.9K → 82.0K → 81.2K), and five straight weekly candles have closed red. Sellers own this trend until price says otherwise.
Ⓑ The entry: a bounce into 74.3–75.5K, the old floor from Sep 15 and Nov 6 that now
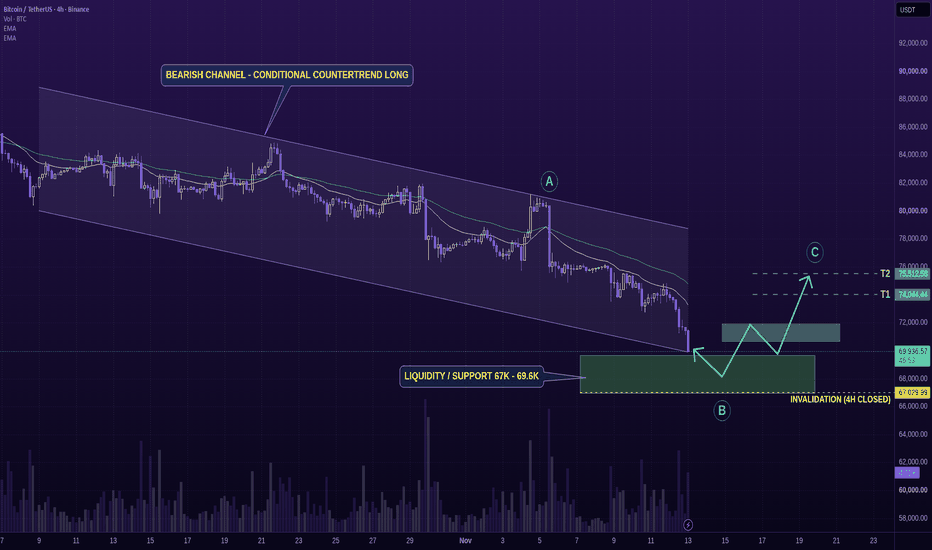
BTCUSDT (4H) – Channel Floor Trigger Reversal?Bitcoin is approaching the lower boundary of its descending channel. Sellers still control the bigger picture, but chasing another short directly into support may be just as risky as buying too early. Here's the map.
🗺️ Ethan Map
Ⓐ The structure: BTC remains below EMA 21 and EMA 50, with lower highs keeping the 4H trend bearish. The difference now is location: price is approaching the lower channel boundary and the $67,000–$69,600 liquidity zone. This is where I will watch for a potential ex