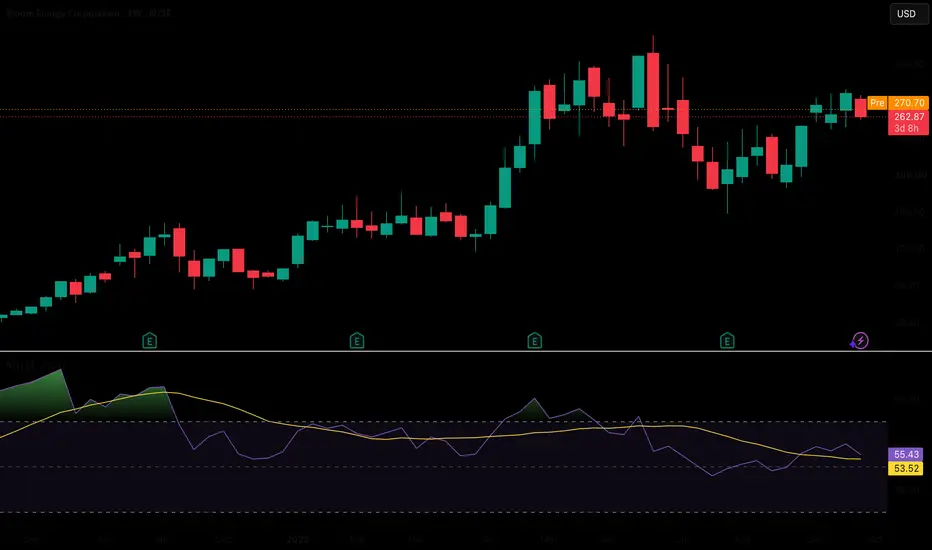
$GRAB Bullish Signal Indicators:
(1) LSMA (Least Squares Moving Average).
(2) HULL SUITE.
BULLISH Conditions:
A) The LSMA crossing ABOVE the HULL SUITE.
B) The cross is UNDER the current share price.
C) The cross occurs while the HULL SUITE is BEARISH.
This cross is a nice, generally/somewhat reliable, BULLISH signal.
And, obviously, the inverse conditions are true:
BEARISH Conditions:
A) The LSMA crossing BELOW the HULL SUITE.
B) The cross is ABOVE the current share price.
C) The cross occurs while
Moving Averages
Complete Guide to MACD Strategy - Simple Accurate and ProfitableComplete Guide to MACD Strategy - Simple, Accurate, and Profitable Rules
A comprehensive and detailed guide explaining how to trade effectively using the Moving Average Convergence Divergence (MACD) indicator in alignment with overall market structure and price action.
Overview:
The MACD (Moving Average Convergence Divergence) is one of the most reliable momentum and trend-following indicators available to technical traders. While many beginner traders rely solely on generic indicator crosso
ARKK: Big Cup Above 50 SMA at Resistance💡 Swing setup idea
50 SMA Strategy
🔎 Analysis summary:
The innovation ETF has reached resistance. We can also see a closing of a big cup above the 50-day moving average. This alignment of trend, pattern and level makes the breakout area key to watch. The upside potential is projected by the depth of the cup from the breakout point.
👀 Levels to watch:
Entry trigger: Break above $92.65
Target: $121.70
Stop: Under the resistance
💬 Will ARKK break through resistance and continue higher? Le
CDNS: 50 SMA Cross with Cup Pattern at Resistance💡 Swing setup idea
50 SMA Strategy
🔎 Analysis summary:
The stock just crossed the 50-day moving average and is reaching resistance. We can also see a closing of a cup pattern. This alignment of trend, pattern and level makes the breakout area key to watch. The upside potential is projected by the depth of the cup from the breakout point.
👀 Levels to watch:
Entry trigger: Break above $331.20
Target: $386.90
Stop: Under the breakout
💬 Will CDNS break through resistance and continue highe
Cut Through the Noise (on DXY) With This Free IndicatorWhen the data is messy, I’d rather watch what price is actually respecting.
Today was a good example. PCE came in softer, but ADP and Chicago PMI were stronger. Instead of trying to overthink every release, I just watched whether DXY actually changed behaviour.
I will always be a proponent of saying that everyone should use a Bollinger Band as their default "moving average".
The reason is because price can wick-wack around an EMA, and produce confusing signals. The envelope of a Bollinger Ban
Bitcoin Cash Retest: How Deep Could BCH Correct?
📈 Bitcoin Cash After the EMA 200 Breakout: How Deep Could the Retest Go?
Bitcoin Cash has finally given us something technically interesting after spending a long period under pressure.
On the daily chart, BCH managed to reclaim the 200-day EMA and then accelerated sharply higher. That move changed the character of the chart and established a more constructive rising structure.
But strong moves rarely continue in a straight line.
After the breakout, BCH became stretched, the RSI pushed i
Is Corning’s Uptrend Intact?Corning had a big move in the first half and pulled back in the third quarter. Now, some traders may think its uptrend remains intact as the fourth quarter approaches.
The first pattern on today’s chart is the series of lower highs since early July. GLW is pushing against that falling trendline. Could a breakout through resistance draw buyers?
Second, the fiber-optic company has followed its rising 200-day simple moving average (SMA) higher. That may be consistent with a long-term uptrend.
Th
CAKE: 50 SMA Cross with Small Cup and Strong Volume💡 Swing setup idea
50 SMA Strategy
🔎 Analysis summary:
The stock is crossing the 50-day moving average, closing a small cup. We can also see strong buyers volume stepping in. This alignment of trend, pattern and volume makes the breakout area key to watch. The upside potential is projected by the depth of the cup from the breakout point.
👀 Levels to watch:
Entry trigger: Break above $106.35
Target: $118.00
Stop: Under the breakout / base of the pattern
💬 Will CAKE break through resista
Zcash (ZEC) to $1500On the above weekly chart price action made a 90% correction with oversold condition (orange column) followed by a consolidation period. That consolidation period has now ended resulting in an excellent buying opportunity.
Why bullish?
1) The trend. Lower highs lower lows are no longer since the bottoming candle. A trend reversal was confirmed at the breakout of market structure.
2) Price action is above the 100-week EMA following the 21-week crossing the 50-week. very bullish.
3) Lastly the
Generac’s Bullish GapGenerac gapped higher two weeks ago, and some traders may see potential for more upside.
The first pattern on today’s chart is the jump on September 17 after Amazon.com entered a long-term supply agreement that included warrants in the generator company. GNRC has remained inside or above the gap since, which could indicate buyers outnumber sellers.
Second, the stock is pushing above its 50-day moving average. Is its intermediate-term downtrend ending?
Third, the 8-day exponential moving avera
AUD/USD Slips as RBA Hike Meets 5% U.S. YieldsAUD/USD traded lower on Tuesday even as the RBA unanimously raised the overnight cash rate by 25-bps to 4.60%, its fourth hike this year and the highest rate in roughly 15 years. The move was largely priced-in, leaving the Australian Dollar vulnerable to a sell-the-fact reaction. The RBA remains worried about persistent inflation, with core inflation around 3.6%, and kept the door open to additional tightening if price pressures fail to cool.
The bigger force today came from the U.S. side. The
QGEN: 50 SMA Cup-and-Handle with Buyers Stepping In💡 Swing setup idea
50 SMA Strategy
🔎 Analysis summary:
The stock touched the 50-day moving average and is reaching a critical area. We can also see a closing of a cup-and-handle pattern with buyers volume stepping in. This alignment of trend, pattern and volume makes the breakout area key to watch. The upside potential is projected by the depth of the cup-and-handle from the breakout point.
👀 Levels to watch:
Entry trigger: Break above $45.00
Target: $57.40
Stop: Under the support / base
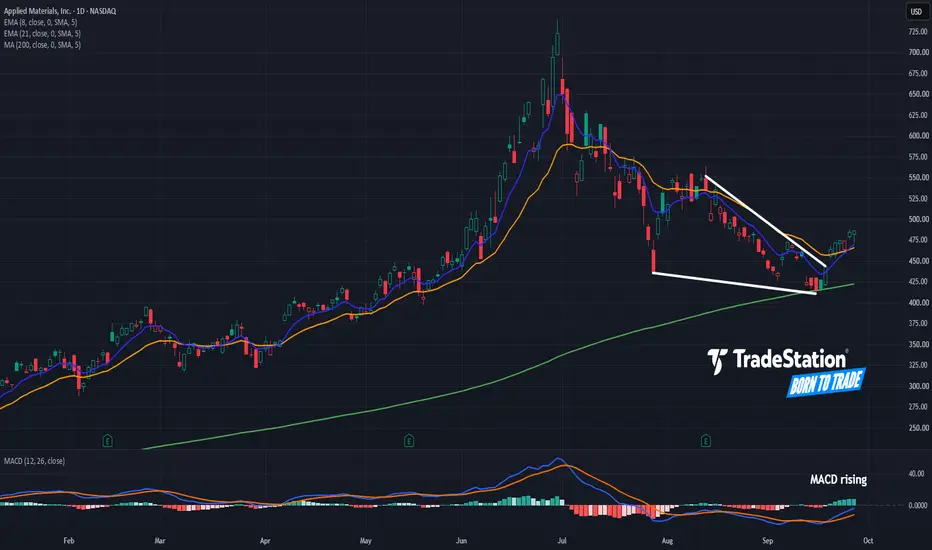
Applied Materials May Be ClimbingApplied Materials had a long pullback, but some traders could think it’s climbing again.
The first pattern on today’s chart is the 2-1/2 month slide between early July and mid-September. That decline, following the previous surge, may be viewed as an opportunity for trend followers.
Second, the semiconductor-equipment company bounced at its 200-day simple moving average (SMA). That may confirm its longer-term uptrend remains in effect.
Third, AMAT’s last low had a shallower angle than its low
BE Breakout Setup: $292.72 Is the Key LevelKey Highlights
BE closed at $288.70 on September 25, up 8.27%, with a strong bullish candle that finished near the top of its $264.01 to $292.72 session range.
The long-term trend remains bullish. Shares are up 244.8% over one year, while 14 of 15 moving average signals on TradingView read Buy and none read Sell.
Resistance sits at $292.72, $304.57, and the $325 to $351 zone that includes the 52-week high of $351.28.
Support is concentrated around $270 to $271, $256 to $260, $230 to $246
TXN: 50 SMA Cross with Cup Pattern and Rising Volume💡 Swing setup idea
50 SMA Strategy
🔎 Analysis summary:
The stock just crossed the 50-day moving average with growing buyers volume. We can also see a closing of a cup pattern. This alignment of trend, pattern and volume makes the breakout area key to watch. The upside potential is projected by the depth of the cup from the breakout point.
👀 Levels to watch:
Entry trigger: Break above $279.00
Target: $309.80
Stop: Under the support
💬 Will TXN break through resistance and continue higher
NKE Bearish Below $39 Ahead of October EarningsKey Highlights
Nike closed at $35.75 on Friday, September 25, down 0.67%, marking a fresh multi-year low. Trading volume reached 34.2 million shares, nearly 23% above its three-month average of 27.8 million.
Bank of America downgraded Nike to Underperform from Neutral on September 25 and cut its price target from $47 to $30. The firm also reduced its fiscal 2027 and fiscal 2028 EPS estimates by 11% and 12%, to $1.43 and $1.87 respectively.
In fiscal Q4 2026, North America revenue grew 3%,
EURNZD LONGEUR is one of the strongest currencies in the G10 right now. The ECB delivered a unanimous hawkish hike earlier this month, with growth and inflation forecasts both revised higher — a genuine conviction move, not a close call. Eurozone PMIs have been accelerating for months.
NZD, by contrast, has no fresh catalyst. The RBNZ delivered its last hike back in September to a mixed reaction, and there's nothing scheduled on the New Zealand calendar this week to shift that.
Price rallied hard through
BTC Gets Squeezed Into a Tight $82.5K–$85K Range!Hello traders!🌴
In the last post, I identified consolidation within the $84K–$86.5K range, with small false breakouts in both directions.
Unfortunately for 🦬, after the false breakout of the $84K level on Thursday, price failed to convincingly reclaim and hold above this level on Friday and throughout the weekend. As a result, price made the exact “acceleration toward the $82.5K horizontal level” I warned about.
Today, price printed two local lows at $82,550 and $82,510 🎯✅
What’s happening
ELF: 50 SMA Cross & Cup at Support 💡 Swing setup idea
50 SMA Strategy
🔎 Analysis summary:
The stock touched the 50-day moving average, crossed resistance and came back to retest support. We can also see a closing of a big cup pattern. This alignment of trend, pattern and level makes the breakout area key to watch. The upside potential is projected by the depth of the cup from the breakout point.
👀 Levels to watch:
Entry trigger: Break above $98.50
Target: $145.70
Stop: Under the support / base of the pattern
💬 Will ELF
PLTR: 50 SMA And Big Cup & Handle 💡 Swing setup idea
50 SMA Strategy
🔎 Analysis summary:
The stock is coming from the 50-day moving average and reaching support. We can also see a closing big cup-and-handle pattern. This alignment of trend, pattern and level makes the breakout area key to watch. The upside potential is projected by the depth of the cup from the breakout point.
👀 Levels to watch:
Entry trigger: Break above $188.60
Target: $269.50
Stop: Under the support
💬 Will PLTR break through resistance and continue
WTI Crude Oil -> QML Support Meets Geopolitical VolatilityHi!
WTI is currently trading around $92.45, with the 100-hour SMA near $92.12. After the sharp decline from the $106 area, price has started to consolidate around an important demand zone.
Technical Structure
Price is currently sitting inside the $91.2–92.3 QML/demand zone, where buyers have previously stepped in. The 100-hour SMA at ~$92.12 adds confluence to this area.
The chart also shows an engulfing concept around the $93.8 area, which is the first important level price needs to reclai