XAU/USD 17 September 2026 Intraday AnalysisH4 Analysis:
-> Swing: Bullish.
-> Internal: Bearish.
Bias and analysis to remain the same as analysis dated 30 June 2026.
Price did not print bullish CHoCH to indicate bullish pullback phase initiation. Price instead printed a new low followed by a bullish CHoCH
Price is currently trading within and established internal range, however, I will continue to monitor price with respect to depth of pullback.
Intraday expectation:
Price to trade up to either premium of internal 50% EQ, or H4 demand zone before targeting weak internal low, currently priced at 3,942.100.
Note:
Gold remains volatile as tensions between the US, Israel, and Iran keep safe‑haven demand elevated.
Markets are reacting quickly to every headline, while uncertainty around the Fed’s easing path and shifting U.S. policy under President Trump, especially tariffs continues to fuel choppy price action.
For newer traders, the key is simple, stay flexible and manage risk carefully, as fast spikes and sudden reversals are a normal part of the current XAU/USD environment.
H4 Chart:
M15 Analysis:
-> Swing: Bearish.
-> Internal: Bearish.
Price has printed according to analysis dated 14 September 2026 whereby I mentioned price to target weak internal low priced at 4,282.625. However, I am not entirely convinced at the nature of the iBOS as the break was minimal and was caused by last night's FED interest rate decision.
We are also seeing a drastic reduction in the depth of the internal range.
Price is currently trading within an internal low and fractal high. CHoCH positioning is the same as the fractal high.
Intraday expectation:
Price to trade up to either premium of internal 50% EQ, or M15 demand zone before targeting weak internal low, currently priced at 4,235.165.
Alternative Scenario:
Due to the narrowing of the internal range, price could potentially strong internal high and print a bullish iBOS.
Note:
Gold remains highly reactive on M15 as geopolitical risk continues to drive quick, headline‑led moves.
The tension between the US, Israel, and Iran is keeping safe‑haven demand elevated, with markets still sensitive to any sign of escalation.
At the same time, shifting US tariff policy under President Trump is adding extra uncertainty, fuelling sharp intraday swings and increasing the likelihood of sudden sentiment flips. Liquidity pockets and whipsaws remain common, making disciplined risk management essential.
Gold’s geopolitical premium is still firmly in place, and until tensions ease, short‑term volatility is likely to stay front‑loaded.
M15 Chart: USDCAD: What Happens When Price Revisits a Fresh Supply Zone?Market Structure: Supply Zone | Rally-Base-Drop
USDCAD is currently being observed near an identified Supply Zone on the 120-minute timeframe.
The area originated from a Rally-Base-Drop (RBD) structure, where a relatively strong move away from the base created a visible imbalance between buyers and sellers.
Why is this zone technically significant?
This is a fresh zone with several characteristics that make it relevant for technical observation:
• A clear Rally-Base-Drop structure
• A relatively strong leg-out from the base
• A compact and defined basing structure
• No significant prior revisit of the area
• Alignment with observations from multiple timeframes
A fresh supply zone is generally studied because the original imbalance has not been substantially tested. When price later returns toward such an area, traders often observe how price behaves around the zone rather than assuming a predetermined outcome.
What could happen on a revisit?
There are several possible scenarios.
Scenario 1 — Rejection
If price reaches the supply area and sellers become active, price action could show rejection through bearish candles, failed upward movement, or a shift in short-term structure.
Scenario 2 — Acceptance above the zone
If price moves through the supply area and begins sustaining above it, the original supply structure could become technically weaker. This may indicate that the imbalance is being absorbed rather than respected.
Scenario 3 — Consolidation
Price could also spend time around the zone without producing a clear directional reaction. In that situation, the market may simply be establishing new information before the next meaningful move.
Confirmation matters
The zone itself does not determine what price will do.
Price action confirmation, market structure, candle behavior, and higher-timeframe context can provide additional information when evaluating how the market is interacting with the area.
The zone can also be invalidated . A sustained move through the area would be an important observation because it could indicate that the original supply imbalance is no longer behaving as expected.
Risk Management — Educational Concept
From a general trading-education perspective, risk management involves defining in advance how much uncertainty or potential loss a trading plan is designed to tolerate. The appropriate parameters depend on an individual's circumstances, methodology, and risk tolerance.
For this chart, the key educational question is not simply whether the supply zone "works", but rather:
"How does price behave when it revisits a fresh Rally-Base-Drop supply zone?"
That reaction can provide useful information about the interaction between price, structure, and previously identified imbalance.
Educational Disclaimer:
This publication is intended solely for educational and informational purposes. It reflects a technical analysis of market structure and should not be interpreted as investment advice, a recommendation, or a solicitation to buy or sell any financial instrument. Always perform your own analysis and manage risk according to your individual circumstances. Crude Oil | Is Wave 3 Expanding?⏱️ Reading time: about 2 minutes
In the previous Crude Oil analysis, the main question was:
What kind of structure is the market building?
On this 2-hour chart, the move up from the major low still shows characteristics of an impulsive structure.
In the bullish scenario, this move could be part of a higher-degree Wave 3, and its internal structure is now giving us more clues.
Price is developing a five-wave structure. If this structure continues to unfold as expected and the internal Wave 4 completes, the next move could be Wave 5 of this structure.
103.558 is the first key level I’m watching for confirmation that this scenario is still developing.
If the bullish structure remains intact, 108.618, 111.148, and 114.431 can be used as the next reference areas.
And if the higher-degree Wave 3 is truly expanding, then 118.055, 120.244, and 123.868 come into focus as additional reference levels.
These are not fixed price predictions.
They simply help us track how the structure is developing.
On the other hand, if the current move fails to maintain its impulsive structure and instead develops into a larger correction, another scenario becomes relevant again.
94.199 is the first level I’m watching for invalidation in that scenario, while 66.980 remains the invalidation level for the larger bullish structure.
So the main question is still not:
“Is Crude Oil going up or down?”
The real question is:
“What will the next structure tell us?”
We don’t always need to predict the future.
Sometimes, it’s enough to let the structure reveal itself, one step at a time.
Patterns whisper, and I listen.
— Mr. Nobody 🎧📊
Brent Crude Oil
7 hours ago
Brent Crude Oil | Is Wave III Expanding?
 Long
Long
Brent Crude Oil | Is Wave III Expanding?⏱️ Reading time: About 2 minutes
In our previous oil analyses, the focus has always been on one simple question:
What structure is the market building?
On the 2H Brent chart, the move developing from the major low continues to show an impulsive character. Price has now reached an area where the structure may provide much more information about the higher-degree wave.
In the bullish scenario, the current advance could be part of a higher-degree Wave III. If so, the internal structures should continue developing progressively and impulsively, while a break above 105.80 could provide an important confirmation for this path.
If this behavior continues, 126.27, 139.46, 147.77, 160.76, and 182.16 are the key areas I will be watching as the higher-degree structure develops.
These are not guaranteed price forecasts. They are structural reference levels that can help us evaluate how the pattern evolves.
But there is still another path on the chart.
If the current advance fails to maintain its impulsive character and instead completes as a five-wave move followed by a larger sideways correction, the bearish / larger corrective structure becomes relevant again.
In that case, the market could develop a deeper correction while 58.52 remains the invalidation level for the larger bullish structure.
So the main question here is not:
“Will oil go up or down?”
It is:
“What structure is the market building next?”
Price does not always give us the answer immediately.
But structure reveals it step by step.
We just have to listen.
Patterns whisper. I listen.
— Mr. Nobody 🎧📊
WTI Oil Spot
Sep 2
Crude Oil | Three Nested Structures or a Larger Correction?
Brent Crude Oil
Aug 10
Crude Oil: Is a Larger Wave III Beginning?
CFDs on Crude Oil (Brent)
Aug 6
Is Wave 3 Beginning, or Is One More Correction Still Ahead?
Long 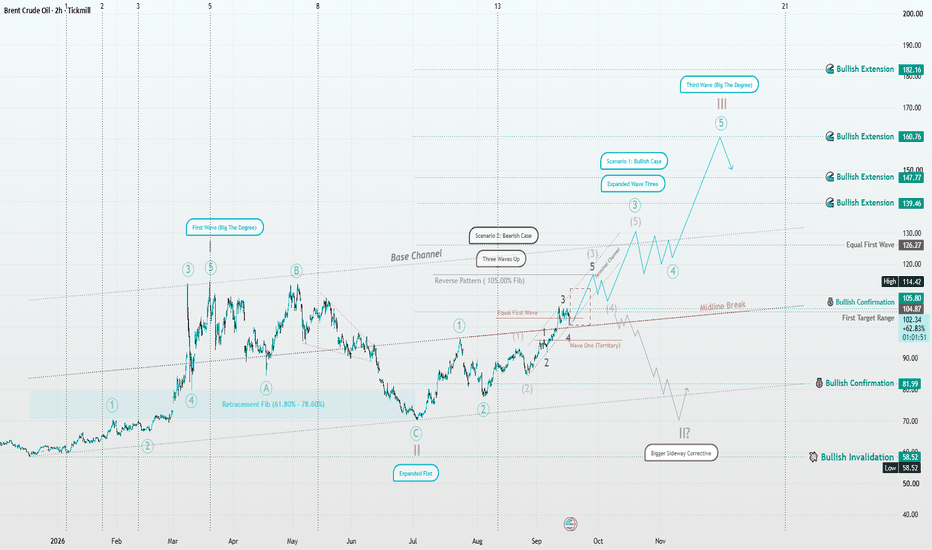
Silver | When Structure Speaks, We Listen⏱️ Reading time: about 3 minutes
In our previous Silver analyses, we focused on identifying the first motive wave to the upside from the recent low — a structure that could develop into a five-wave impulse. After the latest movement, the main question is no longer simply “up or down?” but rather what degree does the current correction belong to, and is it still developing or already complete?
🟦 Scenario 1 | Bullish Case
In this view, the initial bullish structure remains important. The recent decline may be part of a corrective structure, while the current movement could be building the next stage of that correction.
If the current correction develops as a sideways structure and price then breaks out with a clear motive pattern, the possibility of further upside becomes more relevant.
But for us, a simple move through a price level is not enough — the structure must prove itself.
If the next advance is truly a motive wave, we should also be able to recognize a clear and consistent structure at the smaller degree.
In that case, a break of the recent high followed by a correction proportional to the wave’s degree and character could provide more information about the next phase.
⬛ Scenario 2 | Bearish Case
In the conservative view, the recent decline may represent the first part of a larger corrective structure — potentially something similar to W within a zigzag or double zigzag.
The current advance could therefore be a connecting or corrective wave, such as X, or part of a larger B wave.
If this advance fails to develop into a valid motive structure and price then declines with strength again, a deeper corrective structure becomes possible. Another zigzag could develop, eventually completing Y.
In that case, the larger decline would still be part of the same higher-degree corrective wave.
🔎 The Key Point
At this stage, both structures remain under observation, and the type of structure itself may still change. That is why every new price action requires a fresh review.
We are not deciding the future path in advance.
We wait for the market to show us whether the current movement can develop into a motive wave, or whether it will ultimately prove to be part of a more complex corrective structure.
Patterns whisper; I listen.
— Mr. Nobody 🎧📊
Silver / U.S. Dollar
Sep 6
Silver 4H | The Structure Is Speaking — Elliott Wave Update
Sep 2
Silver | Let the Waves Speak
XAU/USD 16 September 2026 Intraday AnalysisH4 Analysis:
-> Swing: Bullish.
-> Internal: Bearish.
Bias and analysis to remain the same as analysis dated 30 June 2026.
Price did not print bullish CHoCH to indicate bullish pullback phase initiation. Price instead printed a new low followed by a bullish CHoCH
Price is currently trading within and established internal range, however, I will continue to monitor price with respect to depth of pullback.
Intraday expectation:
Price to trade up to either premium of internal 50% EQ, or H4 demand zone before targeting weak internal low, currently priced at 3,942.100.
Note:
Gold remains volatile as tensions between the US, Israel, and Iran keep safe‑haven demand elevated.
Markets are reacting quickly to every headline, while uncertainty around the Fed’s easing path and shifting U.S. policy under President Trump, especially tariffs continues to fuel choppy price action.
For newer traders, the key is simple, stay flexible and manage risk carefully, as fast spikes and sudden reversals are a normal part of the current XAU/USD environment.
H4 Chart:
M15 Analysis:
-> Swing: Bearish.
-> Internal: Bullish.
Price has printed according to analysis dated 02 September 2026 whereby I mentioned price to trade up to either premium of internal 50% EQ, or M15 demand zone before targeting weak internal low, currently priced at 4,282.625. Please note, in error I mentioned weak internal high instead of weak internal low.
This is exactly how price printed. Price has subsequently printed a bullish CHoCH to indicate bullish pullback phase initiation.
Price is currently trading within an established internal range. I shall continue to monitor price with respect to depth of pullback.
Intraday expectation:
Price to trade up to either premium of internal 50% EQ, or M15 demand zone before targeting weak internal low, currently priced at 4,253.625.
Note:
Gold remains highly reactive on M15 as geopolitical risk continues to drive quick, headline‑led moves.
The tension between the US, Israel, and Iran is keeping safe‑haven demand elevated, with markets still sensitive to any sign of escalation.
At the same time, shifting US tariff policy under President Trump is adding extra uncertainty, fuelling sharp intraday swings and increasing the likelihood of sudden sentiment flips. Liquidity pockets and whipsaws remain common, making disciplined risk management essential.
Gold’s geopolitical premium is still firmly in place, and until tensions ease, short‑term volatility is likely to stay front‑loaded.
M15 Chart:  Long
Long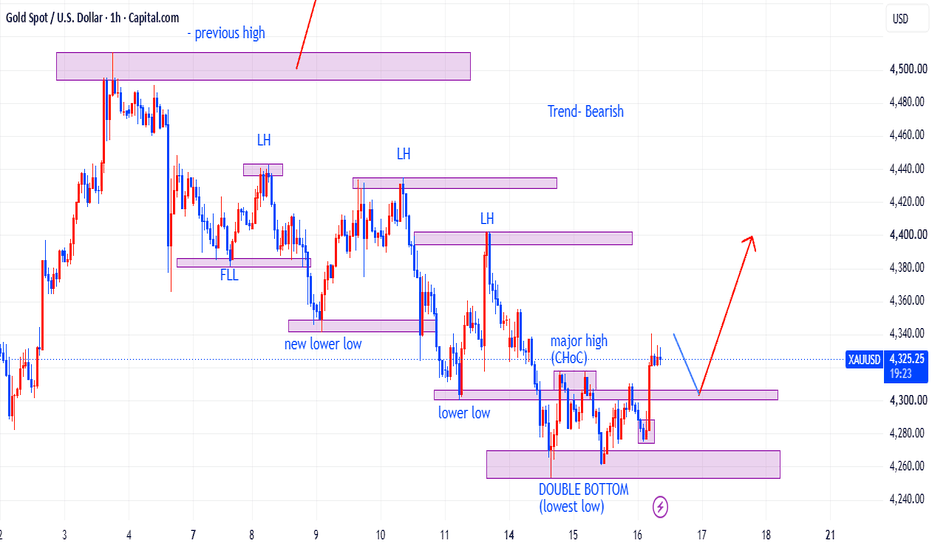
XAUUSD — 4H Bearish Structure | Bullish Pullback Into 4H PoiFOREXCOM:XAUUSD is currently presenting an interesting multi-timeframe setup where the 4H structure remains bearish, while the 15M has shifted bullish.
At first glance, seeing bullish price action on the 15M could make the market appear bullish. However, in this setup, I am treating the 15M bullish movement as the pullback phase within the broader 4H bearish structure. The 4H has already established bearish structure, and the current objective remains to the downside.
What I am now watching is whether the bullish 15M movement can continue higher into the marked 4H POI.
The market is already showing signs of a Bullish Retracement on the lower timeframe. The 15M has established bullish structure, which gives me a reason to expect the pullback to continue rather than assuming price must immediately resume the 4H downside. This bullish movement is important because I want price to retrace into the 4H POI before looking for the next bearish continuation.
The POI represents the area where I expect price to potentially interact with the higher-timeframe bearish structure. So I am not looking to sell simply because the 4H is bearish.
I want price to first complete the pullback into the appropriate 4H area of interest.
Another important component of this setup is LIQUIDITY.
As price approaches the 4H POI, I am expecting the market to potentially take liquidity around the highs before reversing. This is why the path drawn on the chart shows a bullish movement into the upper area rather than an immediate drop.
The idea is:
Bullish pullback → reach 4H POI → take liquidity → bearish reaction → continuation lower.
The liquidity sweep itself would not be enough for execution. I would still want to see the appropriate bearish confirmation after price reaches the POI.
That distinction is important.
🎯 Downside Objective
If price reaches the 4H POI, takes the relevant liquidity, and then produces bearish confirmation, the expectation is for the 4H bearish structure to continue. The marked 4H Sell-Side Liquidity below becomes an important downside objective.
Therefore, the setup is not simply:
“Gold is going up.”
The bullish movement is being viewed as a pullback with a purpose. The broader narrative remains bearish until the 4H structure proves otherwise.
🧠 DAIFX TIMEFRAME HIERARCHY
This setup is another good example of why different timeframes can tell different stories at the same time.
4H
Bearish structure.
This establishes the broader directional context and downside objective.
15M
Bullish structure
This represents the current pullback and gives us information about the path price may take toward the 4H POI.
4H POI
Area of interest
This is where I want price to reach before looking for the next bearish move.
Liquidity
Potential confirmation area
Price may take liquidity around the highs before the bearish continuation.
Execution
Wait for bearish confirmation
I don't sell simply because price reaches the POI. I want the market to demonstrate that sellers are actually taking control.
🎓 DAIFX MARKET LESSON
A bullish lower timeframe does not automatically mean the higher timeframe has turned bullish. The 15M can be bullish while the 4H remains bearish.
In this case, the 15M bullish structure is helping price complete a 4H pullback.
This is why timeframe hierarchy matters.
4H gives the broader structure.
15M shows the current movement.
The POI gives the location.
Liquidity provides context.
Confirmation gives the entry.
So instead of asking: “Is Gold bullish or bearish?”
I ask: “Which timeframe is bullish, which timeframe is bearish, and what is each timeframe trying to accomplish?”
Right now, the answer is: The 15M is bullish because price is pulling back. The 4H remains bearish because the broader structure is still pointing lower.
Don't confuse the pullback with the reversal. Long 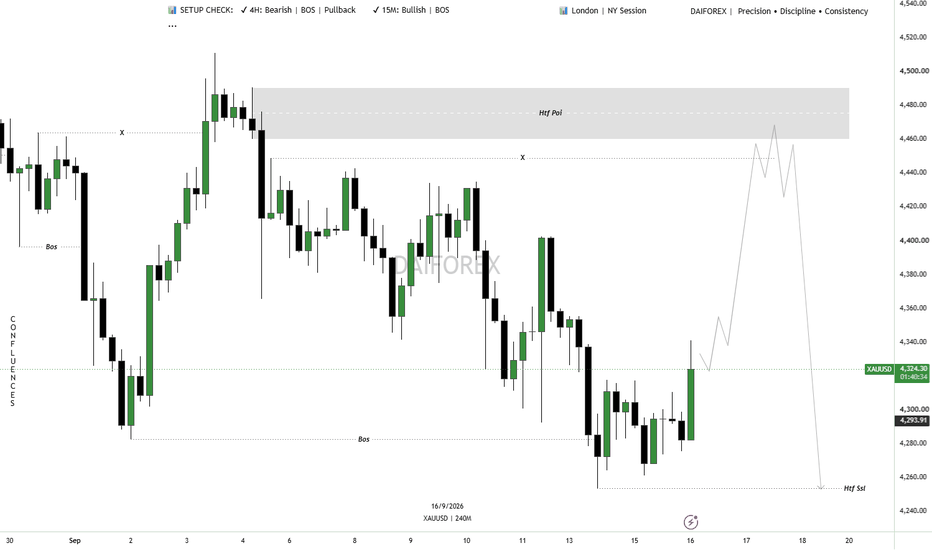
BTCUSDT: Daily seller pressure and local H1 scenariosOn the daily BTCUSDT chart, sellers still hold the initiative. A seller initiative has formed, and the key IC is also a seller candle.
Price has approached the daily support at 75,545, while the Target of the current initiative is 61,306.84. For this reason, buying on the daily timeframe remains risky for now: the broader context still favors sellers.
The hourly chart looks more interesting. Two local scenarios can be considered here.
Buyer scenario: to look for long opportunities, it is important to see price reclaim 77,343, then break and hold above 78,250. The next important area is 79,485, while the local target is around 80,000. The green area on the chart marks the zone where buyer confirmation can be monitored.
Seller scenario: if price fails to recover and sellers gain acceptance below the 76,306–75,545 area, this could create an opportunity to look for further downside continuation. The next important level below is the monthly level at 74,092.
So, on H1 there are possible scenarios in both directions, but the higher-timeframe context remains important: on D1, the preference is still with sellers for now. Both scenarios and the areas where confirmation can be monitored are marked on the chart.
Profitable trades!
This analysis is based on the Initiative Analysis (IA) method.  Long
Long
DXY 2H | The Next Structure Will Define the Larger Path⏱️ Estimated Reading Time: About 2 Minutes
Following our daily DXY analysis, we are now moving down to the 2-hour chart to examine what the current movement may be building at the lower degree.
In the bullish scenario, if the recent correction has already completed, the market should now be developing a new Wave 1. Therefore, simply seeing price move higher is not enough. Price needs to break decisively out of the marked black boxes and then develop a valid motive structure.
If that happens, the bullish higher-degree scenario gains more weight, while structures such as a Leading Diagonal or Nested 1–2 remain possible.
However, the bearish scenario is still alive.
If price moves slightly beyond the previous peak at the lower degree, but fails to develop a strong and valid bullish structure and then turns lower again, the market could instead be building another corrective structure, such as another Zigzag.
In that case, the correction could become deeper and more time-consuming, giving the higher-degree bearish scenario greater importance again.
So at this stage, price action and the quality of the structure matter more than the direction of the move itself.
If the breakout is accompanied by a valid motive structure, the bullish scenario will strengthen.
If the move beyond the previous peak proves temporary and a valid bearish structure develops afterward, the probability of further correction will increase.
For now, we let the market make the decision.
The higher timeframe gives us the map;
the 2-hour chart must show us which path the market is actually building.
Structure First. Scenario Second.
Patterns whisper. I listen.
— Mr. Nobody 🎧📊
Dollar Index Future
7 hours ago
DXY | When Structure Reveals the Dollar’s Next Path
 Long
Long
Long 
DXY | When Structure Reveals the Dollar’s Next Path⏱️ Estimated Reading Time: About 2 Minutes
In this update, our focus is on the current DXY structure on the daily chart, where the market is still revealing the pattern following the recent decline.
From the higher-degree perspective, we continue to monitor two scenarios.
🟢 Bullish Scenario
If the current structure completes as a corrective pattern and the market then develops a valid motive structure, the probability of further DXY strength will increase.
A break of the marked levels could provide additional confirmation for the bullish scenario and potentially open the path toward higher levels.
⚫ Bearish Scenario
On the other hand, if the current movement fails to maintain a corrective character and the market develops another valid bearish structure, the probability of a deeper correction will increase.
In that case, DXY could continue developing a more complex corrective structure, such as a Double Zigzag or another higher-degree combination.
🔎 What Matters Right Now?
We do not want to label the structure before the market reveals it.
For now, the key is price action around the marked levels and the internal structure of the next move.
If the next upside move develops as a motive structure, the bullish scenario gains strength. If price turns lower again and builds a valid bearish structure, the deeper corrective scenario remains on the table.
So for now, we have one main question:
What pattern is DXY actually building?
The market will provide the answer through structure.
Structure First. Scenario Second.
Patterns whisper. I listen.
— Mr. Nobody 🎧📊
Chart Note: The chart is set to “Lock Price to Bar.” For a closer look at the current structure, simply zoom in on the most recent price action and the marked levels.
Dollar Index
Jun 7
DXY Structural Analysis: Navigating the Diagonal
U.S. Dollar Currency Index
Jun 5
The DXY Time Paradox: Monday Engineering & Elliott Wave Dissecti
XAUUSD: Bearish Retest — Will Resistance Reject Price Again?# XAUUSD: Bearish Retest — Will Resistance Reject Price Again?
**Gold Spot / U.S. Dollar (15-minute chart)**
Gold is currently showing signs of a bearish market structure. After making lower highs and lower lows, price has started to recover from the recent drop. However, this recovery may simply be a **pullback before another move lower**.
### 🔍 What the chart is telling us
Think of the grey zone around **4,284–4,290** as a ceiling. Price previously reacted around this area, and it is now approaching the same zone again.
The key question is: **Will buyers break through the ceiling, or will sellers defend it?**
The broader structure still favors sellers because:
* Price has been making lower highs and lower lows.
* The previous rally failed to sustain bullish momentum.
* The current upward move may be a retracement into a former support-turned-resistance area.
* The marked resistance zone provides a logical area to watch for selling pressure.
### 📉 The bearish scenario
If price reaches the 4,284–4,290 zone and shows clear rejection, sellers may attempt to push Gold lower.
My projected path is:
1. Price rallies into the resistance zone.
2. Buyers struggle to break above it.
3. A bearish rejection or a break of short-term support confirms selling pressure.
4. Price potentially moves toward **4,270**, followed by the **4,260–4,255** area.
These are potential targets, not guaranteed outcomes.
### ⚠️ What would invalidate the idea?
If Gold breaks above the resistance area with strong bullish candles and holds above it, the bearish setup becomes weaker. A sustained move above the broader supply area around 4,305–4,317 would further challenge the short-term bearish outlook.
### 🎯 My trading plan
I am not interested in selling simply because price has reached the zone. I want to see sellers prove themselves.
**Bearish confirmation:** Rejection from resistance, followed by a break of nearby short-term support.
**Entry:** After confirmation, preferably on a retest rather than chasing a large bearish candle.
**Targets:** 4,270 → 4,260 → 4,255.
**Invalidation:** A strong bullish breakout and sustained acceptance above the resistance area.
### 🧠 Simple takeaway
Gold is climbing toward a ceiling after falling. The ceiling may push price back down, but we must wait and see whether sellers actually defend it.
**Patience first. Confirmation second. Execution last.**
*This is a technical analysis scenario, not a guaranteed prediction or financial advice.*
Short 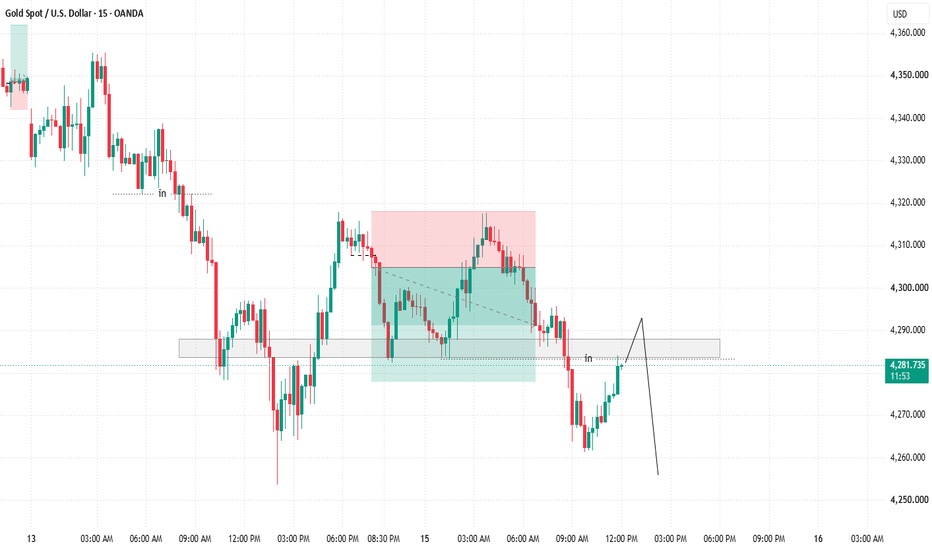
XAU/USD 15 September 2026 Intraday AnalysisH4 Analysis:
-> Swing: Bullish.
-> Internal: Bearish.
Bias and analysis to remain the same as analysis dated 30 June 2026.
Price did not print bullish CHoCH to indicate bullish pullback phase initiation. Price instead printed a new low followed by a bullish CHoCH
Price is currently trading within and established internal range, however, I will continue to monitor price with respect to depth of pullback.
Intraday expectation:
Price to trade up to either premium of internal 50% EQ, or H4 demand zone before targeting weak internal low, currently priced at 3,942.100.
Note:
Gold remains volatile as tensions between the US, Israel, and Iran keep safe‑haven demand elevated.
Markets are reacting quickly to every headline, while uncertainty around the Fed’s easing path and shifting U.S. policy under President Trump, especially tariffs continues to fuel choppy price action.
For newer traders, the key is simple, stay flexible and manage risk carefully, as fast spikes and sudden reversals are a normal part of the current XAU/USD environment.
H4 Chart:
M15 Analysis:
-> Swing: Bearish.
-> Internal: Bullish.
Bias and analysis to remain the same as analysis dated 02 September 2026.
Price has printed according to analysis dated 02 September 2026 whereby I mentioned price to trade up to either premium of internal 50% EQ, or M15 demand zone before targeting weak internal low, currently priced at 4,282.625. Please note, in error I mentioned weak internal high instead of weak internal low.
This is exactly how price printed. Price has subsequently printed a bullish CHoCH to indicate bullish pullback phase initiation.
Price is currently trading within an established internal range. I shall continue to monitor price with respect to depth of pullback.
Intraday expectation:
Price to trade up to either premium of internal 50% EQ, or M15 demand zone before targeting weak internal low, currently priced at 4,253.625.
Note:
Gold remains highly reactive on M15 as geopolitical risk continues to drive quick, headline‑led moves.
The tension between the US, Israel, and Iran is keeping safe‑haven demand elevated, with markets still sensitive to any sign of escalation.
At the same time, shifting US tariff policy under President Trump is adding extra uncertainty, fuelling sharp intraday swings and increasing the likelihood of sudden sentiment flips. Liquidity pockets and whipsaws remain common, making disciplined risk management essential.
Gold’s geopolitical premium is still firmly in place, and until tensions ease, short‑term volatility is likely to stay front‑loaded.
M15 Chart:

Short 
Will I Buy or Sell Gold this Week? Hey Rich Friends,
Happy Monday, I hope all is well. This is my technical analysis for Gold so please make sure to check the news and cross-reference your own charts. Here is what I am looking at:
- The first thing I noticed is that the market has been pretty bearish for the last fews days. I have to wonder if this trend will continue or are the sellers exhausted?
- The market has crossed and closed below the previous day's low around 4292. This is a bearish confirmation for me.
- The red candle bodies still look strong with little to no wicks at the bottom showing there is little resistance from the buyers. This is a bearish confirmation for me.
- The stochastic is still facing down, the slow line (orange) is above the fast line (blue), and one or both lines have crossed below 20. This is a bearish confirmation for me.
- There is a gap to be filled between 4216 and 4135 (or lower) before the market turns bullish.
Additional Information:
- The stochastic is already oversold, but this does not mean an automatic turnaround. This would give me pause to jump in for a sell right away. Check lower timeframes for confluence.
- I will be using past areas of support as SL and previous lows as TPs: 4216, 4200, 4135 and lower
- If the market does buy, it will revisit these prices: 4300, 4333, 4365 and higher
I am leaning toward swinging a sell but great luck if you decide to take this trade.
Peace and Profits,
Cha
Short 
INJ PULLBACK COULD TRIGGER THE NEXT BIG MOVEYello Paradisers, is INJ preparing to shake out impatient traders before launching the next bullish expansion toward the liquidity and resistance levels above?
💎INJ is showing an increasingly interesting short-term structure after breaking out of the falling wedge that controlled price action for several days. The strong reaction from the lows around $5.74, together with the recent increase in volume, suggests that bearish momentum has weakened and buyers are beginning to regain control.
💎The broader picture, however, is still mixed. The weekly and daily structures remain bullish, while the 4H structure is still bearish and the 1H is only starting to shift bullish. This means the upside potential is there, but we still need confirmation that buyers can maintain control from the current area.
💎The most important recent development is the 1H Change of Character around the $6.10-$6.15 area. Price has pushed back above this structure, which is the first meaningful sign that the previous bearish sequence is losing strength.
💎Instead of chasing price around $6.16-$6.17, the cleaner scenario would be a controlled retracement into the highlighted 1H bullish order block around $5.90-$5.96. This zone also overlaps with the nearby imbalance, making it an important area where buyers could step back into the market.
💎If this zone is defended, INJ could first attack the liquidity resting above the recent highs around $6.25-$6.30. A successful breakout there would expose the next major resistance around $6.50-$6.52 on the 4H timeframe.
💎Above that, the next important liquidity sits around the previous equal highs near $6.70, with the major daily resistance positioned around $6.90.
💎This bullish scenario remains valid as long as buyers continue protecting the structure below. A confirmed 1H candle close below approximately $5.82 would invalidate the setup and indicate that INJ may need a deeper correction before any stronger continuation can develop.
💎For now, patience is the key. The opportunity is becoming attractive, but the best trades rarely come from chasing price after the first reaction. We want to see price return into the right area, confirm that buyers are still present, and only then evaluate the next move.
Strive for consistency, not quick profits. Treat the market as a businessman, not as a gambler. Discipline, patience, and proper risk management are the only ways to stay consistent in this market.
MyCryptoParadise
iFeel the success🌴  Long
Long


