XAUUSD — 4H Bearish Structure | Bullish Pullback Into 4H PoiFOREXCOM:XAUUSD is currently presenting an interesting multi-timeframe setup where the 4H structure remains bearish, while the 15M has shifted bullish.
At first glance, seeing bullish price action on the 15M could make the market appear bullish. However, in this setup, I am treating the 15M bullish movement as the pullback phase within the broader 4H bearish structure. The 4H has already established bearish structure, and the current objective remains to the downside.
What I am now watching is whether the bullish 15M movement can continue higher into the marked 4H POI.
The market is already showing signs of a Bullish Retracement on the lower timeframe. The 15M has established bullish structure, which gives me a reason to expect the pullback to continue rather than assuming price must immediately resume the 4H downside. This bullish movement is important because I want price to retrace into the 4H POI before looking for the next bearish continuation.
The POI represents the area where I expect price to potentially interact with the higher-timeframe bearish structure. So I am not looking to sell simply because the 4H is bearish.
I want price to first complete the pullback into the appropriate 4H area of interest.
Another important component of this setup is LIQUIDITY.
As price approaches the 4H POI, I am expecting the market to potentially take liquidity around the highs before reversing. This is why the path drawn on the chart shows a bullish movement into the upper area rather than an immediate drop.
The idea is:
Bullish pullback → reach 4H POI → take liquidity → bearish reaction → continuation lower.
The liquidity sweep itself would not be enough for execution. I would still want to see the appropriate bearish confirmation after price reaches the POI.
That distinction is important.
🎯 Downside Objective
If price reaches the 4H POI, takes the relevant liquidity, and then produces bearish confirmation, the expectation is for the 4H bearish structure to continue. The marked 4H Sell-Side Liquidity below becomes an important downside objective.
Therefore, the setup is not simply:
“Gold is going up.”
The bullish movement is being viewed as a pullback with a purpose. The broader narrative remains bearish until the 4H structure proves otherwise.
🧠 DAIFX TIMEFRAME HIERARCHY
This setup is another good example of why different timeframes can tell different stories at the same time.
4H
Bearish structure.
This establishes the broader directional context and downside objective.
15M
Bullish structure
This represents the current pullback and gives us information about the path price may take toward the 4H POI.
4H POI
Area of interest
This is where I want price to reach before looking for the next bearish move.
Liquidity
Potential confirmation area
Price may take liquidity around the highs before the bearish continuation.
Execution
Wait for bearish confirmation
I don't sell simply because price reaches the POI. I want the market to demonstrate that sellers are actually taking control.
🎓 DAIFX MARKET LESSON
A bullish lower timeframe does not automatically mean the higher timeframe has turned bullish. The 15M can be bullish while the 4H remains bearish.
In this case, the 15M bullish structure is helping price complete a 4H pullback.
This is why timeframe hierarchy matters.
4H gives the broader structure.
15M shows the current movement.
The POI gives the location.
Liquidity provides context.
Confirmation gives the entry.
So instead of asking: “Is Gold bullish or bearish?”
I ask: “Which timeframe is bullish, which timeframe is bearish, and what is each timeframe trying to accomplish?”
Right now, the answer is: The 15M is bullish because price is pulling back. The 4H remains bearish because the broader structure is still pointing lower.
Don't confuse the pullback with the reversal.  Long
Long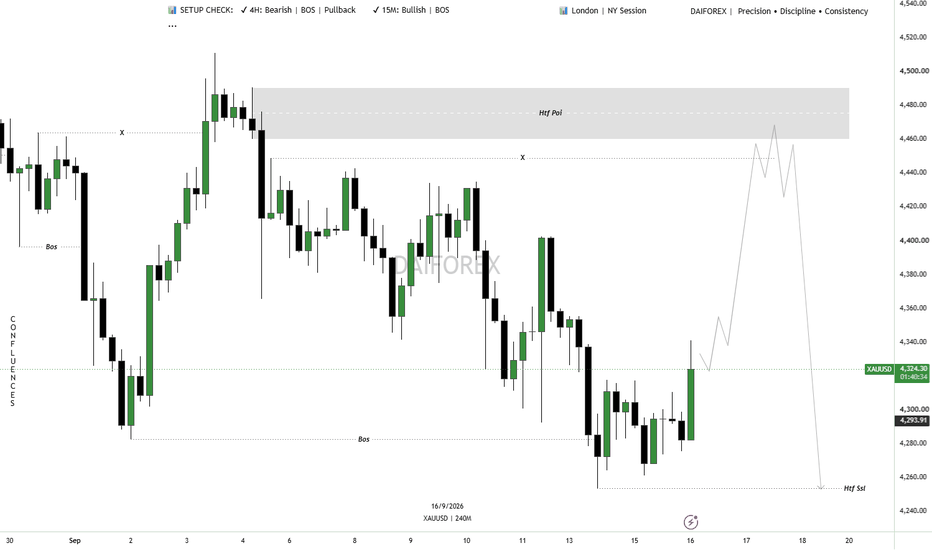
BTCUSDT: Daily seller pressure and local H1 scenariosOn the daily BTCUSDT chart, sellers still hold the initiative. A seller initiative has formed, and the key IC is also a seller candle.
Price has approached the daily support at 75,545, while the Target of the current initiative is 61,306.84. For this reason, buying on the daily timeframe remains risky for now: the broader context still favors sellers.
The hourly chart looks more interesting. Two local scenarios can be considered here.
Buyer scenario: to look for long opportunities, it is important to see price reclaim 77,343, then break and hold above 78,250. The next important area is 79,485, while the local target is around 80,000. The green area on the chart marks the zone where buyer confirmation can be monitored.
Seller scenario: if price fails to recover and sellers gain acceptance below the 76,306–75,545 area, this could create an opportunity to look for further downside continuation. The next important level below is the monthly level at 74,092.
So, on H1 there are possible scenarios in both directions, but the higher-timeframe context remains important: on D1, the preference is still with sellers for now. Both scenarios and the areas where confirmation can be monitored are marked on the chart.
Profitable trades!
This analysis is based on the Initiative Analysis (IA) method.  Long
Long
DXY 2H | The Next Structure Will Define the Larger Path⏱️ Estimated Reading Time: About 2 Minutes
Following our daily DXY analysis, we are now moving down to the 2-hour chart to examine what the current movement may be building at the lower degree.
In the bullish scenario, if the recent correction has already completed, the market should now be developing a new Wave 1. Therefore, simply seeing price move higher is not enough. Price needs to break decisively out of the marked black boxes and then develop a valid motive structure.
If that happens, the bullish higher-degree scenario gains more weight, while structures such as a Leading Diagonal or Nested 1–2 remain possible.
However, the bearish scenario is still alive.
If price moves slightly beyond the previous peak at the lower degree, but fails to develop a strong and valid bullish structure and then turns lower again, the market could instead be building another corrective structure, such as another Zigzag.
In that case, the correction could become deeper and more time-consuming, giving the higher-degree bearish scenario greater importance again.
So at this stage, price action and the quality of the structure matter more than the direction of the move itself.
If the breakout is accompanied by a valid motive structure, the bullish scenario will strengthen.
If the move beyond the previous peak proves temporary and a valid bearish structure develops afterward, the probability of further correction will increase.
For now, we let the market make the decision.
The higher timeframe gives us the map;
the 2-hour chart must show us which path the market is actually building.
Structure First. Scenario Second.
Patterns whisper. I listen.
— Mr. Nobody 🎧📊
Dollar Index Future
7 hours ago
DXY | When Structure Reveals the Dollar’s Next Path
 Long
Long
Long 
DXY | When Structure Reveals the Dollar’s Next Path⏱️ Estimated Reading Time: About 2 Minutes
In this update, our focus is on the current DXY structure on the daily chart, where the market is still revealing the pattern following the recent decline.
From the higher-degree perspective, we continue to monitor two scenarios.
🟢 Bullish Scenario
If the current structure completes as a corrective pattern and the market then develops a valid motive structure, the probability of further DXY strength will increase.
A break of the marked levels could provide additional confirmation for the bullish scenario and potentially open the path toward higher levels.
⚫ Bearish Scenario
On the other hand, if the current movement fails to maintain a corrective character and the market develops another valid bearish structure, the probability of a deeper correction will increase.
In that case, DXY could continue developing a more complex corrective structure, such as a Double Zigzag or another higher-degree combination.
🔎 What Matters Right Now?
We do not want to label the structure before the market reveals it.
For now, the key is price action around the marked levels and the internal structure of the next move.
If the next upside move develops as a motive structure, the bullish scenario gains strength. If price turns lower again and builds a valid bearish structure, the deeper corrective scenario remains on the table.
So for now, we have one main question:
What pattern is DXY actually building?
The market will provide the answer through structure.
Structure First. Scenario Second.
Patterns whisper. I listen.
— Mr. Nobody 🎧📊
Chart Note: The chart is set to “Lock Price to Bar.” For a closer look at the current structure, simply zoom in on the most recent price action and the marked levels.
Dollar Index
Jun 7
DXY Structural Analysis: Navigating the Diagonal
U.S. Dollar Currency Index
Jun 5
The DXY Time Paradox: Monday Engineering & Elliott Wave Dissecti
XAUUSD: Bearish Retest — Will Resistance Reject Price Again?# XAUUSD: Bearish Retest — Will Resistance Reject Price Again?
**Gold Spot / U.S. Dollar (15-minute chart)**
Gold is currently showing signs of a bearish market structure. After making lower highs and lower lows, price has started to recover from the recent drop. However, this recovery may simply be a **pullback before another move lower**.
### 🔍 What the chart is telling us
Think of the grey zone around **4,284–4,290** as a ceiling. Price previously reacted around this area, and it is now approaching the same zone again.
The key question is: **Will buyers break through the ceiling, or will sellers defend it?**
The broader structure still favors sellers because:
* Price has been making lower highs and lower lows.
* The previous rally failed to sustain bullish momentum.
* The current upward move may be a retracement into a former support-turned-resistance area.
* The marked resistance zone provides a logical area to watch for selling pressure.
### 📉 The bearish scenario
If price reaches the 4,284–4,290 zone and shows clear rejection, sellers may attempt to push Gold lower.
My projected path is:
1. Price rallies into the resistance zone.
2. Buyers struggle to break above it.
3. A bearish rejection or a break of short-term support confirms selling pressure.
4. Price potentially moves toward **4,270**, followed by the **4,260–4,255** area.
These are potential targets, not guaranteed outcomes.
### ⚠️ What would invalidate the idea?
If Gold breaks above the resistance area with strong bullish candles and holds above it, the bearish setup becomes weaker. A sustained move above the broader supply area around 4,305–4,317 would further challenge the short-term bearish outlook.
### 🎯 My trading plan
I am not interested in selling simply because price has reached the zone. I want to see sellers prove themselves.
**Bearish confirmation:** Rejection from resistance, followed by a break of nearby short-term support.
**Entry:** After confirmation, preferably on a retest rather than chasing a large bearish candle.
**Targets:** 4,270 → 4,260 → 4,255.
**Invalidation:** A strong bullish breakout and sustained acceptance above the resistance area.
### 🧠 Simple takeaway
Gold is climbing toward a ceiling after falling. The ceiling may push price back down, but we must wait and see whether sellers actually defend it.
**Patience first. Confirmation second. Execution last.**
*This is a technical analysis scenario, not a guaranteed prediction or financial advice.*
Short 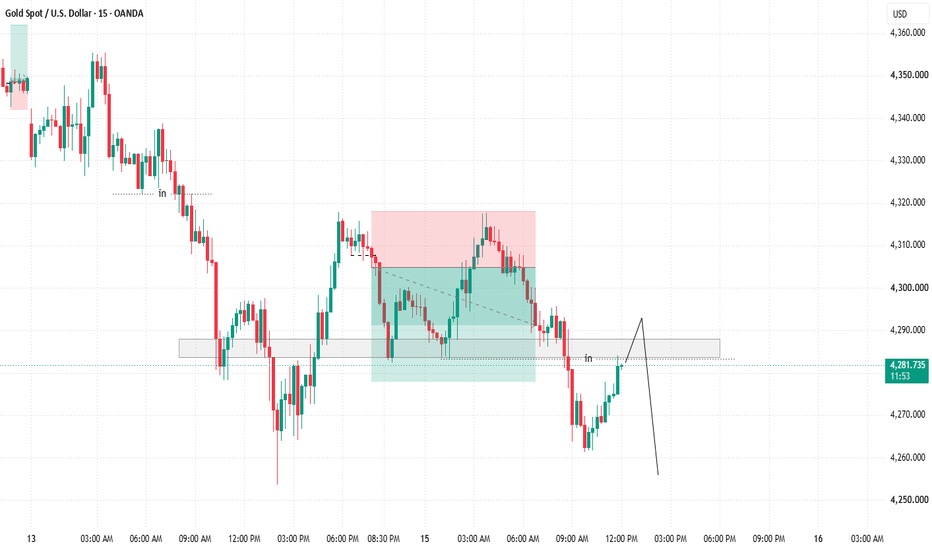
XAU/USD 15 September 2026 Intraday AnalysisH4 Analysis:
-> Swing: Bullish.
-> Internal: Bearish.
Bias and analysis to remain the same as analysis dated 30 June 2026.
Price did not print bullish CHoCH to indicate bullish pullback phase initiation. Price instead printed a new low followed by a bullish CHoCH
Price is currently trading within and established internal range, however, I will continue to monitor price with respect to depth of pullback.
Intraday expectation:
Price to trade up to either premium of internal 50% EQ, or H4 demand zone before targeting weak internal low, currently priced at 3,942.100.
Note:
Gold remains volatile as tensions between the US, Israel, and Iran keep safe‑haven demand elevated.
Markets are reacting quickly to every headline, while uncertainty around the Fed’s easing path and shifting U.S. policy under President Trump, especially tariffs continues to fuel choppy price action.
For newer traders, the key is simple, stay flexible and manage risk carefully, as fast spikes and sudden reversals are a normal part of the current XAU/USD environment.
H4 Chart:
M15 Analysis:
-> Swing: Bearish.
-> Internal: Bullish.
Bias and analysis to remain the same as analysis dated 02 September 2026.
Price has printed according to analysis dated 02 September 2026 whereby I mentioned price to trade up to either premium of internal 50% EQ, or M15 demand zone before targeting weak internal low, currently priced at 4,282.625. Please note, in error I mentioned weak internal high instead of weak internal low.
This is exactly how price printed. Price has subsequently printed a bullish CHoCH to indicate bullish pullback phase initiation.
Price is currently trading within an established internal range. I shall continue to monitor price with respect to depth of pullback.
Intraday expectation:
Price to trade up to either premium of internal 50% EQ, or M15 demand zone before targeting weak internal low, currently priced at 4,253.625.
Note:
Gold remains highly reactive on M15 as geopolitical risk continues to drive quick, headline‑led moves.
The tension between the US, Israel, and Iran is keeping safe‑haven demand elevated, with markets still sensitive to any sign of escalation.
At the same time, shifting US tariff policy under President Trump is adding extra uncertainty, fuelling sharp intraday swings and increasing the likelihood of sudden sentiment flips. Liquidity pockets and whipsaws remain common, making disciplined risk management essential.
Gold’s geopolitical premium is still firmly in place, and until tensions ease, short‑term volatility is likely to stay front‑loaded.
M15 Chart:

Short 
Will I Buy or Sell Gold this Week? Hey Rich Friends,
Happy Monday, I hope all is well. This is my technical analysis for Gold so please make sure to check the news and cross-reference your own charts. Here is what I am looking at:
- The first thing I noticed is that the market has been pretty bearish for the last fews days. I have to wonder if this trend will continue or are the sellers exhausted?
- The market has crossed and closed below the previous day's low around 4292. This is a bearish confirmation for me.
- The red candle bodies still look strong with little to no wicks at the bottom showing there is little resistance from the buyers. This is a bearish confirmation for me.
- The stochastic is still facing down, the slow line (orange) is above the fast line (blue), and one or both lines have crossed below 20. This is a bearish confirmation for me.
- There is a gap to be filled between 4216 and 4135 (or lower) before the market turns bullish.
Additional Information:
- The stochastic is already oversold, but this does not mean an automatic turnaround. This would give me pause to jump in for a sell right away. Check lower timeframes for confluence.
- I will be using past areas of support as SL and previous lows as TPs: 4216, 4200, 4135 and lower
- If the market does buy, it will revisit these prices: 4300, 4333, 4365 and higher
I am leaning toward swinging a sell but great luck if you decide to take this trade.
Peace and Profits,
Cha
Short 
INJ PULLBACK COULD TRIGGER THE NEXT BIG MOVEYello Paradisers, is INJ preparing to shake out impatient traders before launching the next bullish expansion toward the liquidity and resistance levels above?
💎INJ is showing an increasingly interesting short-term structure after breaking out of the falling wedge that controlled price action for several days. The strong reaction from the lows around $5.74, together with the recent increase in volume, suggests that bearish momentum has weakened and buyers are beginning to regain control.
💎The broader picture, however, is still mixed. The weekly and daily structures remain bullish, while the 4H structure is still bearish and the 1H is only starting to shift bullish. This means the upside potential is there, but we still need confirmation that buyers can maintain control from the current area.
💎The most important recent development is the 1H Change of Character around the $6.10-$6.15 area. Price has pushed back above this structure, which is the first meaningful sign that the previous bearish sequence is losing strength.
💎Instead of chasing price around $6.16-$6.17, the cleaner scenario would be a controlled retracement into the highlighted 1H bullish order block around $5.90-$5.96. This zone also overlaps with the nearby imbalance, making it an important area where buyers could step back into the market.
💎If this zone is defended, INJ could first attack the liquidity resting above the recent highs around $6.25-$6.30. A successful breakout there would expose the next major resistance around $6.50-$6.52 on the 4H timeframe.
💎Above that, the next important liquidity sits around the previous equal highs near $6.70, with the major daily resistance positioned around $6.90.
💎This bullish scenario remains valid as long as buyers continue protecting the structure below. A confirmed 1H candle close below approximately $5.82 would invalidate the setup and indicate that INJ may need a deeper correction before any stronger continuation can develop.
💎For now, patience is the key. The opportunity is becoming attractive, but the best trades rarely come from chasing price after the first reaction. We want to see price return into the right area, confirm that buyers are still present, and only then evaluate the next move.
Strive for consistency, not quick profits. Treat the market as a businessman, not as a gambler. Discipline, patience, and proper risk management are the only ways to stay consistent in this market.
MyCryptoParadise
iFeel the success🌴  Long
Long
Gold 1H | Let the Structure Reveal the Next Wave⏱️ Reading time: ~3 minutes
🟦 Scenario 1: Bullish Case
The bullish case does not necessarily require price to move straight higher.
After the recent move, the market may develop a sideways corrective structure and continue moving within the projected range. This would allow the correction to become more complex or time-consuming without necessarily invalidating the larger bullish structure.
Here, time, degree, and the character of the correction are important.
⬛ Scenario 2: Bearish Case
The bearish case offers a different interpretation.
The recent decline may represent the first impulsive wave to the downside, while the sharp recovery that followed could be a correction in the form of a double zigzag.
If this interpretation is correct, we now need to determine whether the market is developing:
a nested 1–2 structure, which could lead to another fast and powerful decline, or
a Leading Diagonal, which could be followed by a retracement proportional to the diagonal, potentially reaching near its Wave 4 area.
However, there is an important distinction.
If the market produces a strong impulsive advance after the recent decline, this bearish interpretation would weaken, increasing the possibility that the market is developing a larger sideways corrective structure instead.
So this chart is not saying that gold must decline or must rally.
It is saying:
The next structure must prove itself.
That is the essence of the Elliott Wave Principle: structure, wave degree, proportionality, and wave personality matter more than simply calling the direction of price.
Patterns whisper. We listen.
— Mr. Nobody 🎧📊
Gold Spot
Sep 5
Gold’s Structural Crossroad
When Trends Disagree, Timing Matters More Than DirectionThe trend is not one thing
One of the most common questions in technical analysis is also one of the most incomplete: “What is the trend?”
The problem is that a market rarely has just one trend. A market can be advancing on a monthly chart, declining on a weekly chart, and changing direction again on a daily chart—all at the same time.
That is not necessarily a contradiction. It is the normal consequence of observing the same market through different time horizons.
A more useful question is: what job should each timeframe perform in the decision process?
The current Gold futures chart provides a useful case study. We are looking at GC on a daily chart while calculating the Supertrend indicator independently from monthly, weekly, and daily data. Supertrend uses volatility, typically through Average True Range, to establish a trailing trend threshold that changes sides when the underlying trend condition changes.
As captured on the chart, the three timeframes are telling three different stories.
The monthly Supertrend remains up. The weekly Supertrend is down. And the daily Supertrend, which was previously up, has just turned down.
Instead of trying to decide which one is “correct,” we can give each timeframe a different role.
Give each timeframe a job
A practical multiple-timeframe framework separates context from timing.
The higher timeframe can tell us about the larger environment. The intermediate timeframe can show whether there is pressure developing within that environment. The shorter timeframe can then provide the timing condition used to evaluate a particular scenario.
Applied to this Gold case study:
The monthly Supertrend provides the broader context: up.
The weekly Supertrend provides intermediate directional pressure: down.
The daily Supertrend provides the newest timing information: it has just turned down.
That combination is more informative than simply labeling Gold bullish or bearish.
The fresh daily downside condition is aligned with the weekly trend, which strengthens the case for examining a downside scenario. But both are operating against a monthly trend that remains up.
That higher-timeframe disagreement matters.
It does not necessarily invalidate a short-term downside scenario. Instead, it can influence how much should reasonably be expected from that scenario.
Direction and expectation are different decisions
This distinction is important.
A trader may identify a valid directional opportunity without expecting a very large move.
When the daily and weekly trends point down while the monthly trend remains up, there are at least two competing forces in the analysis. Shorter-term momentum may carry price lower, while the larger trend creates a reason to be less ambitious about how far that decline might extend.
This is why multiple-timeframe analysis can be useful for more than deciding direction.
It can also help calibrate expectations.
If all three Supertrends were pointing down, a trader might evaluate whether there was room for a more extended downside movement. With the monthly Supertrend still pointing up, a nearer technical objective may be more appropriate for an illustrative scenario.
In other words, the higher timeframe does not always have to determine the trade direction. Sometimes its most valuable role is determining how aggressively—or conservatively—the shorter-timeframe opportunity should be managed.
A trend signal still needs a location
There is another important limitation to address.
A Supertrend change tells us something about direction and timing, but it does not automatically tell us that the current price is a meaningful entry location.
That is why the chart introduces a second condition.
Below the current market sits a minor UFO support area around 4,281.2. Instead of treating the new daily downside Supertrend as sufficient by itself, the illustrative scenario waits for price to break below this UFO support.
This creates a conditional entry near 4,281.2.
The distinction is subtle but important. The trend signal says that conditions have changed. The support break would provide additional evidence that price is actually moving through a level where buyers had previously been able to respond.
Until that happens, there is no entry in this case study.
This helps separate a setup from a trade.
Let market structure define the target
The next relevant support identified on the chart sits around 4,115.2.
That creates a potential target approximately 166 points below the illustrative 4,281.2 entry.
Why stop there rather than assume that a new daily downtrend must produce a much larger decline?
Because the monthly Supertrend is still pointing up.
The target therefore reflects both sides of the analysis. The daily and weekly conditions provide the rationale for examining the downside, while the monthly condition argues against assuming that the downside must become a major longer-term reversal.
This is a reusable principle: higher-timeframe disagreement can be incorporated into target selection rather than treated as a reason to abandon shorter-term analysis altogether.
Using Point of Control to define invalidation
A target answers only half of the risk-management question. We also need to know what would make the scenario no longer acceptable.
For that purpose, the chart uses Point of Control, or POC.
In a volume profile, the POC represents the price at which the greatest amount of volume was transacted within the period being measured. It can therefore identify an area where the market previously demonstrated significant acceptance.
The current-month and prior-month POCs are both positioned above the proposed entry area.
For a downside scenario, that creates a useful structural reference.
Rather than placing a stop an arbitrary number of points above the entry, the illustrative stop is positioned beyond this POC structure, around 4,488.8.
The reasoning is not that price cannot trade through a POC. It can.
Instead, if price breaks the proposed support, activating the downside scenario, and subsequently moves back through the nearby high-volume acceptance area far enough to reach 4,488.8, the original downside thesis has materially weakened.
That makes the stop an invalidation level rather than merely a predetermined distance.
A coherent setup can still have an imperfect payoff
The proposed levels also reveal another useful lesson.
An entry around 4,281.2, stop around 4,488.8, and target around 4,115.2 create approximately 207.6 points of initial risk versus 166 points of potential movement toward the target.
That is roughly a 0.8-to-1 reward-to-risk relationship.
It would be easy to solve that problem cosmetically by selecting a much lower target. But doing so would undermine the logic of the analysis. The reason the target is relatively conservative is precisely because the monthly trend remains up.
This illustrates why a technically coherent setup and an attractive payoff profile are not automatically the same thing.
The analysis should determine meaningful levels first. Risk criteria can then determine whether the resulting scenario is suitable for a particular trading plan.
If a trading plan requires a higher reward-to-risk threshold, the appropriate response may simply be to pass on the scenario, wait for a different entry, or require additional confirmation. Moving technical levels merely to manufacture a preferred ratio reverses the analytical process.
Contract size changes the dollars, not the framework
The same Gold price analysis can be considered through several CME contract sizes.
GC represents 100 troy ounces of Gold. Micro Gold futures, MGC, represent 10 troy ounces, or one-tenth of GC. The 1-Ounce Gold futures contract, 1OZ, represents one troy ounce, or one-hundredth of GC. GC and MGC use a minimum price fluctuation of $0.10 per troy ounce, while 1OZ trades in $0.25 increments.
That scaling makes position size an important part of the case study.
Using the approximate 207.6-point distance between the illustrative entry and stop, the corresponding price risk before commissions, slippage, or gaps would be about $20,760 for one GC contract, $2,076 for one MGC contract, and approximately $207.60 for one 1OZ contract. Actual orders must, of course, conform to each contract's permitted tick increments.
The approximately 166-point distance from entry to target translates to about $16,600 for GC, $1,660 for MGC, and $166 for 1OZ.
These figures also demonstrate why margin and trade risk should never be confused.
The current margin amounts are approximately $22,000 for GC, $2,200 for MGC, and $220 for 1OZ. Margin requirements can change, and the amount required to establish or maintain a futures position is not a limit on how much that position can lose.
The stop distance, contract size, liquidity, possible gaps, and account-level risk limits remain separate considerations.
When trends disagree, ask better questions
Multiple timeframes do not need to agree before they become useful.
The monthly trend can define the broader context. The weekly trend can reveal intermediate pressure. The daily trend can provide timing. Support can determine whether the signal has reached a meaningful location. POC can help establish structural invalidation. And the relationship among those elements can determine whether expectations should be aggressive or conservative.
That leads to a more useful sequence than simply asking whether a market is bullish or bearish:
What is the larger context?
What has changed on the trading timeframe?
Has price reached or broken a meaningful level?
Where would the scenario become invalid?
How far is it reasonable to expect the move to travel given the higher-timeframe condition?
In this Gold example, the monthly, weekly, and daily Supertrends disagree—but that disagreement is exactly what makes the analysis educational.
Direction is only one part of the decision.
Timing, location, expectation, and risk determine what can actually be done with it.
Data Consideration
When charting futures, the data provided could be delayed. Traders working with the ticker symbols discussed in this idea may prefer to use CME Group real-time data plan on TradingView: www.tradingview.com - This consideration is particularly important for shorter-term traders, whereas it may be less critical for those focused on longer-term trading strategies.
General Disclaimer
The trade ideas presented herein are solely for illustrative purposes forming a part of a case study intended to demonstrate key principles in risk management within the context of the specific market scenarios discussed. These ideas are not to be interpreted as investment recommendations or financial advice. They do not endorse or promote any specific trading strategies, financial products, or services. The information provided is based on data believed to be reliable; however, its accuracy or completeness cannot be guaranteed. Trading in financial markets involves risks, including the potential loss of principal. Each individual should conduct their own research and consult with professional financial advisors before making any investment decisions. The author or publisher of this content bears no responsibility for any actions taken based on the information provided or for any resultant financial or other losses. Education 
XAU/USD 14 September 2026 Intraday AnalysisH4 Analysis:
-> Swing: Bullish.
-> Internal: Bearish.
Bias and analysis to remain the same as analysis dated 30 June 2026.
Price did not print bullish CHoCH to indicate bullish pullback phase initiation. Price instead printed a new low followed by a bullish CHoCH
Price is currently trading within and established internal range, however, I will continue to monitor price with respect to depth of pullback.
Intraday expectation:
Price to trade up to either premium of internal 50% EQ, or H4 demand zone before targeting weak internal low, currently priced at 3,942.100.
Note:
Gold remains volatile as tensions between the US, Israel, and Iran keep safe‑haven demand elevated.
Markets are reacting quickly to every headline, while uncertainty around the Fed’s easing path and shifting U.S. policy under President Trump, especially tariffs continues to fuel choppy price action.
For newer traders, the key is simple, stay flexible and manage risk carefully, as fast spikes and sudden reversals are a normal part of the current XAU/USD environment.
H4 Chart:
M15 Analysis:
-> Swing: Bearish.
-> Internal: Bullish.
Bias and analysis to remain the same as analysis dated 02 September 2026.
Price has printed according to analysis dated 25 August 2026 whereby I mentioned, in alternative scenario, that it would be entirety feasible if price was to target strong internal low and print a bearish iBOS, given the internal structure of H4 is bearish.
This is exactly how price printed. Price has subsequently printed a bullish CHoCH to indicate bullish pullback phase initiation.
Price is currently trading within an established internal range. I shall continue to monitor price with respect to depth of pullback.
Intraday expectation:
Price to trade up to either premium of internal 50% EQ, or M15 demand zone before targeting weak internal high, currently priced at 4,282.625.
Note:
Gold remains highly reactive on M15 as geopolitical risk continues to drive quick, headline‑led moves.
The tension between the US, Israel, and Iran is keeping safe‑haven demand elevated, with markets still sensitive to any sign of escalation.
At the same time, shifting US tariff policy under President Trump is adding extra uncertainty, fuelling sharp intraday swings and increasing the likelihood of sudden sentiment flips. Liquidity pockets and whipsaws remain common, making disciplined risk management essential.
Gold’s geopolitical premium is still firmly in place, and until tensions ease, short‑term volatility is likely to stay front‑loaded.
M15 Chart: Crude Oil | When Structure Speaks Before the Move⏱️ Reading Time: About 2 Minutes
In our previous crude oil analyses, the goal was never to predict price or choose a fixed direction. Instead, we focused on understanding the structure the market was building.
One of the key possibilities we were tracking was the potential completion of a larger-degree Wave (II). Rather than simply taking a bullish or bearish stance, we waited for the market to reveal the character of its next move.
As the new movement developed, lower timeframes began showing impulsive behavior and nested 1–2 structures—exactly the type of development that could support the larger bullish scenario.
Now, in the latest daily update, the picture is very different from when this structure was first identified. Price has moved significantly away from the area where we considered Wave (II) to be complete, while a bullish structure continues to develop across multiple degrees.
But the most important point for us is not today’s price.
The real question is:
Was the structure we identified back then consistent with the market’s subsequent behavior?
So far, yes.
That does not mean the path ahead is certain, nor does it mean the current count is final. We still need to let the market develop its next structures and show us whether this move is truly unfolding as a larger-degree Wave III, or whether another correction and a revised count will eventually be required.
For us, this is where the real value of Elliott Wave lies:
Not in trying to predict the future,
but in following the structure closely enough to let the market reveal what it is actually building.
Patterns whisper. I listen.
— Mr. Nobody
CFDs on Crude Oil (WTI)
Jun 25
US Oil – 4H Elliott Wave Update
Aug 10
Crude Oil: Is a Larger Wave III Beginning?
 Long
Long
 Long
Long
S&P 500 | Wave III: More Upside or a Major Pause?Reading time: about 2 minutes
This chart analyzes the long-term behavior of the S&P 500 through the lens of the Elliott Wave Principle.
In this count, the larger market advance from the 2009 low is viewed as an impulsive structure. The 2020 correction is labeled as Wave II, followed by the development of Wave III — a wave that often represents the strongest part of an impulsive sequence.
Bullish Scenario
In the bullish scenario, Wave III may not be complete yet, and its internal structure could continue developing toward Wave 5.
There is also a possibility of an Expanded Fifth Wave. As long as the bullish channel and the key confirmation levels on the chart remain intact, this scenario remains valid, with the potential for higher Fibonacci-based targets.
Conservative Scenario
The alternative scenario is that the market may need a corrective or sideways phase before continuing the larger trend.
This is where the Principle of Alternation becomes important. If the previous correction was sharp and deep, such as a Zigzag, the next correction may develop differently and take a more sideways form, such as a Flat, Triangle, Double Three, or Triple Three.
Therefore, a potential correction would not necessarily mean that the larger bullish trend has ended. The market may simply lose more time than price while completing its structure before the next major move.
In Elliott Wave analysis, the goal is not to predict the future with certainty. We follow the structure, define the scenarios, and let the market confirm which scenario is valid.
Analysis Name:
Mr. Nobody | Structure in Motion
Signature:
Patterns whisper… I listen.
S&P 500 Index
Jul 28
S&P 500: Third-Wave Expansion or a Deeper Correction?
 Long
Long
Advanced Smart Money Concepts (SMC) Smart Money Concepts (SMC) is a price-action-based framework that helps traders study market structure, liquidity, displacement, and potential areas of institutional order flow. The objective is not to predict every market movement, but to understand how price may react around important liquidity pools and structural levels.
Advanced SMC combines multiple concepts into a structured analytical process. Instead of relying on one signal, traders evaluate the broader market context, liquidity behavior, structural confirmation, and risk-to-reward conditions before considering a potential setup.
1. Higher-Timeframe Market Structure
The first step is to identify the overall market direction using higher-timeframe price action.
- Bullish structure: Higher Highs (HH) and Higher Lows (HL).
- Bearish structure: Lower Highs (LH) and Lower Lows (LL).
- Range-bound market: Price moves between defined support and resistance areas without clear directional continuation.
Higher-timeframe structure provides context, while lower-timeframe analysis may help refine entries. A lower-timeframe setup should always be evaluated in relation to the broader market environment.
2. Liquidity and Stop-Run Behavior
Liquidity refers to areas where buy-side or sell-side orders may be concentrated. Common liquidity pools include:
- Previous highs and previous lows.
- Equal highs and equal lows.
- Session highs and lows.
- Major swing points.
- Areas around obvious support and resistance.
Price may move toward these areas before continuing in the intended direction. A liquidity sweep occurs when price temporarily trades beyond a notable high or low and then reacts.
However, a sweep alone is not confirmation of a reversal. Traders should wait for additional evidence, such as displacement or a confirmed market structure shift.
3. Break of Structure (BOS)
A Break of Structure (BOS) generally refers to price breaking a significant swing point in the direction of the prevailing trend.
For example:
- In a bullish market, price breaks above a previous significant high.
- In a bearish market, price breaks below a previous significant low.
BOS may support the idea of trend continuation, but the significance of the break depends on the timeframe, the strength of the move, and the surrounding liquidity.
4. Market Structure Shift (MSS)
A Market Structure Shift (MSS) is used to describe a potential change in short-term or intermediate market direction.
A typical bullish MSS may involve:
1. Price taking sell-side liquidity.
2. Strong bullish displacement.
3. Price breaking a relevant lower-timeframe swing high.
A typical bearish MSS may involve:
1. Price taking buy-side liquidity.
2. Strong bearish displacement.
3. Price breaking a relevant lower-timeframe swing low.
MSS should be treated as a confirmation tool rather than an automatic entry signal.
5. Displacement and Imbalance
Displacement refers to a strong, decisive price movement that shows clear directional momentum. It may leave behind an imbalance or Fair Value Gap (FVG).
A Fair Value Gap is an area where price moved rapidly, leaving limited trading activity between candles. Traders may monitor these zones as potential retracement areas, but not every FVG will be respected.
A higher-quality FVG setup may have:
- Clear displacement.
- Alignment with the higher-timeframe structure.
- A nearby liquidity event.
- A logical invalidation level.
- Sufficient room toward the next target.
6. Order Blocks (OB)
An Order Block is commonly identified as a significant opposing candle or price area before a strong displacement that leads to a structural move.
Examples include:
- Bullish Order Block: A potential demand area before a strong bullish move.
- Bearish Order Block: A potential supply area before a strong bearish move.
An order block becomes more meaningful when it aligns with liquidity, market structure, displacement, and a clear reaction zone. It should not be treated as a guaranteed support or resistance level.
7. Premium and Discount
The premium and discount concept divides a selected price range into relative valuation zones.
- Discount area: The lower portion of the range, often monitored for potential bullish opportunities.
- Premium area: The upper portion of the range, often monitored for potential bearish opportunities.
- Equilibrium: The midpoint of the selected range.
For a bullish idea, traders may prefer to study potential entries in discount. For a bearish idea, they may prefer premium. However, these zones are contextual and should not be used as standalone entry signals.
8. Advanced SMC Buy Model
A potential bullish SMC model may follow this sequence:
1. Identify a bullish higher-timeframe structure.
2. Locate relevant sell-side liquidity.
3. Wait for a possible liquidity sweep.
4. Look for bullish displacement.
5. Confirm a lower-timeframe MSS or BOS.
6. Identify a valid bullish Order Block or FVG.
7. Wait for a retracement into the selected entry zone.
8. Define the stop-loss below the structural invalidation level.
9. Target logical buy-side liquidity or previous highs.
10. Manage the trade according to the predefined risk plan.
9. Advanced SMC Sell Model
A potential bearish SMC model may follow the opposite sequence:
1. Identify a bearish higher-timeframe structure.
2. Locate relevant buy-side liquidity.
3. Wait for a possible liquidity sweep.
4. Look for bearish displacement.
5. Confirm a lower-timeframe MSS or BOS.
6. Identify a valid bearish Order Block or FVG.
7. Wait for a retracement into the selected entry zone.
8. Define the stop-loss above the structural invalidation level.
9. Target logical sell-side liquidity or previous lows.
10. Manage the trade according to the predefined risk plan.
10. Multi-Timeframe Analysis
A structured multi-timeframe approach can improve clarity:
- Higher timeframe: Identify trend, range, major liquidity, and key zones.
- Intermediate timeframe: Refine structure and locate potential areas of interest.
- Lower timeframe: Look for confirmation, entry models, and precise invalidation.
The purpose of multi-timeframe analysis is to create alignment, not to force a trade when the timeframes disagree.
11. Trade Invalidation and Confirmation
Every setup should have a clear invalidation point. A trade idea may become invalid if price breaks the structural level that supported the original analysis.
Before entering, traders should ask:
- Is the market structure clear?
- Has liquidity been taken or respected?
- Is there meaningful displacement?
- Is the entry zone logically defined?
- Where is the setup invalidated?
- Is the potential reward reasonable compared with the risk?
- Are current market conditions suitable for the setup?
If these conditions are unclear, waiting may be the more disciplined decision.
12. Risk Management
Risk management is one of the most important parts of any trading framework. A technically strong setup can still result in a loss, so every trade should be planned around controlled risk.
Key risk-management principles:
- Define the stop-loss before entering.
- Risk only a small, predetermined percentage of account equity per trade.
- Calculate position size according to the stop-loss distance and acceptable risk.
- Avoid increasing position size after a loss to recover money quickly.
- Avoid moving the stop-loss farther away simply to prevent a loss.
- Do not risk more because a setup appears highly confident.
- Maintain a reasonable risk-to-reward expectation.
- Avoid overexposure across highly correlated instruments.
- Be cautious during major news events and volatile market conditions.
- Never trade with money required for essential expenses.
A useful position-sizing concept is:
Position Size = Amount of Account Risk ÷ Stop-Loss Risk per Unit
The exact risk percentage should depend on the trader’s account size, experience, strategy, and personal risk tolerance.
13. Trading Discipline
A trading strategy is only effective when supported by consistent execution and emotional discipline.
Professional trading discipline includes:
1. Follow a written trading plan.
2. Wait for confirmation instead of entering from anticipation.
3. Avoid revenge trading after a loss.
4. Do not overtrade during low-quality market conditions.
5. Accept that missed trades are part of trading.
6. Avoid changing the strategy after every losing trade.
7. Keep a detailed trading journal.
8. Review both winning and losing trades objectively.
9. Respect daily and weekly loss limits.
10. Stop trading when emotional decision-making begins to affect execution.
The goal is not to win every trade. The goal is to execute a repeatable process while keeping losses controlled.
14. Final Perspective
Advanced SMC is best used as a structured way to interpret price action, not as a guaranteed prediction system. Liquidity sweeps, BOS, MSS, Order Blocks, and FVGs can provide useful context, but no single concept guarantees a market reaction.
A high-quality trading approach combines market structure, liquidity, confirmation, risk management, and discipline. The strongest advantage comes from consistency, patience, and the ability to protect trading capital over the long term.
This content is for educational purposes only and does not constitute financial advice. Education 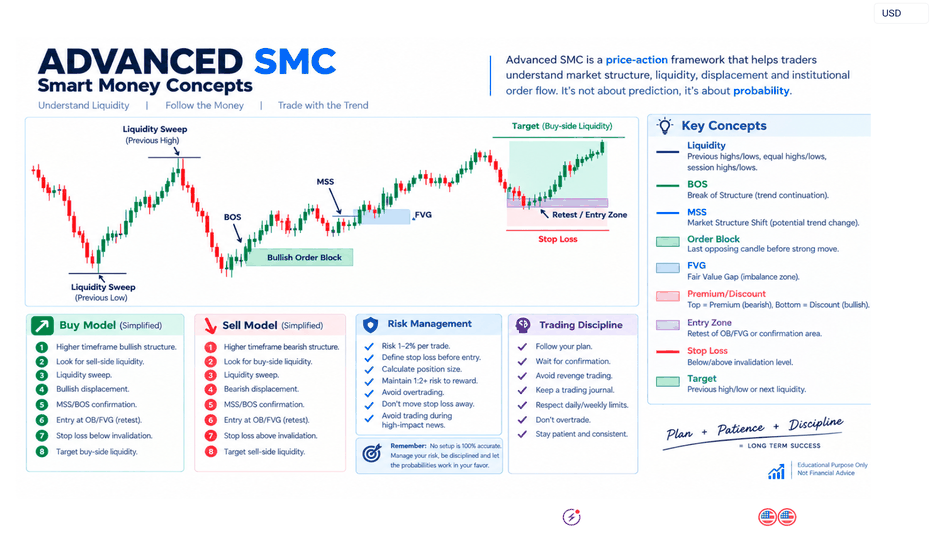
Episode 07 — The Moment the Market Revealed Its Language🎬 Mr. Nobody’s Chronicle
Season I — The History of Elliott Wave Principle
Episode 07 — The Moment the Market Revealed Its Language
⏱️ Reading time: ~3 minutes
“Sometimes, the greatest discoveries do not begin with an answer... but with the right question.”
After years of studying market charts, one question continued to occupy Ralph Nelson Elliott’s mind:
Why do certain market movements, despite appearing at different times and price levels, seem to share a remarkable similarity?
For many people, a chart was simply a collection of lines.
Price movements.
Advances.
Declines.
Rallies.
Falls.
But Elliott was looking beyond price itself.
He was not searching for numbers...
He was searching for the human behavior behind those numbers.
Because every major market movement is created by millions of independent decisions.
The fear of a seller.
The hope of a buyer.
The confidence of an investor.
And the uncertainty of those still waiting.
Elliott gradually realized that these emotions, although they appeared chaotic, could create recurring structures over time.
The market was not simply moving...
The market was behaving.
But one important question remained:
How could this behavior be recognized on a chart?
After years of observation, something began to reveal itself.
Major market movements often appeared to develop through a five-part structure.
And after those movements were completed, the market frequently entered a corrective phase that unfolded in three parts.
Five movements in the direction of the main trend...
And
Three movements as a correction.
But for Elliott, these numbers were not just a simple counting method.
Behind these structures was the story of human emotion.
The advance of confidence.
The return of fear.
The formation of hope.
And the repetition of collective human psychology.
He called this observation the Wave Principle.
However, his goal was not to predict the future with absolute certainty.
His goal was to better understand the behavior that the market was revealing.
Perhaps Elliott’s greatest discovery was this:
The market is not just a collection of prices.
The market is the story of human decisions.
And the chart...
is the language that records that story.
But discovering this language was only the beginning.
If the market moved with such a rhythm...
Did every wave have the same personality?
Did each structure follow its own rules?
The answer to these questions would shape the next chapter of Elliott’s research...
To be continued...
Narrated by Mr. Nobody 🎧📊
Research & Market Studies
Mehdi & Rana Education 


