BREAKOUT PULLBACK TRENDANALYSIS SWINGTRADING CRYPTOCURRENCYBitcoin is currently approaching a key demand zone between 64,680 and 64,800. If price reacts positively from this area and buyers step in, I'll be looking for a continuation toward the following targets.
Trade Plan:
Long Entry: 64,680–64,800
Stop Loss: 64,179
TP1: 66,470
TP2: 67,290
TP3: 67,920
This setup is based on the expectation that the demand zone will hold. A break below the stop-loss level would invalidate the bullish scenario.
As always, wait for confirmation and manage your risk.
This is my personal market analysis and not financial advice.  Long
Long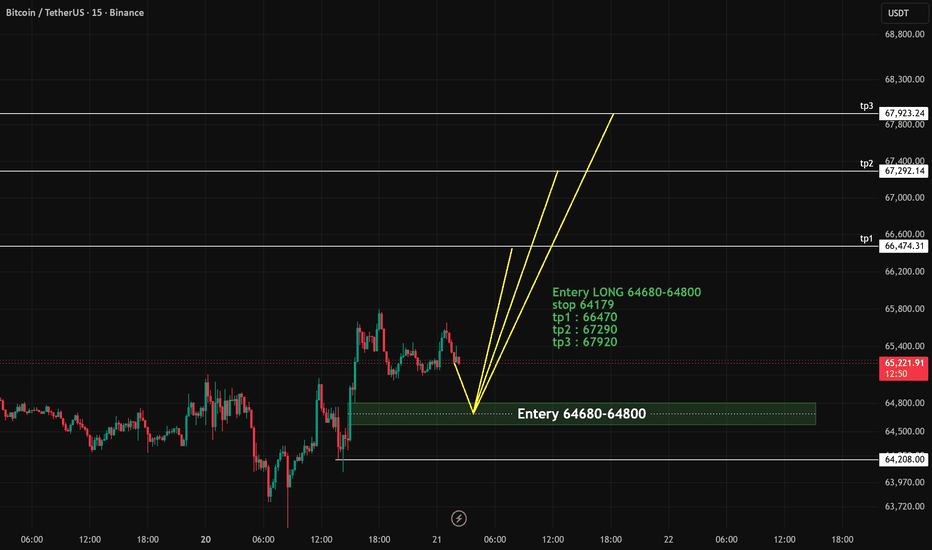
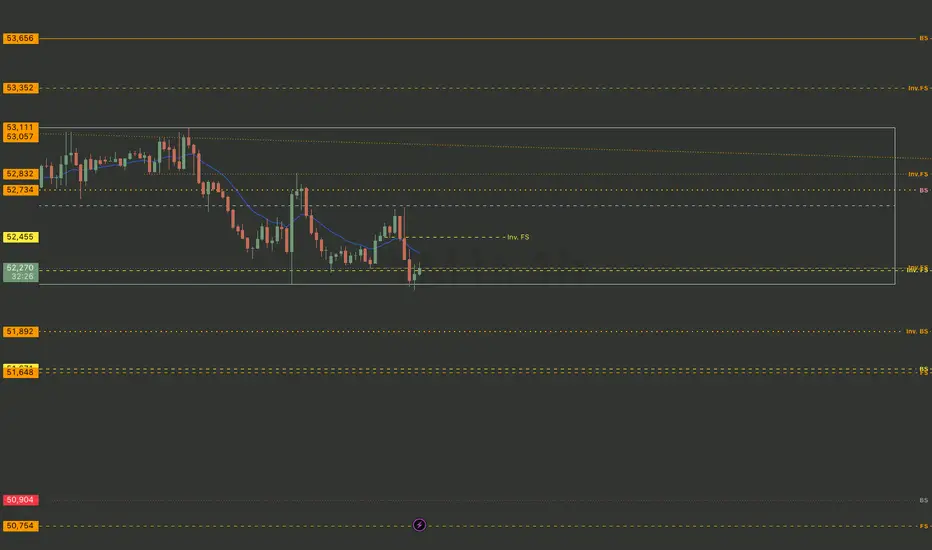
NQ | Wk 30 - 31 Q3 2026 | 4hr chartPrice action is currently looking for exits while some try to build the failing support.
The higher timeframe is showing signs to push price to $26,020
A 4hr Frontside level bravely stands in defense of those investors in short shorts. Strength favors the higher timeframe so the valiant faith of the $28,108 investors in longpants may catch the knife and get their fill this week.
If its going down, where is it going down from? There is a 4hr resistance level created 14 jul 8:00 sitting at $29,567.50 which looks like a level of interest if price gets above current support levels acting as resistance at $29,220-$29,122.
-----------------------------------
Multiple Time-Frame Analysis; Color Code | Strength favors the higher timeframe.
Yearly timeframe = black
Monthly timeframe = pink
weekly = grey
daily = red
4hr = orange
1hr = yellow
15min = blue
5min = green if they are shown. (Level visibility on intervals is set to timeframe the level was found on and below to keep chart view organized.)
** Candle Science explained **
A Range = two or more consecutive color candles.
There are two types of ranges - accumulation and distribution.
DISTRIBUTION RANGES DEFINED:
When price is above a distribution range, these candles/levels act as support.
(BS) BACKSIDE Candle - First distribution candle in a distribution range. Expectation = strong reaction to price. long wicks reaching to or away from level.
(FS) FrontSide Candle - Last distribution candle in a distribution range. Expectation = reversal, create a trend in the opposite direction. Distribution candles are used as support.
ACCUMULATION RANGES DEFINED: When price is below an accumulation range, these candles/levels act as resistance.
INVERSE BACKSIDE (Inv.BS) - First Accumulation candle in an accumulation range. Expectation. = strong reaction to price. long wicks reaching to or away from level.
INVERSE FRONTSIDE (Inv.FS) - Last accumulation candle in an accumulation range. Expectation = reversal, create a trend in the opposite direction. Accumulation candles are used as resistance.  Short
Short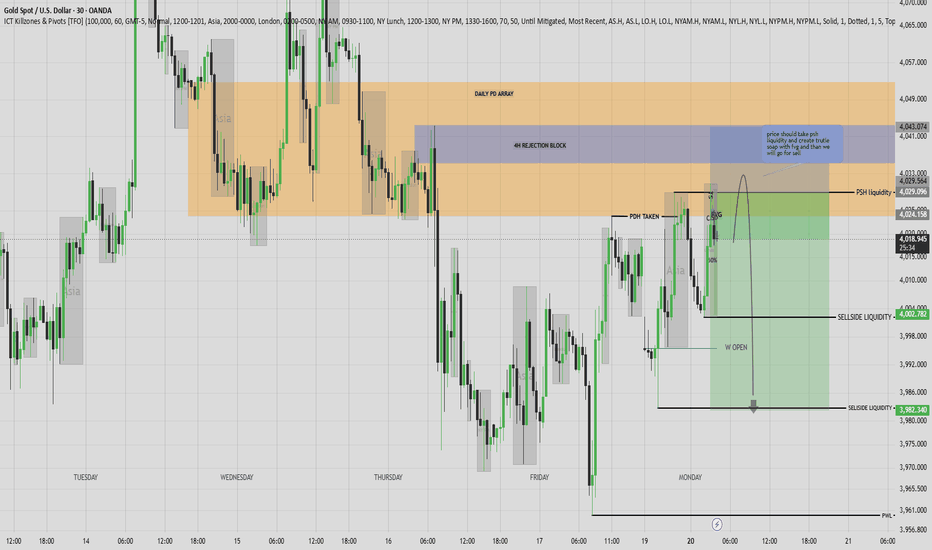
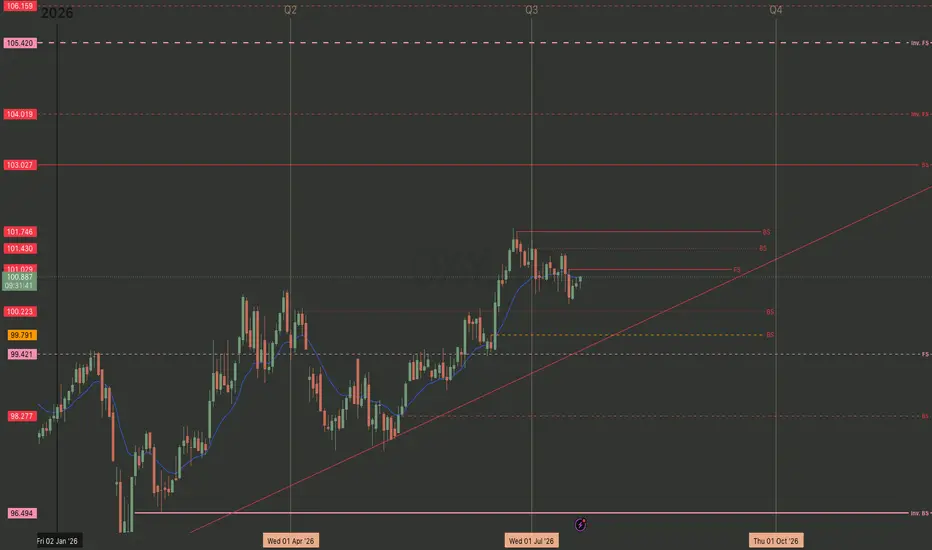
DXY | Q3 2026 | Day ChartIts good to keep an eye on DXY
A 4hr / daily timeframe accumulation trend created 27 Jan in Q1 & confirmed the first week of May with 5 days using the trend as its support friend. Enough investors in Long pants were able to get some price action above the monthly support at $99.42 resistance and use it as support to keep their accumulation trend going.
price action today is under a daily Frontside candle which is often used as a target so those investors waiting there are R.A.T.S using the support candle as resistance and calling a "Rejection As target" to exit their scalps, abandon the long pant party and put on some shorts.
it all depends if the the Long Pant investors can destroy the R.A.T's or not. If so, they march victoriously to $104 - $105.
If not, then investors in short's take it down to trend and the 4hr BackSide range will be the last hope at $99.791 to support the accumulation trend.
When trends break, price action targets the base of the trend, called the "vertex".
The Vertex of any trend is protected by the BackSide or FrontSide of the range - Support range or Resistance range.
When a BackSide candle or BackSide of the range is tested, price action is expected to show a strong reaction - i.e long wicks to or away from level. big body "engulfing" candles, leaving F.V.G's and creating another vertex for a high angle trend.
The FrontSide of the range shows a more subtle reaction, a low angle trend that ladders slowing in the direction of the trend.
4 candles:
BackSide = Supports high angle trends
FrontSide = Supports low angle trends.
(Inv.BS) Inverse BackSide = Resistance, supports high angle distribution trends. the inverse of the BackSide support Candle
Inv.FS) Inverse FrontSide = Resistance, supports low angle distribution trends. The inverse of the FrontSide support candle.
A Range is 2 or more consecutive candles of the same color. The BackSide candle or Inv.Backside is always the first candle of that range.
The FrontSide or Inverse FS is always the last candle of that range.
4 candles, 4 levels illustrating the structure of the market with a methodical, data driven approach.
If the expectations are not met, then price action is targeting a different range than the one you chose to look at. Opportunities to exit usually present themselves by the same science. Strength favors the higher timeframes.
-----------------------------------
Multiple Time-Frame Analysis; Color Code | Strength favors the higher timeframe.
Yearly timeframe = black
Monthly timeframe = pink
weekly = grey
daily = red
4hr = orange
1hr = yellow
15min = blue
5min = green if they are shown. (Level visibility on intervals is set to timeframe the level was found on and below to keep chart view organized.)
** Candle Science explained **
A Range = two or more consecutive color candles.
There are two types of ranges - accumulation and distribution.
DISTRIBUTION RANGES DEFINED:
When price is above a distribution range, these candles/levels act as support.
(BS) BACKSIDE Candle - First distribution candle in a distribution range. Expectation = strong reaction to price. long wicks reaching to or away from level.
(FS) FrontSide Candle - Last distribution candle in a distribution range. Expectation = reversal, create a trend in the opposite direction. Distribution candles are used as support.
ACCUMULATION RANGES DEFINED: When price is below an accumulation range, these candles/levels act as resistance.
INVERSE BACKSIDE (Inv.BS) - First Accumulation candle in an accumulation range. Expectation. = strong reaction to price. long wicks reaching to or away from level.
INVERSE FRONTSIDE (Inv.FS) - Last accumulation candle in an accumulation range. Expectation = reversal, create a trend in the opposite direction. Accumulation candles are used as resistance.
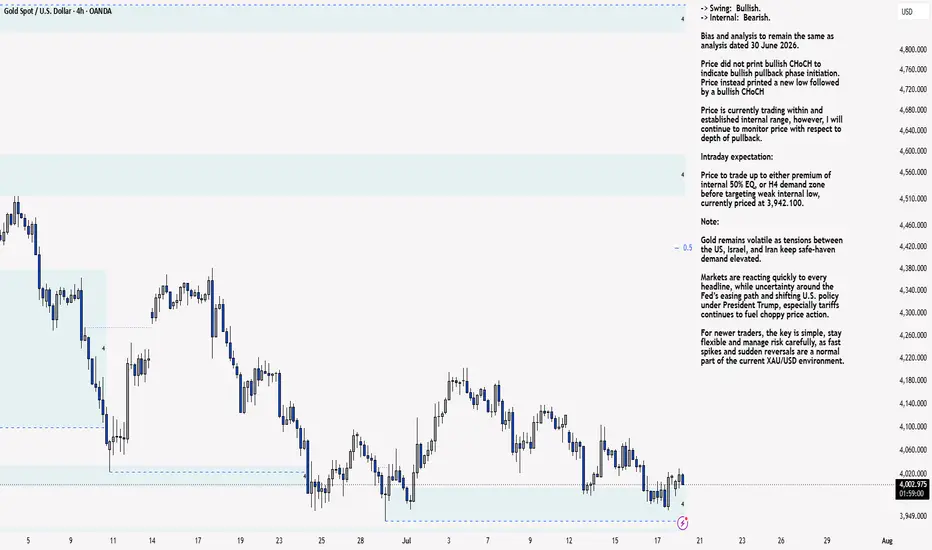
XAU/USD 20 July 2026 Intraday AnalysisH4 Analysis:
-> Swing: Bullish.
-> Internal: Bearish.
Bias and analysis to remain the same as analysis dated 30 June 2026.
Price did not print bullish CHoCH to indicate bullish pullback phase initiation. Price instead printed a new low followed by a bullish CHoCH
Price is currently trading within and established internal range, however, I will continue to monitor price with respect to depth of pullback.
Intraday expectation:
Price to trade up to either premium of internal 50% EQ, or H4 demand zone before targeting weak internal low, currently priced at 3,942.100.
Note:
Gold remains volatile as tensions between the US, Israel, and Iran keep safe‑haven demand elevated.
Markets are reacting quickly to every headline, while uncertainty around the Fed’s easing path and shifting U.S. policy under President Trump, especially tariffs continues to fuel choppy price action.
For newer traders, the key is simple, stay flexible and manage risk carefully, as fast spikes and sudden reversals are a normal part of the current XAU/USD environment.
H4 Chart:
M15 Analysis:
-> Swing: Bearish.
-> Internal: Bearish.
Price has printed according to analysis dated 14 July 2026 where I mentioned price to trade up to either premium of internal 50% EQ, or M15 demand zone before targeting weak internal low, priced at 3,983.545. This is how price printed.
Price has subsequently printed a bullish CHoCH to indicate bullish pullback phase initiation. Price has since printed lower. Depth of pullback has been insignificant, therefore, I will not classify the bearish iBOS, however, I have marked this in red for illustration purposes.
Price has since printed a further bullish CHoCH and once again price is trading within an established internal range, however, I shall again monitor price action with regards to depth of pullback.
Intraday expectation:
Price to trade up to either premium of internal 50% EQ, or M15 demand zone before targeting weak internal low, priced at 3,959.800.
Note:
Gold remains highly reactive on M15 as geopolitical risk continues to drive quick, headline‑led moves.
The tension between the US, Israel, and Iran is keeping safe‑haven demand elevated, with markets still sensitive to any sign of escalation.
At the same time, shifting US tariff policy under President Trump is adding extra uncertainty, fuelling sharp intraday swings and increasing the likelihood of sudden sentiment flips. Liquidity pockets and whipsaws remain common, making disciplined risk management essential.
Gold’s geopolitical premium is still firmly in place, and until tensions ease, short‑term volatility is likely to stay front‑loaded.
M15 Chart:  Long
Long
 Short
Short
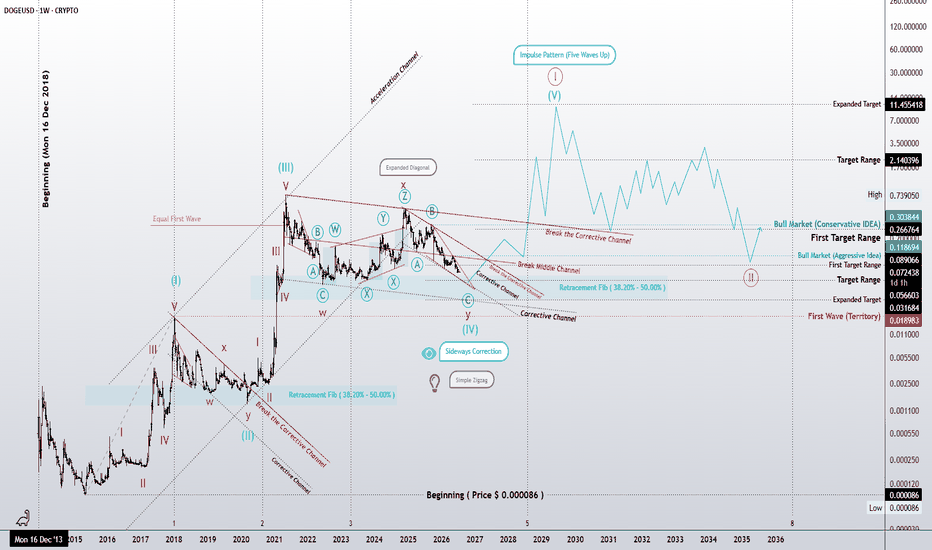
Dogecoin — The Structure of a Potential Golden Era
Taking a closer look at the third wave of Dogecoin, we can now examine the internal structure of this larger-degree scenario in greater detail.
What makes this chart particularly interesting is that, in some cases, the patterns do not remain confined to the boundaries we initially expect. Instead, they gradually extend beyond their original framework and begin to reveal a much larger structure.
Here, we are looking at a long-term scenario that, if confirmed, could potentially lay the foundation for a Golden Era for Dogecoin.
Of course, “Golden Era” is not a slogan or a guaranteed prediction.
The meaning of that term will ultimately be determined by the structure itself and by the path the market chooses to take in the future.
In my long-term studies of Bitcoin, Ethereum, and Dogecoin, one common element has repeatedly captured my attention:
Structure.
Not excitement.
Not hype.
Not unsupported predictions.
If this scenario eventually unfolds, it will not be because we decided in advance that the market must go higher.
It will be because the structure allowed for that possibility.
At the current stage, Wave IV appears to be approaching its final stages, and specific targets have already been defined for this corrective structure.
Once Wave IV is complete, the next step is no longer prediction.
It is waiting for confirmation through price action.
A breakout from the corrective channels, followed by the ability of price to hold above the broken structure and develop a valid bullish pattern, could provide the first significant evidence that the next major advance is beginning.
However, there is one important principle we must always remember.
The market is a very strict enforcer.
For every violation of its rules, the market demands a heavy penalty.
If a scenario violates its structural rules, we must accept it.
If an invalidation level is broken, the count must be reconsidered.
The market does not negotiate with any analyst.
At the same time, missing a valid opportunity also carries a cost.
Sometimes, missing a major move can be just as costly as taking a position against the market.
Therefore, the goal is not to be in the market at all times.
The goal is to understand the structure, define the scenarios, identify the invalidation levels, and act when the market provides the confirmation.
At this stage, the long-term structure of Dogecoin continues to present a very interesting scenario.
This structure may eventually develop into a much larger advance.
Perhaps it will complete and reveal what could truly become a Golden Era for Dogecoin.
Or perhaps the market will violate the structure and force us to reconsider the count.
Ultimately, the only thing capable of providing the real answer is future price action and market structure.
For now, patience is required.
We must allow the future to reveal itself.
Several years from now, this chart may provide very interesting feedback.
Will this structure ultimately lead to the major advance illustrated in this scenario?
Or will the market choose another path?
The future will provide the answer.
But until then, one thing remains clear:
We do not predict the future. We study the structure and allow the market to reveal what comes next.
— Mr. Nobody | Elliott Wave Principle  Long
Long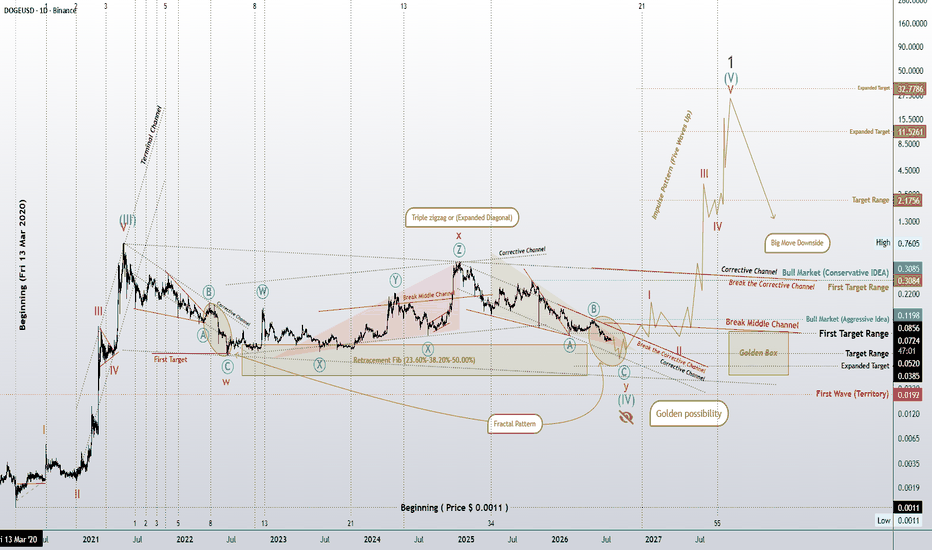
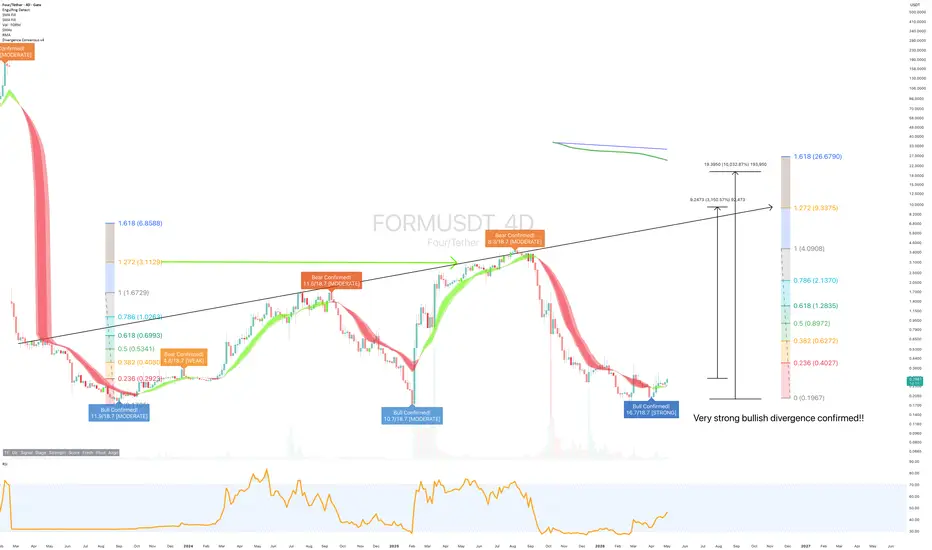
Four (FORM) 3150% to Fibonacci Resistance. May 2026Yes, 30x
SYMBOL: FORMUSDT | DIRECTION: LONG | TIMEFRAME: 4-Day
Published: May 2026
Nobody is talking about FORM. At $0.28, with a 30x resistance target to $10 confirmed by two independent Fibonacci measurements and the strongest divergence signal to ever print, what are you waiting for? The crowd?
On the above 4-day chart price action has corrected over 95% from its all-time high. Several compelling reasons now exist to consider a long position. They include:
1) Strong bullish divergence confirmed. Price action has been printing lower lows throughout the 2025 - 2026 decline. RSI now prints higher lows, a divergence that has now resolved with the oscillator turning upward and the buy signal.. never mind about that.
Divergence of this strength on a 4-day timeframe is not a minor signal. It is the oscillator telling you that sellers are exhausted at these levels, regardless of what the price action has been suggesting. Look left.
2) The Fibonacci 1.272 extension and previous cycle alignment . The right-side Fibonacci extension projects the 1.272 level to $9.34, approximately 3,150% from the current price, or roughly 30x. This level is not arbitrary: it aligns with the general territory of the previous cycle’s Fibonacci extension zone, visible on the left side of the chart where the 1.618 printed at $6.86. Two independent Fibonacci measurements from two separate cycles pointing to the same price region is confluence. It is the kind of target confirmation that transforms a projection into a destination.
3) The ascending trend-line from the lows . The black diagonal trendline visible on the chart connects the significant lows and projects upward toward the $9.34 target area. Price is currently at that trendline. The trendline, the Fibonacci extension, and the composite bull signal are all aligned at the same moment. These confluences are rare. They do not remain unnoticed indefinitely.
Targets
1st target: $0.90, the 0.5 Fibonacci retracement (~220%). The first zone of meaningful resistance. Expected to produce a pause and partial profit-taking. Not a reason to exit the full position.
2nd target: $2.14, the 0.786 Fibonacci retracement (~660%). Significant resistance. Where prior support from the 2024 consolidation sits. A 4-day close above this level opens the door to the upper targets.
3rd target: $9.34, the 1.272 Fibonacci extension (~3,150%, approximately 30x from current levels). This is where the previous cycle’s Fibonacci structure and the new cycle’s extension converge. It is the destination the chart is pointing toward. It is not a forecast to be taken lightly, nor is it one to be dismissed. The trendline, the composite oscillator, and two sets of Fibonacci measurements all agree on this area as the primary target.
Extended target: 700x! the upper band visible resistance the chart. Not a base case. The scenario in which FORM outperforms its prior cycle. Included because the chart shows it.
What cancels the thesis?
A 4-day close below $0.1967, the Fibonacci 0 level, the base of the extension invalidates the setup. That level represents a structural failure of the current support. Until a close below that level prints, the bias is long, the divergence is confirmed, and the signal is the strongest this chart has ever produced.
The crowd
FORM does not trend on social media. There are no YouTube videos about it this week. There is no narrative attaching itself to it. It is simply a chart, at a low, with the strongest composite signal in its history, printing a confirmed bullish divergence, at a Fibonacci confluence that aligns with the previous cycle. The crowd will find it eventually. They usually do somewhere around $3 or $4, when it feels safe again. Today it's yours for 29 cents.
Is it possible price falls further? Sure.
Is it probable given what the 4-day chart is showing? No.
Good luck.
Ww
=============================================================
Disclaimer : This idea is for educational and informational purposes only. It is not financial advice. Trading cryptocurrencies involves substantial risk of loss and is not suitable for every investor. Always do your own research and consult a qualified financial adviser before making any investment decisions. Past performance is not indicative of future results.
 Long
Long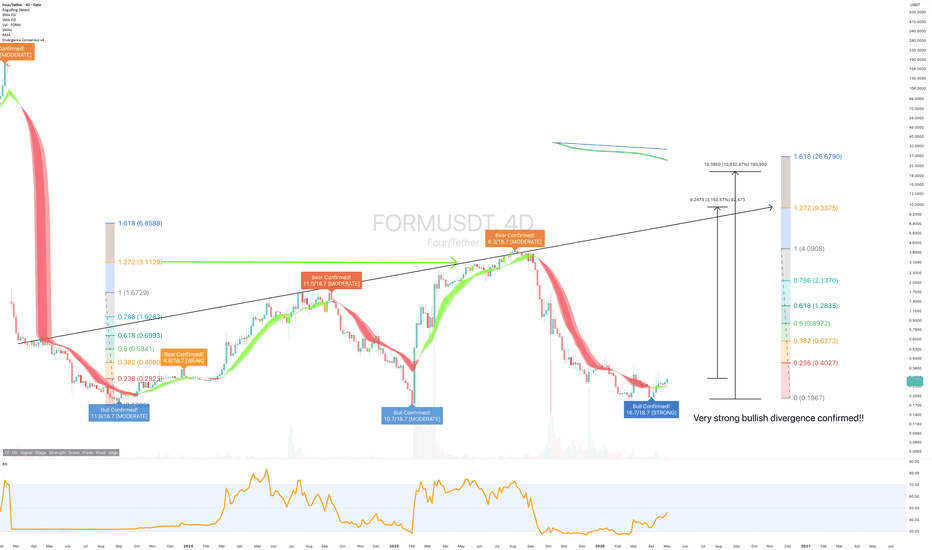
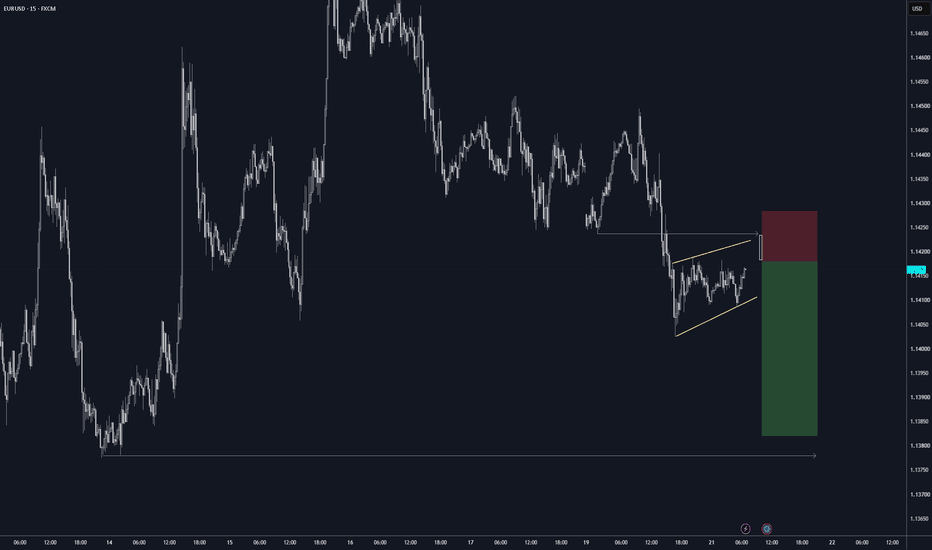
EURUSD- Bullish Bias, Awaiting DiscountThe higher-time-frame outlook remains bullish. Price continues to respect the overall structural map after breaking key higher-high pivots. Along the way, higher-time-frame internal liquidity and the inducement leg were taken before price engineered liquidity and mitigated into major higher-time-frame points of interest, reinforcing the broader bullish narrative.
On the intermediate time frame, price has respected those higher-time-frame areas by breaking lower highs, printing new highs, sweeping internal liquidity, and engineering additional liquidity legs. This expansion has driven price into a key intermediate point of interest, adding further confluence to the existing higher-time-frame bullish structure.
For the upcoming week, I’m looking for sell-side liquidity to be taken before any continuation higher. Ideally, price retraces into the midterm order block beneath the inducement leg, allowing for a deeper mitigation before bullish expansion resumes.
One detail supporting this expectation is the rejection from the recent highs. The wick at the previous high, along with the rejection around the higher-time-frame structural reference (purple level), suggests a bearish retracement may develop before the next bullish move. Even so, this remains a retracement within an overall bullish market structure unless price proves otherwise.
The purple structural levels are plotted to highlight higher-time-frame internal structure and provide additional confluence when tracking potential turning points.
For now, patience remains the priority. I’ll let the market reveal its next move, track the footprints as they develop, and wait for confirmation before considering execution. AUD/JPY- Waiting for Deeper MitigationThe higher-time-frame outlook remains bullish. Price continues to print higher highs and higher lows, reinforcing the overall bullish structure. After sweeping a major external sell-side liquidity pool, price reacted from a higher-time-frame point of interest, providing the foundation for bullish continuation. The subsequent break of the intermediate lower high confirmed the shift in structure and strengthened the bullish narrative.
On the intermediate time frame, price engineered liquidity by first taking an internal inducement before expanding into a larger liquidity pool. Following the structural shift, price established a new high and is now beginning to retrace.
At the moment, I’m waiting for the current intermediate sell-side liquidity to be fully developed into a deeper mitigation. Ideally, I’d like to see price retrace toward the 50% equilibrium or a deeper point of interest before considering bullish continuation.
Price is currently reacting from an order block that could produce an immediate rally. However, because it’s located in a premium area and follows the first liquidity sweep, I view it as a lower-probability reaction. Markets often create traps after the initial liquidity event, so I’m more interested in allowing price to seek deeper discount before looking for stronger confirmation.
The purple levels mark higher-time-frame confluence, while the orange zones identify my primary areas of interest. The middle zone represents the decisional area, and the lower zone represents the extreme point of interest where I’d have the greatest interest if price reaches it.
For now, patience remains the priority. I’ll continue tracking price action and waiting for acceptance within my areas of interest before considering any long positions.
Dogecoin (DOGE/USD) — A Long-Term Elliott Wave Perspective
On the weekly chart, Dogecoin continues to present a potential large-degree five-wave impulse structure.
As with the long-term structures I have previously shared for Bitcoin and Ethereum, DOGE may currently be developing within Wave IV of this larger impulse.
At the aggressive count, Wave IV can be interpreted as a large sideways correction composed of two larger zigzags connected by an intervening wave. This connecting wave itself may take the form of a Triple Zigzag and, from a geometric perspective, shows similarities to an Expanded Diagonal structure.
Within this interpretation, Wave Y is currently developing as a classic Simple Zigzag, and price has already reached the initial targets identified on the chart.
The reaction at the next target zones will now become increasingly important.
A sustained move higher and a confirmed breakout from the corrective channels shown on the chart could provide the first significant evidence that the correction is complete and that the next bullish phase is beginning.
Each channel breakout may provide additional confirmation step by step. However, the reaction following the breakout, the ability of price to hold above the broken structure, and the subsequent development of the bullish pattern will remain important.
A More Conservative Alternative Count
At the same time, a more conservative interpretation must also remain on the table.
In this scenario, the same Expanded Diagonal that is interpreted as Wave X within the aggressive count could instead represent Wave 1 of a higher-degree Wave 5.
If this interpretation is correct, the recent decline could be developing as a Simple Zigzag, forming Wave 2 of a higher-degree Wave 5.
The key condition for this scenario is that the current correction must not move beyond the origin of Wave 1.
As long as that critical low remains intact, the possibility remains that the market is still completing Wave 2 before beginning the next larger advance.
A break above the corrective structure, followed by the development of a sustained bullish move, could then provide confirmation that Wave 2 has completed and that the market is entering Wave 3 of the larger Wave 5.
Two Counts — One Potentially Bullish Path
The interesting aspect of these two interpretations is that both can ultimately lead to a bullish outcome. The primary difference is the degree of the wave count and the position of the current structure within the larger Elliott Wave sequence.
Under the aggressive interpretation, the larger correction may already be approaching completion, allowing the market to transition directly into the next bullish phase.
Under the conservative interpretation, the market may first need to complete Wave 2 of a higher-degree Wave 5. As long as the key Wave 1 low holds, the next advance could then develop as Wave 3.
For now, the key factors to monitor are:
Price reaction at the next target zones;
Confirmed breakouts from the corrective channels;
The preservation of the key Wave 1 origin in the conservative count;
And the development of a valid bullish structure following the breakout.
Until these confirmations appear, patience remains essential.
The market will ultimately reveal which wave count is correct through its structure.
— Mr. Nobody | Elliott Wave Principle
DOGE
Dec 15, 2023
Doge In Strong Bullish Market, Five Wave Up
Long