XAUUSD: Faces Resistance Again — Bears Target 3,980$ SupportHello everyone, here is my breakdown of the current XAUUSD setup.
Market Analysis
XAUUSD previously traded inside a range before breaking lower and developing a broad descending channel, confirming a bearish market structure. After finding support near the 3,980 Support Zone, buyers formed a Double Bottom pattern and pushed price back toward the 4,080 Resistance Zone.
Currently, XAUUSD is trading above the 3,980 Support Zone while remaining below the 4,080 Resistance Zone. A recent fake breakout above the descending channel resistance failed to hold, suggesting sellers are defending the upper boundary once again.
My Scenario & Strategy
As long as XAUUSD remains below the 4,080 Resistance Zone and continues to respect the descending channel resistance, the bearish scenario remains valid. A rejection from current levels could push price back toward the 3,980 Support Zone (TP1).
However, if XAUUSD secures a confirmed breakout above the descending channel and the 4,080 Resistance Zone, the bearish outlook would weaken and buyers could extend the recovery.
That’s the setup I’m tracking. Thank you for your attention, and always manage your risk.  Short
Short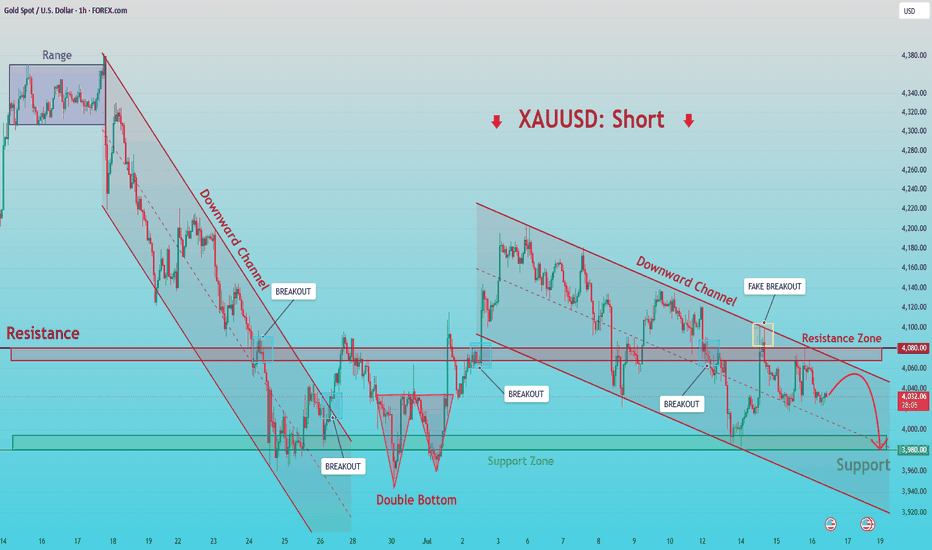
BTCUSDT: Rejected at 64.8K Signals Potential Drop to SupportHello everyone, here is my breakdown of the current BTCUSDT setup.
Market Analysis
BTCUSDT previously traded inside a broad descending channel before breaking above the upper boundary, confirming a bullish shift in market structure. Price later continued higher while respecting a rising triangle support line, but the latest rally failed after a fake breakout above the 64,800 Resistance Zone, signaling that sellers are defending this area.
Currently, BTCUSDT is trading above the 62,600 Support Zone while remaining below the 64,800 Resistance Zone. The failed breakout suggests bullish momentum is weakening as price approaches a key resistance.
My Scenario & Strategy
As long as BTCUSDT remains below the 64,800 Resistance Zone and fails to reclaim the breakout, the bearish scenario remains valid. A rejection from current levels could push price back toward the 62,600 Support Zone (TP1).
However, if BTCUSDT secures a confirmed breakout above the 64,800 Resistance Zone, the bearish outlook would weaken and buyers could extend the recovery.
That’s the setup I’m tracking. Thank you for your attention, and always manage your risk.  Short
Short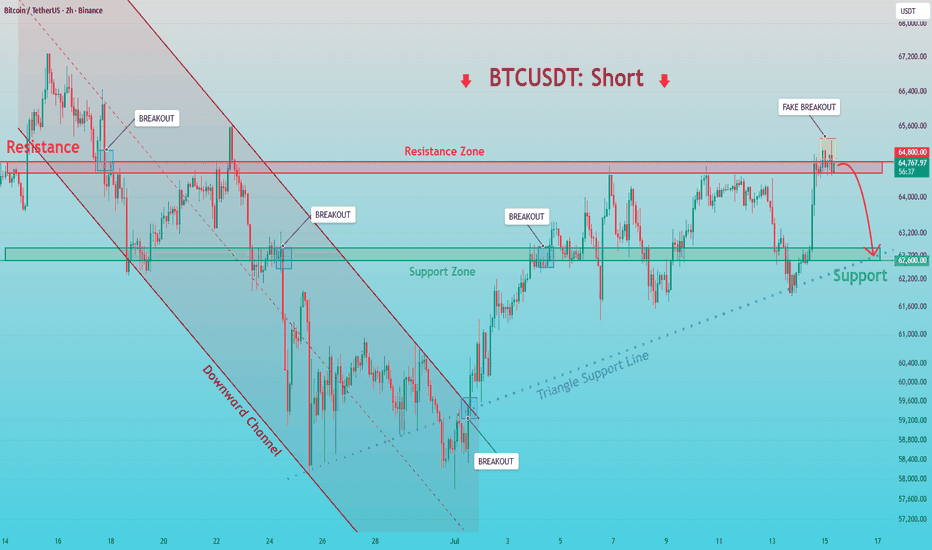
Bitcoin Sellers Defend $63,500 Resistance — $61,000 in FocusHello traders! Here’s my technical outlook based on the current BTCUSDT (4H) chart structure. BTCUSDT previously traded inside a broad descending channel while repeatedly reacting between the 61,000 Buyer Zone and 63,500 Seller Zone. After recovering from the lower channel support, price formed a rising structure but was recently rejected near the channel resistance. Currently, BTCUSDT is trading above the 61,000 Buyer Zone while remaining below the 63,500 Seller Zone. The recent breakdown below the rising support line suggests weakening bullish momentum and increasing selling pressure. As long as BTCUSDT remains below the 63,500 Seller Zone, the bearish scenario remains valid. A rejection from current levels could push price back toward the 61,000 Buyer Zone (TP1), where buyers may attempt to regain control. Please share this idea with your friends and click "Boost" 🚀 Short 
GOLD - The hunt for liquidity before the fall to 3900...FX:XAUUSD has completely unwound the bullish momentum generated by the recent news and has printed fresh local lows. The market remains in both a local and broader bearish trend, driven by persistent fundamental and geopolitical uncertainty
Gold continues to trade under pressure, with sellers firmly in control. The next key catalysts will be the U.S. Consumer Sentiment and Inflation Expectations reports. The technical outlook remains bearish, with price making new local lows while still holding above the key 3960 support area. Before the broader decline resumes, the market may enter a liquidity sweep phase, with downside potential extending toward 3940–3900.
Bearish drivers: Escalation of geopolitical tensions, Rising oil prices and a stronger U.S. dollar, Hawkish Federal Reserve rhetoric, Strong U.S. economic data
Bullish drivers: Geopolitical de-escalation, Weaker-than-expected consumer sentiment data, End-of-week profit-taking
Resistance levels: 4028, 4043, 4065
Support levels: 3960, 3943
The U.S. dollar remains in a strong bullish trend, reinforcing the bearish outlook for gold. Technically, the market is developing a breakout structure around the 3960–3940 support zone. A sustained break and close below this area could trigger another leg lower.
However, before the next sell-off, a short squeeze toward the 4028–4065 resistance zone remains possible. A false breakout of this area could attract fresh selling pressure and accelerate the broader downtrend
Best regards,
R. Linda Short 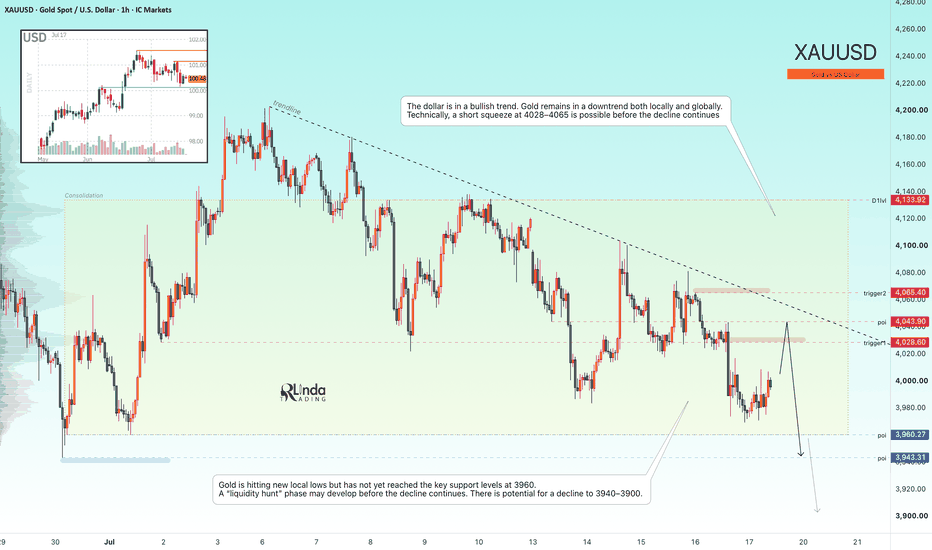
BITCOIN - A false breakout of resistance in a bear market BINANCE:BTCUSDT.P is forming a retest of the key 64,500 resistance level as part of a countertrend correction, trapping late buyers while the market remains in a liquidity sweep phase
The broader trend remains bearish. Unstable ETF flows, the lack of meaningful fundamental support, and ongoing geopolitical uncertainty continue to weigh on the market.
Within the broader bear market, the market maker has swept liquidity above 64,500 before pushing price back into the trading range. Bitcoin remains in a 62,000–65,000 consolidation zone, while the higher-timeframe trend continues to point lower. A short squeeze into the resistance area could trigger another sell-off toward the 60K–50K region
Resistance levels: 64,450, 64,700, 65,600
Support levels: 62,750, 61,300
A retest of the liquidity pool above 64,450 may attract renewed selling pressure. If bears successfully defend this key resistance zone, it would further confirm the prevailing bearish market structure and increase the probability of a decline toward 62,750 and 61,300
Best regards,
R. Linda Short 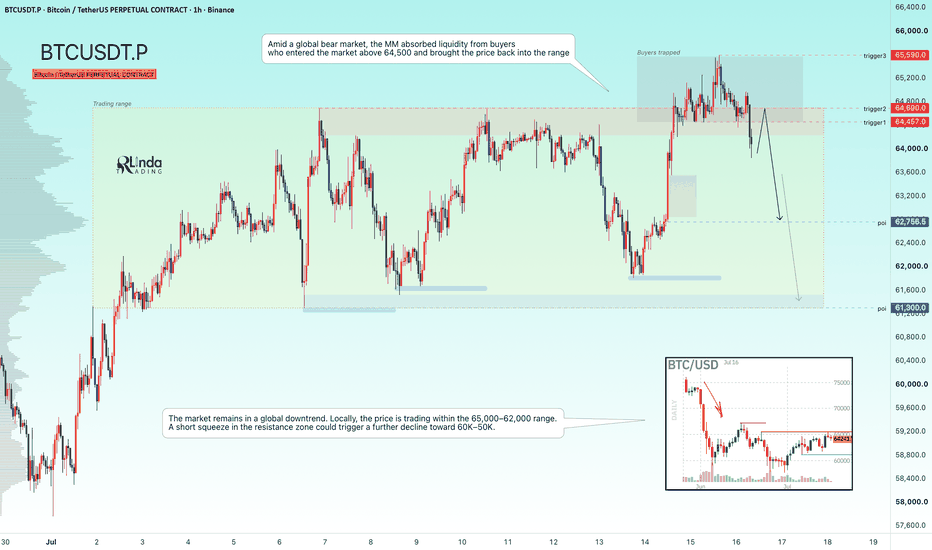
GOLD - Anticipating a short squeeze before the decline continuesICMARKETS:XAUUSD experienced a short squeeze around the key liquidity zone following Tuesday's CPI release. However, the market quickly regained its bearish momentum and resumed selling in line with the prevailing trend
The U.S. dollar remains in consolidation, as does the broader market, but the Dollar Index (DXY) continues to maintain its broader bullish trend, keeping pressure on gold. The lack of fundamental support, combined with ongoing geopolitical tensions, continues to favor the bears. The escalation of the U.S.–Iran conflict in the Strait of Hormuz remains a key source of uncertainty
Gold is still under pressure, with sellers maintaining control and using every rebound as an opportunity to initiate new short positions. The next major catalysts will be the U.S. Producer Price Index (PPI) and speeches from Federal Reserve officials, including Warsh. The daily technical structure remains bearish.
Bearish drivers : Escalation of the geopolitical conflict, Higher oil prices, Hawkish Fed rhetoric, Technical sell-on-rallies
Bullish drivers : Geopolitical de-escalation, Weaker-than-expected inflation data (including PPI), Dovish Fed commentary
Resistance levels: 4062, 4103
Support levels: 4021, 3986, 3960
Technically, gold is testing the 4021 intermediate support level. A local false breakdown could trigger a countertrend rebound toward the 4062 resistance zone to sweep liquidity before the broader downtrend resumes toward 3986–3960
Best regards,
R. Linda Short 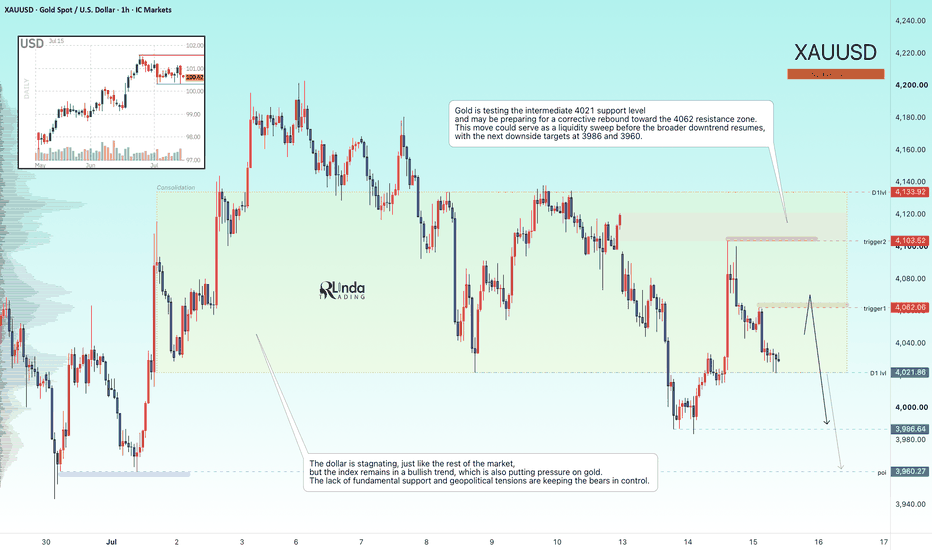
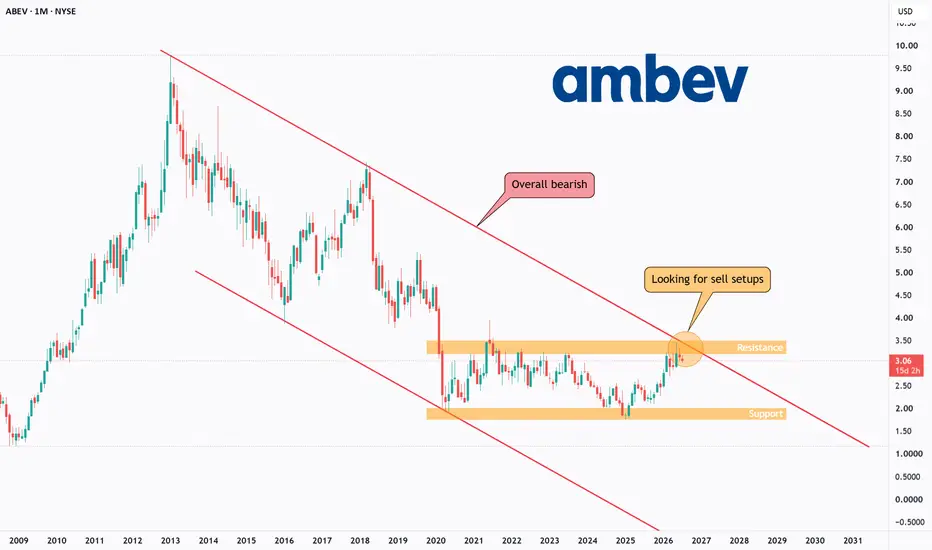
ABEV - Bearish Trend Faces a Major Test!ABEV (Ambev S.A.) is one of the largest beverage companies in Latin America, producing and distributing well-known beer, soft drink, and beverage brands across the region. The stock has attracted long-term investors due to its strong market position and defensive business model.
From a technical perspective, ABEV remains overall bearish, continuing to trade inside the red descending channel that has guided price action over the longer term.
Over the past few years, price has been consolidating inside the orange trading range and has now reached an important technical area where the upper boundary of the descending channel aligns with the range resistance.
⭕This confluence creates an attractive area to monitor for sell setups on lower timeframes, particularly if price shows signs of rejection from the current resistance.
⭕However, if buyers manage to break above both the range resistance and the descending channel, it could provide the first strong indication that the long-term bearish trend is losing control and that a broader bullish reversal may be beginning.
The reaction around this technical zone may determine whether sellers can maintain control of the broader trend, or if buyers are preparing to shift the long-term market structure.
⚠️ Disclaimer: This analysis reflects my personal market view and is not financial advice.
Rayan Nasser
#ABEV #Stocks #Investing #TechnicalAnalysis #PriceAction #MarketStructure #TrendAnalysis  Short
Short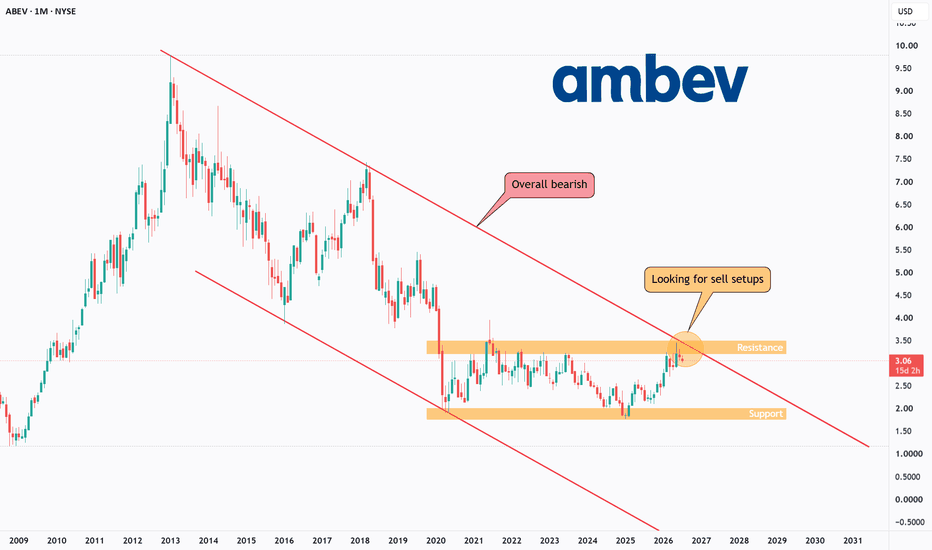
DOGECOIN [$DOGE] ELLIOTT WAVE CRYPTO ANALYSIS WEEKLY TFDOGE appears to be approaching the final stages of a multi-year correction, with price now testing a major confluence of long-term support.
From an Elliott Wave perspective, the explosive five-wave advance into the 2021 peak was followed by a complex A-B-C correction that has gradually retraced much of the previous bull market. The current decline is now approaching the macro Golden Zone Long at 3¢, where multiple technical support levels converge.
While bearish momentum remains intact in the short term, the broader structure suggests the correction may be entering its final phase. A successful defence of the current support region would complete the higher-degree Wave (4) and set the stage for the next impulsive advance.
If buyers regain control, the focus shifts back toward the previous cycle high before opening the door to substantially higher prices as Wave (5) unfolds. Until then, patience remains key, as the market still needs to confirm that a durable bottom has formed.
As long as the macro support zone at 3¢ holds, the larger bullish outlook remains intact. A decisive break below it, however, would force a reassessment of the current wave count.
Not financial advice. Like and follow for more Elliott Wave and macro crypto analysis.  Long
Long
Gold Continues to Respect the Descending Channel, Aim 3,940$Hello traders! Here’s my technical outlook based on the current XAUUSD (3H) chart structure. XAUUSD previously traded inside a broad range before breaking above resistance, but the breakout failed near the 4,100 Seller Zone, where sellers regained control. Price then formed a descending channel, confirming a renewed bearish structure. Currently, XAUUSD is trading above the 3,940 Buyer Zone while remaining below the 4,100 Seller Zone. Price continues to respect the channel resistance, suggesting bearish momentum remains in control. As long as XAUUSD stays below the 4,100 Seller Zone and respects the descending channel resistance, the bearish scenario remains valid. A rejection from current levels could push price toward the 3,940 Buyer Zone (TP1), where buyers may attempt to defend support. Please share this idea with your friends and click "Boost" 🚀 Short 
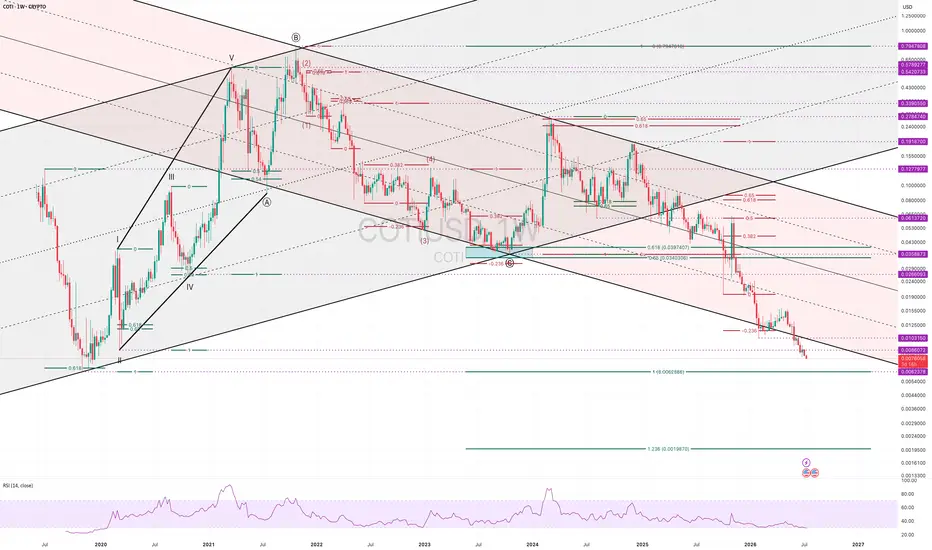
CURRENCY OF THE INTERNET [$COTI] Weekly TF EWP Crypto AnalysisCOTI continues to follow the bearish roadmap outlined in my previous analysis.
From an Elliott Wave perspective, the cycle began with a five-wave expanding leading diagonal that completed before transitioning into an expanded flat. As anticipated, the correction found support in the macro Golden Zone Long, from which price rallied impulsively into the Golden Zone Short, where the bear trend resumed.
The most important development is not simply the decline itself, but the sequence of technical failures. Price first broke below the bullish channel, signalling that the preceding advance had likely ended. It has now also broken beneath the bearish corrective channel, suggesting the decline is no longer behaving as a simple ABC correction but is instead unfolding as a larger impulsive move.
As long as price remains below the broken channel and key resistance levels, the trend remains decisively bearish. The $0.0062 support is now the last major technical level before the chart opens the door to a much deeper decline, with the $0.002 region emerging as the next significant long-term downside objective.
Only a sustained recovery back above the broken channel would weaken this bearish outlook. Until then, counter-trend rallies should be treated as corrective bounces within an ongoing downtrend.
Not financial advice. Like and follow for more Elliott Wave and macro crypto analysis.
 Short
Short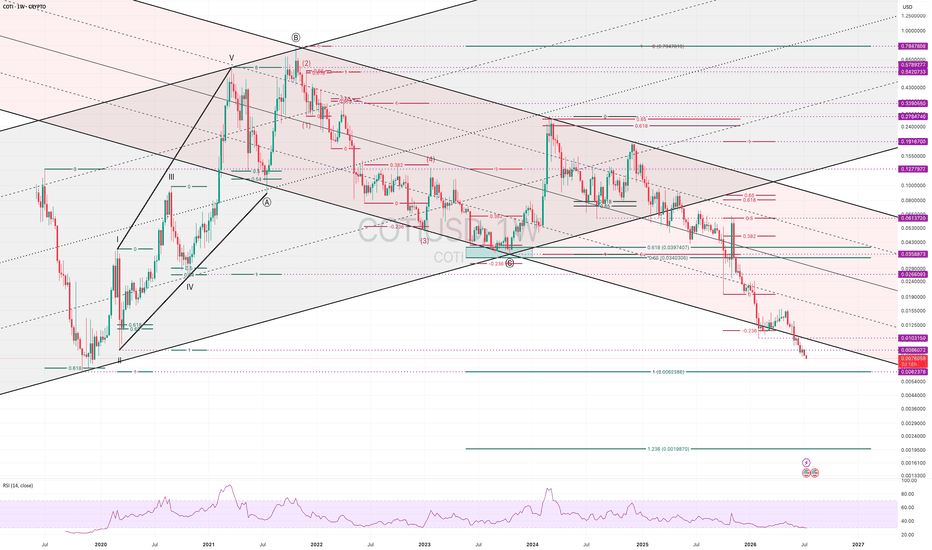
 Long
Long
XAUUSD (H1) | PPI Tonight: Relief Rally or Bearish Continuation?Gold is trading defensively ahead of today's U.S. Producer Price Index (PPI), one of the final inflation indicators before the market fully reprices Federal Reserve expectations. Following the softer CPI report, investors will watch whether producer inflation also eases. A weaker-than-expected PPI could reinforce expectations for Fed rate cuts later this year, weighing on the U.S. Dollar and supporting gold. Conversely, a stronger PPI would likely revive inflation concerns, push Treasury yields higher, and pressure non-yielding assets like gold.
Current Bias: Bearish while price remains below the descending channel resistance.
Institutional Supply: 4048–4055
A rejection from this premium supply area could provide fresh sell-side opportunities.
Immediate Resistance: 4038–4042
Recent mitigation zone where sellers have regained control.
Major Liquidity Target: 3960–3968
Institutional demand and external sell-side liquidity resting near the lower channel boundary.
ICT Market Scenarios
🟢 Bullish Scenario
If today's PPI prints below expectations and buyers reclaim 4045–4050 with an H1 close above the descending trendline, price may invalidate the current bearish sequence and expand toward the next institutional supply.
🔴 Bearish Scenario (Preferred)
If price fails to break above the mitigation supply around 4048–4055, expect another liquidity delivery toward 3985, followed by a possible sweep into the 3960–3968 demand zone.
Key Levels
Bias: Bearish below 4048–4055
Resistance: 4038–4042 / 4048–4055
Support: 3985
Major Demand: 3960–3968
Risk Note: PPI is a high-impact inflation release that often generates sharp volatility and liquidity sweeps. Waiting for confirmation after the initial reaction can help avoid false breakouts.
Market Debate
Did yesterday's softer CPI create a true bullish reversal, or was it simply a liquidity grab before tonight's PPI determines the next directional move? Short 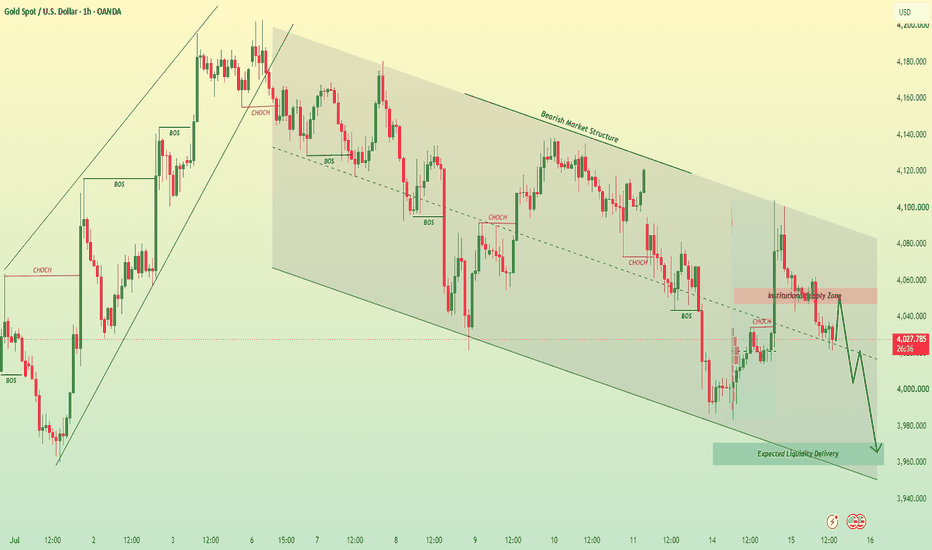
BONFIDA [$FIDA] Weekly TF EWP Crypto Analysis FIB TCBonfida (FIDA) | Is the Final Capitulation Still Ahead?
Bonfida has spent nearly five years trapped in a relentless bear market, carving out a well-defined descending channel since its 2021 all-time high. While the macro trend remains decisively bearish, the current Elliott Wave count suggests the correction may be approaching its final chapter.
The preferred scenario views the initial collapse as a completed five-wave impulse, followed by an A-B-C corrective rally. From the 2024 high, price appears to be unfolding another impulsive decline, with the current rebound representing a potential Wave (2) of the final Wave 5 within Wave C. If this interpretation is correct, one last sell-off could complete the entire bearish structure near the psychological $0.01 level, where the lower boundary of the long-term channel also converges.
With only five years of trading history, precision is naturally limited, and alternate counts remain possible. For that reason, the one-cent region should be viewed as a high-probability accumulation zone rather than an exact price target. Markets rarely ring a bell at the bottom, and a brief overshoot below support would not invalidate the broader thesis.
As always, confirmation will come from price, not prediction. Until the descending channel is decisively broken, the long-term trend remains bearish. However, should the final capitulation unfold as anticipated, the risk-to-reward profile could become increasingly attractive for investors willing to speculate on the next crypto cycle.
This analysis reflects my preferred Elliott Wave scenario and should be considered one possible roadmap rather than a certainty. Manage risk accordingly.
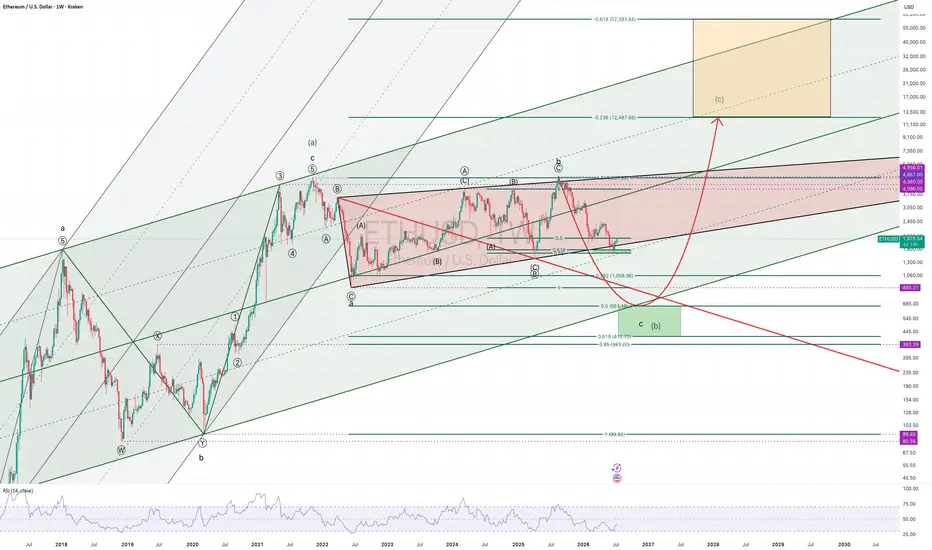
Not financial advice. Like and follow for more Elliott Wave and macro crypto analysis. ETHEREUM [$ETH] ELLIOTT WAVE CRYPTO ANALYSIS WEEKLY TFEthereum: A High-Confluence Setup at a Multi-Year Decision Point
Ethereum has reached what I believe is one of the most important technical inflection points of this cycle.
My primary Elliott Wave count suggests that the market is completing a complex multi-year corrective structure rather than beginning a new secular bear market. The current decline is approaching a major confluence zone where long-term channel support, the 0.5-0.618 Fibonacci retracement, and structural price support converge.
Adding further weight to this scenario is the presence of a bullish Wolfe Wave. While Elliott Wave remains the foundation of this analysis, the Wolfe Wave provides an independent geometric framework that points toward a similar reversal area. When different methodologies arrive at the same conclusion, I tend to pay attention.
The key question now is whether the decline from the August 2025 high is corrective or impulsive.
My preferred interpretation is that it is impulsive, favouring one final capitulation into the highlighted support zone around the $700 region before the larger bullish sequence begins. This remains the primary count unless price action proves otherwise.
An alternative scenario still exists. Ethereum could continue developing a large triangle, eventually producing a third test of the $4,900 resistance area before completing the correction. While this remains technically valid, I currently assign it a lower probability, as the decline appears to possess impulsive characteristics rather than the overlapping structure typically associated with triangles.
Should the preferred count unfold, the completion of wave (b) would open the door to a powerful wave (c) advance.
As always with Elliott Wave, the final upside target cannot be defined with precision this early. A normal fifth wave could terminate near the 0.236 Fibonacci extension around $12,500, while an extended fifth wave—something far from unusual in cryptocurrencies—could continue toward the 0.618 extension, currently projected near $57,000. The long-term ascending channel provides the dynamic framework for these objectives, meaning the ultimate target will evolve as the trend develops.
For now, the focus is not on the final destination but on whether Ethereum can complete this correction within the highlighted support region. If that happens, the risk-to-reward profile could become exceptionally attractive for long-term investors.
As always, Elliott Wave analysis is a probabilistic framework rather than a prediction. This is my preferred count, supported by Fibonacci confluence, long-term channel geometry, and a bullish Wolfe Wave. If future price action invalidates this scenario, the alternative count will take precedence.
Not financial advice. Like and follow for more Elliott Wave and macro crypto analysis.  Long
Long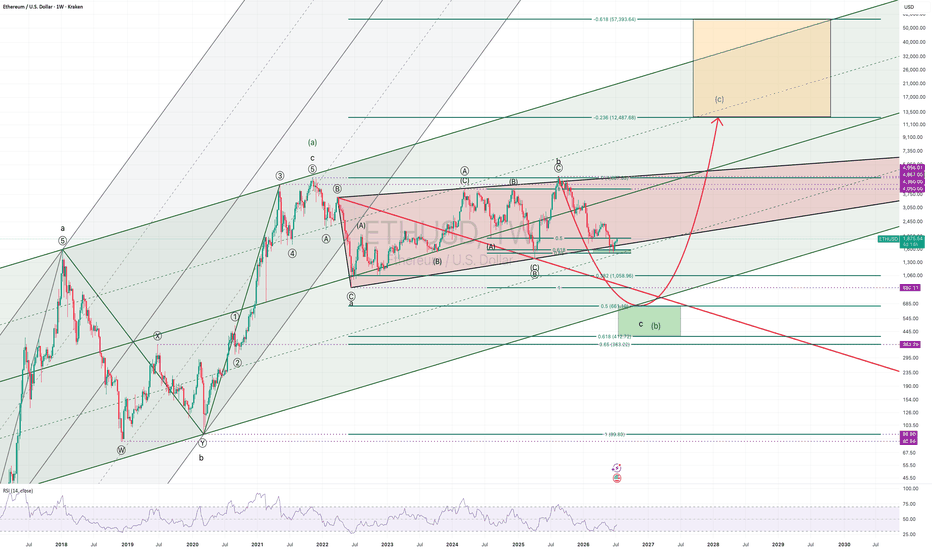
USDCAD - From consolidation to downward distributionFX:USDCAD is forming a reversal pattern following its recent strong rally. The market appears to be transitioning from a consolidation phase into a distribution phase
The U.S. dollar has entered a period of consolidation, while the Canadian dollar is beginning to strengthen, putting additional pressure on the pair.
After the strong advance, USDCAD moved into a 1.4150–1.4250 trading range. Instead of continuing higher, price is now showing signs of a reversal. Buyer participation may lead to a distribution phase, with the market potentially moving lower to fill the existing fair value gap (FVG)
Resistance levels: 1.4150, 1.4177
Support levels: 1.4092, 1.4024
Technically, after breaking below the consolidation support, bears are attempting to keep the price below the 1.4150 range boundary. As long as this level remains under sellers' control, the market may continue its decline toward 1.4092 and 1.4024
Best regards,
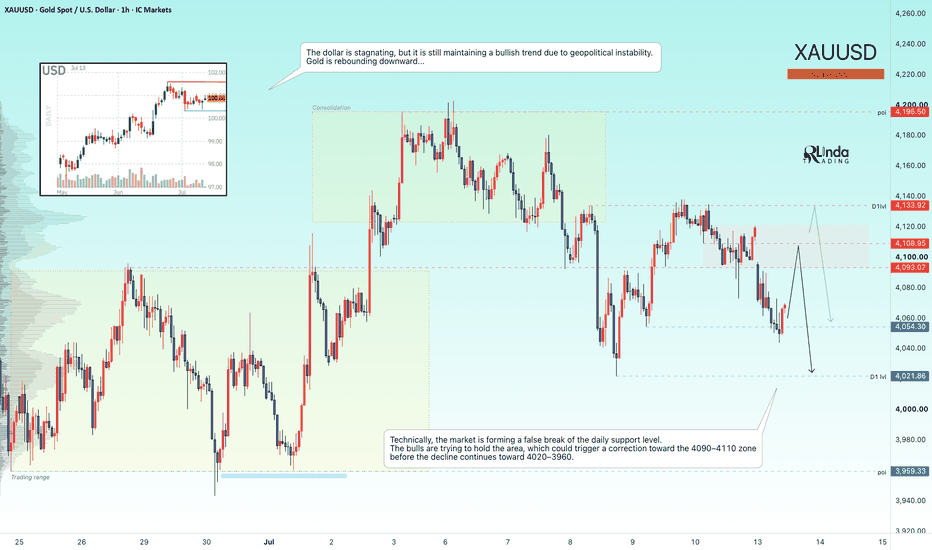
R. Linda GOLD - A countertrend correction before a decline FX:XAUUSD has reversed lower from the 4120–4133 resistance zone—exactly the scenario we had been anticipating since the end of last week—and is now testing the 4050 support area while forming a false breakout. The fundamental and geopolitical backdrop remains weak, suggesting that the broader decline may continue
Gold fell sharply on Monday, breaking below the $4100 level as renewed tensions in the Middle East boosted the U.S. dollar. Although the dollar is currently consolidating, it remains in a broader bullish trend, supported by ongoing geopolitical uncertainty. The overall market remains under bearish pressure, with the technical outlook still negative. The next major catalysts will be the U.S. CPI report, Fed Chair Warsh's speech, and further developments in the Middle East.
Drivers:
Bearish for gold: Escalation of the conflict (strengthening the U.S. dollar while pushing oil prices and inflation higher), Hawkish Fed signals, Strong U.S. inflation data
Bullish for gold: Geopolitical de-escalation, Weaker-than-expected CPI data, Dovish comments from Warsh
Resistance levels: 4093, 4108, 4133
Support levels: 4054, 4021
Technically, the market is forming a false breakout below the daily support level. Bulls are attempting to defend the area, which could trigger a corrective rebound toward the 4090–4110 interest zone before the broader downtrend resumes toward 4020–3960
Best regards,
R. Linda Short