ETHEREUM [$ETH] ELLIOTT WAVE CRYPTO ANALYSIS WEEKLY TFEthereum: A High-Confluence Setup at a Multi-Year Decision Point
Ethereum has reached what I believe is one of the most important technical inflection points of this cycle.
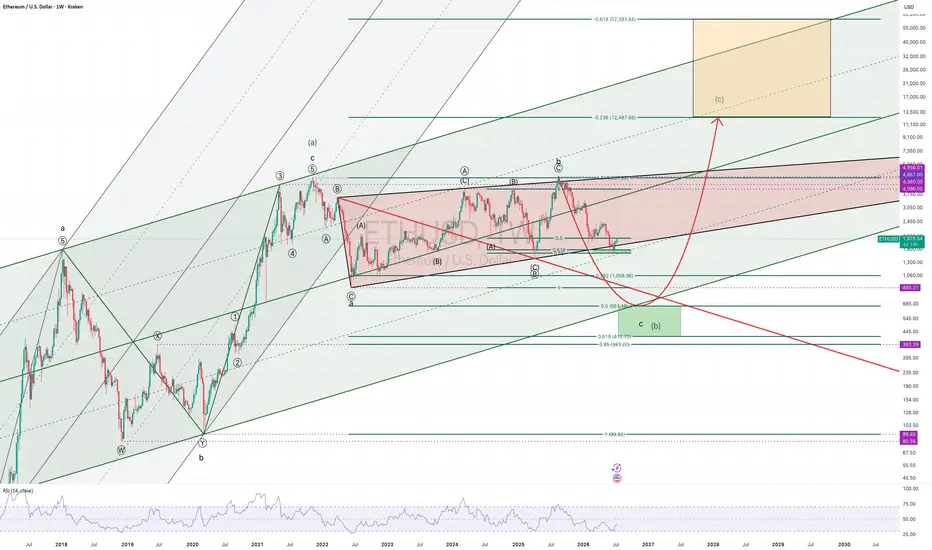
My primary Elliott Wave count suggests that the market is completing a complex multi-year corrective structure rather than beginning a new secular bear market. The current decline is approaching a major confluence zone where long-term channel support, the 0.5-0.618 Fibonacci retracement, and structural price support converge.
Adding further weight to this scenario is the presence of a bullish Wolfe Wave. While Elliott Wave remains the foundation of this analysis, the Wolfe Wave provides an independent geometric framework that points toward a similar reversal area. When different methodologies arrive at the same conclusion, I tend to pay attention.
The key question now is whether the decline from the August 2025 high is corrective or impulsive.
My preferred interpretation is that it is impulsive, favouring one final capitulation into the highlighted support zone around the $700 region before the larger bullish sequence begins. This remains the primary count unless price action proves otherwise.
An alternative scenario still exists. Ethereum could continue developing a large triangle, eventually producing a third test of the $4,900 resistance area before completing the correction. While this remains technically valid, I currently assign it a lower probability, as the decline appears to possess impulsive characteristics rather than the overlapping structure typically associated with triangles.
Should the preferred count unfold, the completion of wave (b) would open the door to a powerful wave (c) advance.
As always with Elliott Wave, the final upside target cannot be defined with precision this early. A normal fifth wave could terminate near the 0.236 Fibonacci extension around $12,500, while an extended fifth wave—something far from unusual in cryptocurrencies—could continue toward the 0.618 extension, currently projected near $57,000. The long-term ascending channel provides the dynamic framework for these objectives, meaning the ultimate target will evolve as the trend develops.
For now, the focus is not on the final destination but on whether Ethereum can complete this correction within the highlighted support region. If that happens, the risk-to-reward profile could become exceptionally attractive for long-term investors.
As always, Elliott Wave analysis is a probabilistic framework rather than a prediction. This is my preferred count, supported by Fibonacci confluence, long-term channel geometry, and a bullish Wolfe Wave. If future price action invalidates this scenario, the alternative count will take precedence.
Not financial advice. Like and follow for more Elliott Wave and macro crypto analysis.  Long
Long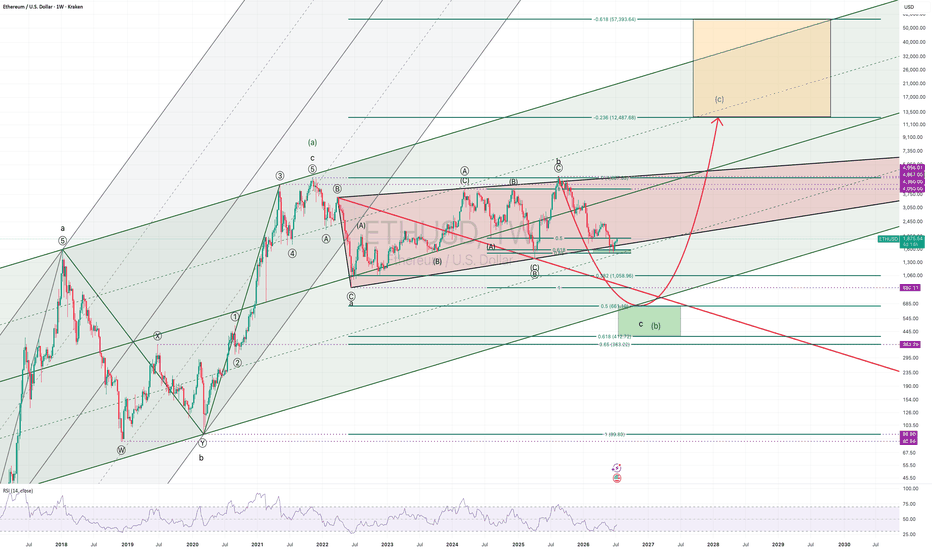
USDCAD - From consolidation to downward distributionFX:USDCAD is forming a reversal pattern following its recent strong rally. The market appears to be transitioning from a consolidation phase into a distribution phase
The U.S. dollar has entered a period of consolidation, while the Canadian dollar is beginning to strengthen, putting additional pressure on the pair.
After the strong advance, USDCAD moved into a 1.4150–1.4250 trading range. Instead of continuing higher, price is now showing signs of a reversal. Buyer participation may lead to a distribution phase, with the market potentially moving lower to fill the existing fair value gap (FVG)
Resistance levels: 1.4150, 1.4177
Support levels: 1.4092, 1.4024
Technically, after breaking below the consolidation support, bears are attempting to keep the price below the 1.4150 range boundary. As long as this level remains under sellers' control, the market may continue its decline toward 1.4092 and 1.4024
Best regards,
R. Linda GOLD - A countertrend correction before a decline FX:XAUUSD has reversed lower from the 4120–4133 resistance zone—exactly the scenario we had been anticipating since the end of last week—and is now testing the 4050 support area while forming a false breakout. The fundamental and geopolitical backdrop remains weak, suggesting that the broader decline may continue
Gold fell sharply on Monday, breaking below the $4100 level as renewed tensions in the Middle East boosted the U.S. dollar. Although the dollar is currently consolidating, it remains in a broader bullish trend, supported by ongoing geopolitical uncertainty. The overall market remains under bearish pressure, with the technical outlook still negative. The next major catalysts will be the U.S. CPI report, Fed Chair Warsh's speech, and further developments in the Middle East.
Drivers:
Bearish for gold: Escalation of the conflict (strengthening the U.S. dollar while pushing oil prices and inflation higher), Hawkish Fed signals, Strong U.S. inflation data
Bullish for gold: Geopolitical de-escalation, Weaker-than-expected CPI data, Dovish comments from Warsh
Resistance levels: 4093, 4108, 4133
Support levels: 4054, 4021
Technically, the market is forming a false breakout below the daily support level. Bulls are attempting to defend the area, which could trigger a corrective rebound toward the 4090–4110 interest zone before the broader downtrend resumes toward 4020–3960
Best regards,
R. Linda  Short
Short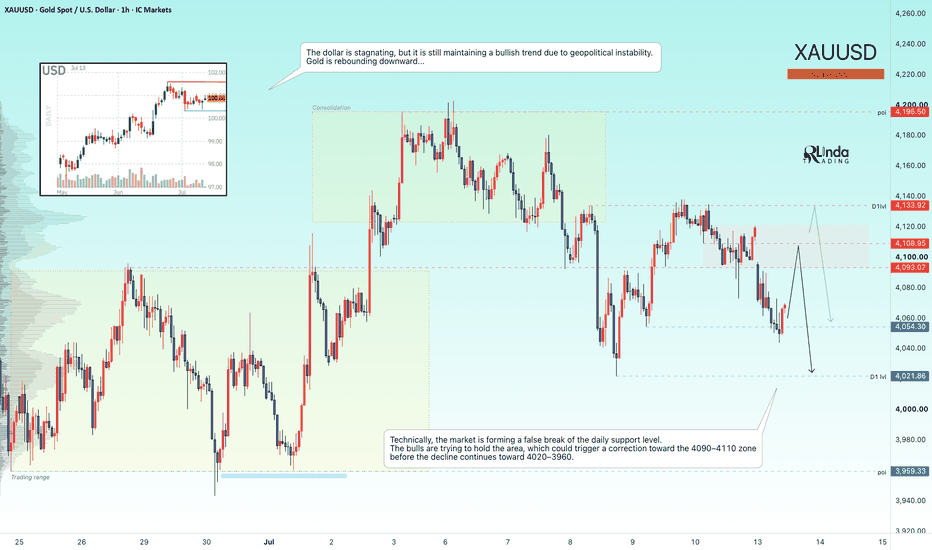
DXY: Consolidation, Liquidity Hunts, and the Next Macro MoveHi!
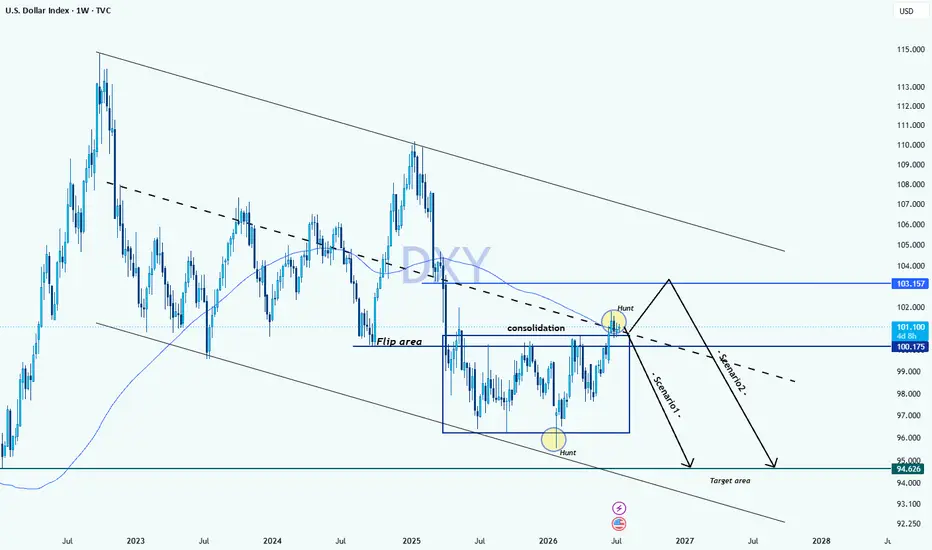
The US Dollar Index (DXY) is sitting at a critical macro inflection point on the weekly chart, currently trading around 101.109. After breaking down below a massive weekly support level (now acting as a Flip Area around 100.175), the index has entered a prolonged consolidation phase right in the middle of a major descending channel.
What makes the current price action highly interesting is the clear liquidity hunt on both sides of this range. We saw a clean sweep of the range lows near 96.00, followed by a recent aggressive push to hunt the buy-side liquidity above the range highs around 101.20.
With the liquidity cleared on both ends, DXY is gearing up for its next directional leg. Here are the two primary structural scenarios playing out.
Scenario 1: Direct Rejection & Drop (Immediate Bearish Continuation)
The Setup: The recent upward push is treated purely as a fakeout/liquidity hunt to grab stop-losses above the consolidation range.
Price Action: Price fails to sustain any weekly closes above the current level and immediately starts breaking back inside the range.
Target: A direct structural sell-off heading down toward the macro Target Area at 94.626, aligning perfectly with the lower boundary of the descending channel.
Scenario 2: Extended Pullback to Supply before Drop
The Setup: Instead of an immediate sell-off, DXY builds enough short-term momentum from the liquidity sweep to fuel a deeper corrective rally.
Price Action: Price extends upward to test the major overhead Supply & Demand (S&D) zone at 103.157, which lines up with previous structural breakdowns.
Target: After tapping this strong macro supply zone and mitigating resting orders, the index experiences a heavy rejection, ultimately dropping back down to fulfill the final 94.626 macro target.
I’m excited to announce that I’m now a Brand Ambassador for AvaTrade!  Short
Short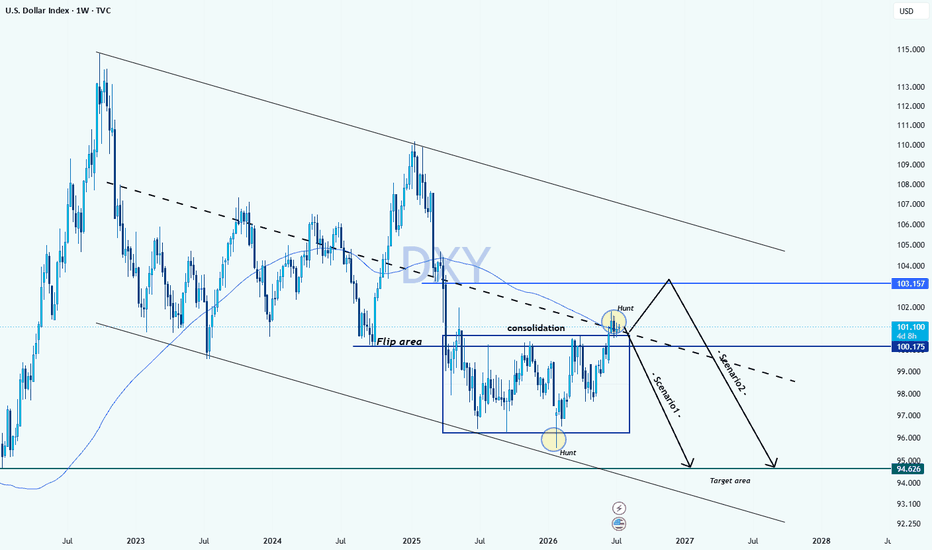
Short 
XAUUSD: Fake Breakout Signals Fresh Bearish Pressure, Aim 3,980$Hello everyone, here is my breakdown of the current XAUUSD setup.
Market Analysis
XAUUSD previously traded inside a broad descending channel before forming a Rounding Top, confirming a bearish continuation. After breaking below the triangle support, price accelerated lower and later found support near the 3,980 Support Zone.
Currently, XAUUSD is trading above the 3,980 Support Zone while remaining below the 4,150 Resistance Zone. A recent fake breakout above the descending trendline failed to attract buyers, suggesting sellers remain in control.
My Scenario & Strategy
As long as XAUUSD remains below the 4,150 Resistance Zone and continues to respect the descending trendline, the bearish scenario remains valid. A rejection from current levels could push price back toward the 3,980 Support Zone (TP1).
However, if XAUUSD breaks above the descending trendline and secures a move above the 4,150 Resistance Zone, the bearish outlook would weaken and a stronger bullish recovery could develop.
That’s the setup I’m tracking. Thank you for your attention, and always manage your risk. Short 
Long 
Short 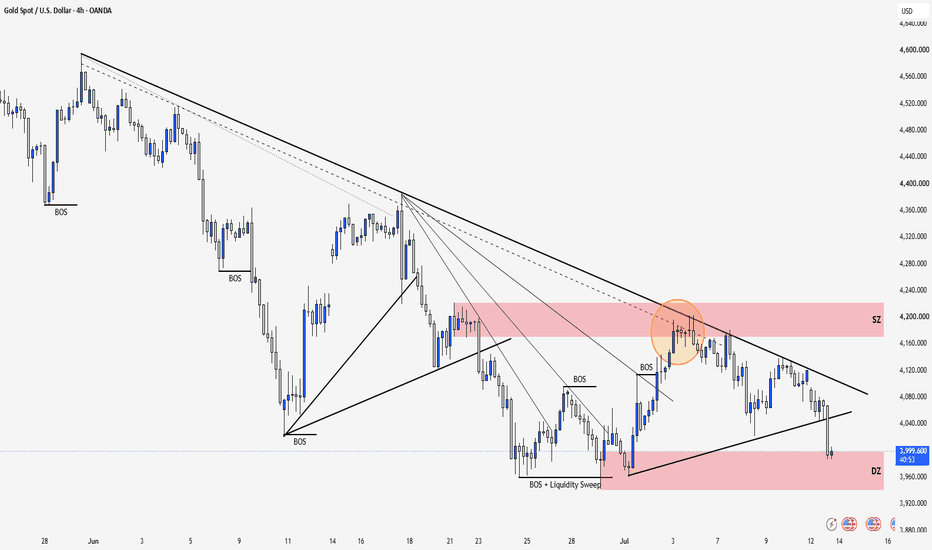
 Long
Long
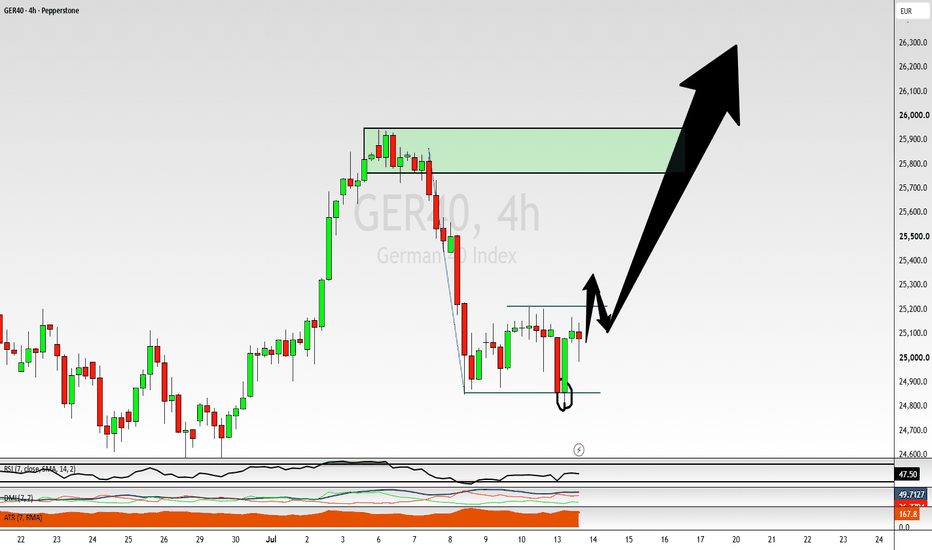
DAX : Buying the Pullback Instead of Chasing All-TimLast week, the DAX pushed into fresh all-time highs, and I warned against becoming the trader who buys at the most expensive price just before the market finally decides to pull back. Instead of chasing strength, the goal was to wait for price to give us some relief and look for an opportunity to enter at a more favorable level.
Thanks to the bearish Butterfly pattern, we were able to do exactly that — identifying a potential reversal zone and waiting for price to retrace into an area where buyers could step back in. Now, the DAX is showing some encouraging signs, with multiple bullish candles forming and suggesting that this may be the level where the retracement finds support.
For confirmation, I’d like to see price break and close above the current sideways consolidation channel, signaling that buyers are regaining control.
Because the broader trend remains strongly bullish, a conservative target would be a retest of the previous all-time highs. However, given the strength of the overall trend, I would want to maintain some exposure to the possibility of a continuation move higher if momentum carries the market beyond those previous highs.
Please leave any questions, comments or share your ideas below
Akil  Long
Long
NAUFF - Four Confluences at One Critical Support Zone!NAUFF remains within its broader bullish structure , while the ongoing correction has brought price into one of the most technically significant areas on the chart.🎯
At the same time, OTC:NAUFF continues advancing its Limousine Butte Gold-Antimony Project in Nevada through an active drilling program, while antimony continues receiving increased strategic attention across the United States.🌎
📌From a technical perspective, NAUFF is currently retesting a potential support zone formed by the intersection of four major confluences:
1️⃣ The 100 SMA , acting as dynamic support.
2️⃣ The lower bound of the rising green channel, acting as non-horizontal support .
3️⃣ The 0.618 Fibonacci retracement , commonly known as the golden ratio.
4️⃣ The lower boundary of the red corrective channel.
📌 These four technical factors are meeting around the area marked by the blue circle, making it an important decision zone for the stock’s next directional move.
As long as this intersection continues to hold, the broader bullish bias remains intact, and we will be looking for trend-following long setups .🐂
A confirmed bullish reaction from this area could signal that the current correction is approaching completion and that a new impulsive movement may be developing.
However , the corrective structure has not yet been fully invalidated.
📊 For the bulls to regain stronger short-term control, price would first need to break and close above the upper boundary of the red corrective channel.
Such a breakout would increase the probability of a move toward the previous major high.
A decisive break above the previous all-time high would then be required before NAUFF could officially return to price discovery.📈
📌From a fundamental perspective, the broader U.S. antimony narrative continues to strengthen.
The U.S. Export-Import Bank’s approval of a US$2.9 billion senior secured loan for Perpetua Resources’ Stibnite project, subject to definitive documentation and customary closing conditions, reflects the growing strategic focus on developing a secure domestic antimony supply chain.
For NevGold, this sector-wide attention is relevant as the company continues advancing its near-surface antimony-gold opportunity at Limousine Butte through a 20,000-meter drill program focused on resource conversion, expansion, and new discoveries.🏗️
The company also completed an upsized financing for gross proceeds of approximately C$42.2 million, with the stated intention of supporting work at its projects, working capital, and general corporate purposes.
These developments do not guarantee a positive market outcome, but they provide a relevant fundamental backdrop while the chart tests a technically significant support area.⚠️
In brief, NAUFF remains technically constructive as long as the four-confluence support zone holds.
A breakout above the red corrective channel would provide additional confirmation that bullish momentum may be returning, while a decisive break above the previous all-time high would open the door to renewed price discovery. 📈
⚠️Disclaimer: This analysis is provided for informational and educational purposes only. It does not constitute financial advice, investment advice, or a recommendation to buy or sell any security. Technical and fundamental conditions can change, and no outcome is guaranteed. Always conduct your own research and manage risk appropriately.
Good luck!
All Strategies Are Good; If Managed Properly!
~Richard Nasr  Long
Long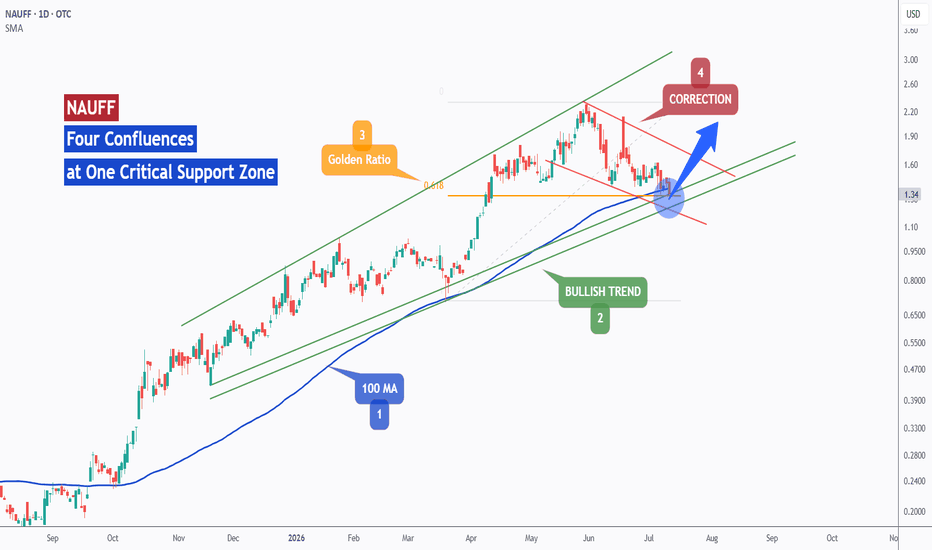
AUDNZD - Bullish Momentum Faces a Critical Test!AUDNZD remains bullish from a broader perspective, but recent price action suggests that bullish momentum is beginning to weaken after the break below the red ascending channel.
Following the rejection from the red supply area, price moved lower and is now testing the lower boundary of the blue channel, where it aligns with an important support area. This creates a technical zone that may attract buyers and is worth monitoring closely.
⭕As long as this support continues to hold, we can start looking for buy setups on lower timeframes, anticipating a bullish reaction from the current area.
⭕However, if price breaks below the lower boundary of the blue channel and the green trigger area, it would provide an important indication that momentum is shifting from bullish to bearish on the daily timeframe, increasing the probability of a deeper correction toward the lower boundary of the broader brown ascending channel.
The reaction around this support may help determine whether buyers can defend the daily bullish structure, or if sellers are beginning to take control, leading to a broader correction within the long-term bullish trend.
⚠️ Disclaimer: This analysis reflects my personal market view and is not financial advice.
Rayan Nasser
#AUDNZD #AUD #NZD #Forex #TechnicalAnalysis #PriceAction #Trading #MarketStructure XAUUSD: Rounding Top Signals Fresh Bearish Pressure Toward 4,030Hello everyone, here is my breakdown of the current XAUUSD setup.
Market Analysis
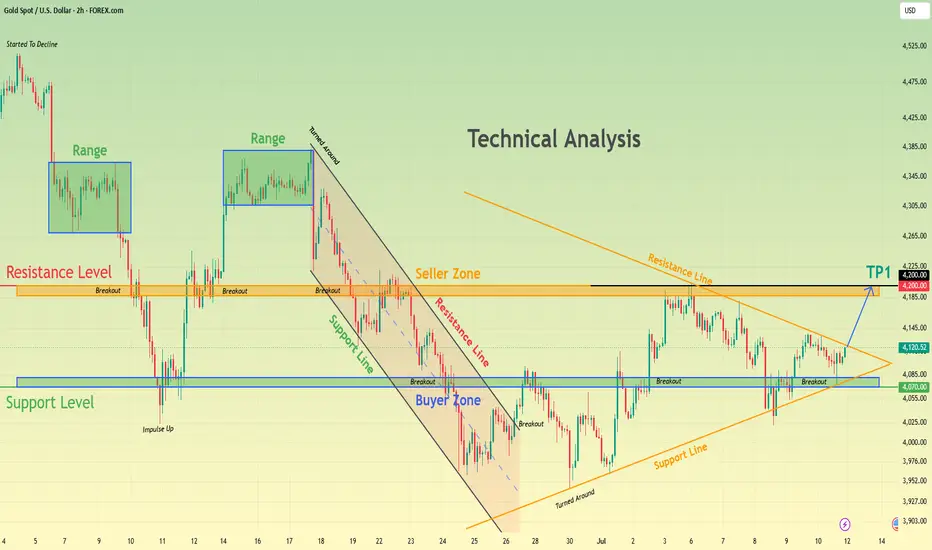
XAUUSD previously traded inside a broad descending channel after breaking below an earlier triangle support, confirming a bearish market structure. Price later found support near the 4,030 Support Zone, triggering a recovery. However, the rebound formed a Rounding Top pattern beneath the 4,200 Resistance Zone, signaling that buying momentum is fading.
Currently, XAUUSD is trading above the 4,030 Support Zone while remaining below the 4,200 Resistance Zone. Price has rejected the upper boundary of the recovery and continues to trade below the long-term descending channel resistance, keeping sellers in control.
My Scenario & Strategy
As long as XAUUSD remains below the 4,200 Resistance Zone and respects the descending channel resistance, the bearish scenario remains valid. A continuation lower could push price toward the 4,030 Support Zone (TP1).
However, a confirmed breakout above the 4,200 Resistance Zone and the descending trendline would weaken the bearish outlook and favor a stronger bullish recovery.
That’s the setup I’m tracking. Thank you for your attention, and always manage your risk. Short 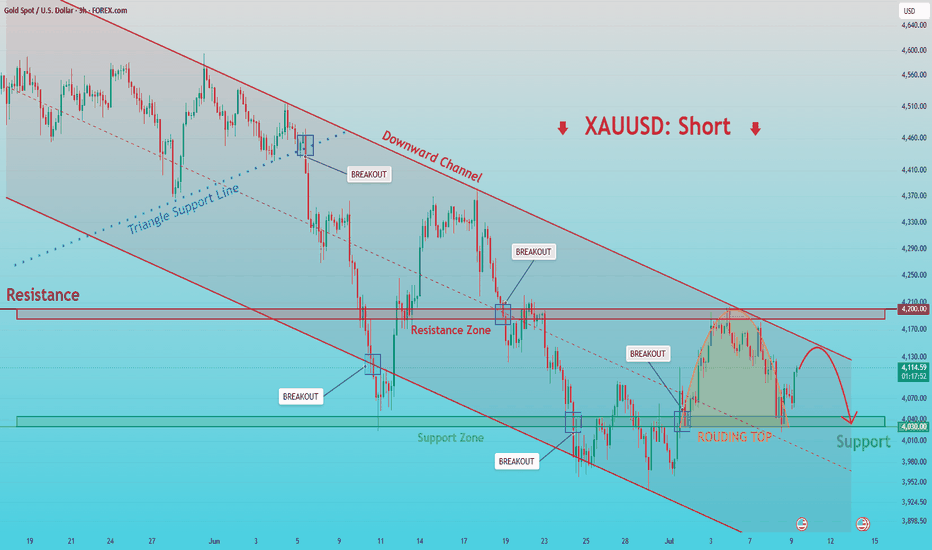
Bitcoin Near Key Resistance – Possible Pullback Toward 62,5K Hello traders! Here’s my technical outlook based on the current BTCUSDT (3H) chart structure. BTCUSDT previously traded inside an ascending channel after recovering from a major selloff. After breaking below the channel support, price lost bullish momentum and entered a wide consolidation range before buyers regained control above the 62,500 Buyer Zone. Currently, BTCUSDT is trading above the 62,500 Buyer Zone while approaching the 64,800 Seller Zone. The recovery is following a rising support trendline, but the major resistance area continues to limit further upside. As long as BTCUSDT remains below the 64,800 Seller Zone, the bearish scenario remains valid. A rejection from current levels could push price back toward the 62,500 Buyer Zone (TP1), where buyers may attempt to defend support. Please share this idea with your friends and click "Boost" 🚀  Short
Short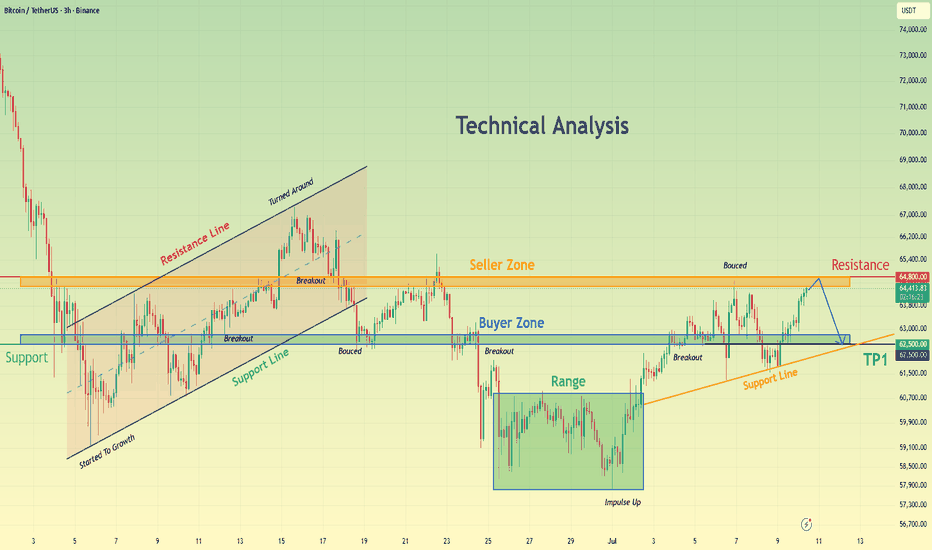
BITCOIN - Retest of the 64,500 liquidity zone BINANCE:BTCUSDT.P remains within the 58,000–67,000 trading range, established as part of the broader bearish trend. Locally, the market is testing the upper boundary of the consolidation zone at 61,000–64,500, with the primary focus now on the resistance area
Bitcoin is currently caught between three major forces: the hawkish FOMC minutes, unstable ETF flows—with outflows resuming after three consecutive days of inflows—and ongoing geopolitical uncertainty. The market still lacks a strong fundamental catalyst. From a medium-term perspective, Bitcoin could decline toward 58K–50K before a potential long-term bottom is formed. The broader trend remains firmly bearish.
Technically, Bitcoin is advancing toward the 64,370–64,690 resistance zone. This move may represent a liquidity grab before another leg lower
Resistance levels: 64,370, 64,690
Support levels: 62,550, 61,300
Bitcoin is forming a countertrend correction into a key resistance zone, which also coincides with the upper boundary of the current trading range and a major liquidity pool. A short squeeze in this area could shift momentum back in favor of the bears, while consolidation below this resistance zone may trigger another decline toward 62,550 or the range support at 61,300
Best regards,
R. Linda Short 
BITCOIN CASH [$BCH] ELLIOTT WAVE CRYPTO ANALYSIS WEEKLY TFNYSE:BCH Bitcoin Cash has arrived at what I consider the most important price level of the entire macro structure.
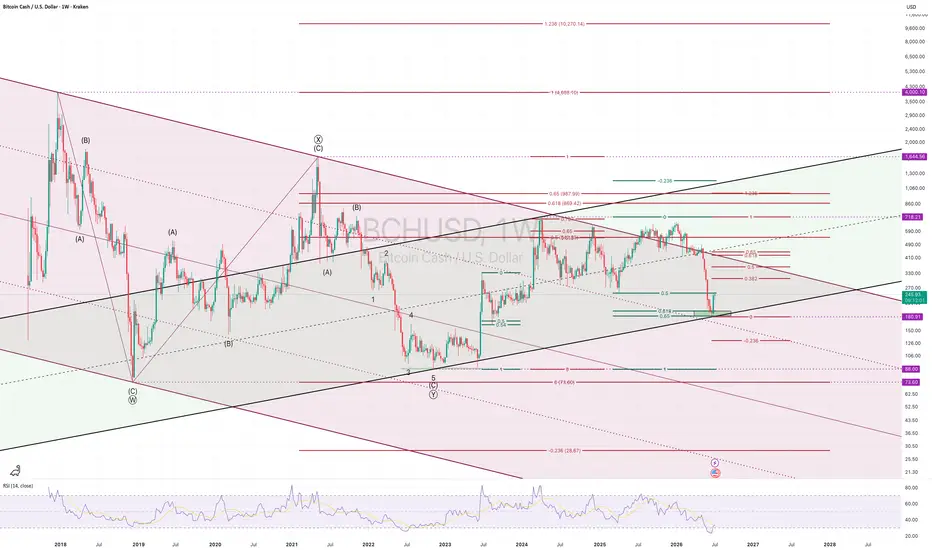
The recent sell-off found support almost perfectly inside the weekly Golden Zone (GZ) around $180, where several technical factors converge. This area is far more than just another support level—it represents the crossroads that will likely determine the next multi-year direction for BCH.
As long as the weekly Golden Zone continues to hold, my Elliott Wave count remains constructive. The market may still be completing a large corrective structure before beginning the next impulsive advance. If this interpretation proves correct, the long-term target remains the $4,000 region, with an ALGO take-profit objective near $10,270.
However, this bullish outlook still requires confirmation.
The first technical confirmation would be a decisive break above the daily Golden Zone, currently located around $443. Reclaiming that level would strengthen the bullish wave count considerably and suggest that the recent decline has indeed completed its corrective phase.
On the other hand, the current support cannot be lost. A sustained breakdown below the $180 weekly Golden Zone would invalidate my preferred bullish scenario and significantly increase the probability that BCH is still unfolding a much larger bearish structure. In that case, the next major downside objective shifts dramatically towards approximately $28.67.
This is why I believe the current price region deserves close attention. Markets rarely provide such clearly defined technical crossroads where both the bullish and bearish scenarios are so well separated by one critical level.
For now, Bitcoin Cash remains compressed between long-term support and multi-year resistance. The longer this compression persists, the more significant the eventual breakout is likely to become.
As always, Elliott Wave analysis is about probabilities rather than certainties. The market will ultimately determine which path unfolds—but from my perspective, $180 is the line that separates a potential multi-year bull market from the risk of one final capitulation.
Like and follow for more Elliott Wave and macro crypto analysis.
 Long
Long
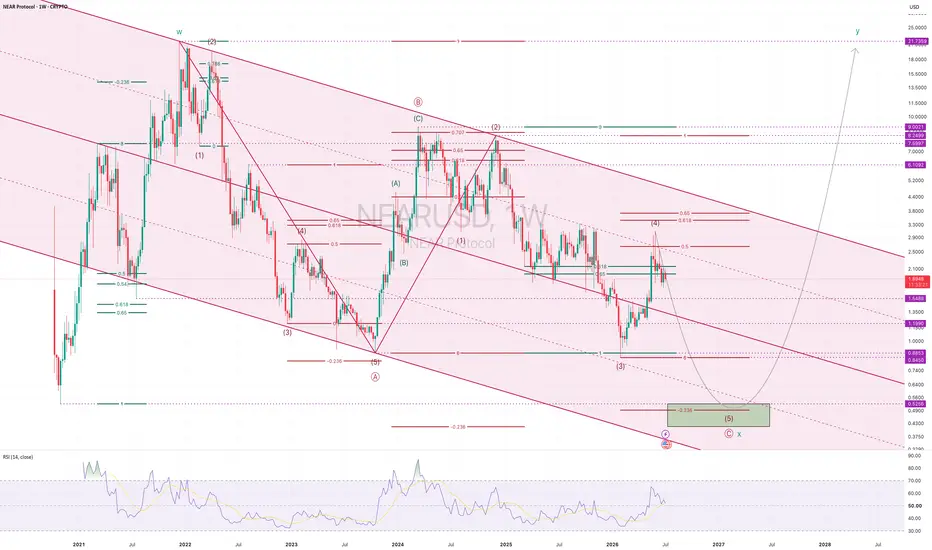
NEAR Protocol [$NEAR] Weekly TF EWP Crypto Analysis FIB TCNEAR PROTOCOL: One More Flush Before the Next Multi-Year Bull Market?
Since peaking during the 2021 bull market, NEAR has, in my view, been developing a large corrective sideways combo rather than a completed bear market. Instead of a simple ABC correction, price has spent years building a complex structure that has consumed both time and price—a hallmark of many mature Elliott Wave corrections.
My preferred count suggests that this macro correction is now entering its final chapter.
The recent recovery appears to be Wave (4) of the last impulsive decline. While this rally has improved sentiment, I believe it is more likely to be a counter-trend move than the beginning of a new secular bull market. If this interpretation is correct, one final Wave (5) should complete the entire corrective structure.
The area between $0.42 and $0.52 stands out as the most attractive accumulation zone. It aligns with the lower boundary of the long-term descending channel, historical support, and Fibonacci confluence. A final capitulation into this region would fit the Elliott Wave principle of ending corrections with maximum pessimism, potentially providing the foundation for the next multi-year advance.
Should Wave (5) complete as anticipated, the entire X wave of the sideways combo would be considered finished. At that point, the focus shifts from surviving the correction to identifying the birth of a new impulsive structure. A confirmed breakout above the multi-year descending trendline would provide the first technical evidence that the macro trend has turned.
From there, the previous all-time high around $22 becomes a realistic long-term objective—not as an immediate target, but as a potential destination over the course of the next primary bull market.
As always, Elliott Wave analysis is a framework of probabilities, not certainties. This is my primary count, and I will adjust it if price action invalidates the structure. Until then, I remain patient and continue to view any final weakness as part of the broader accumulation process rather than a reason to abandon the long-term thesis.
“The market often looks its weakest just before it begins writing its strongest chapter.”
Like and follow for more Elliott Wave and macro crypto analysis.  Long
Long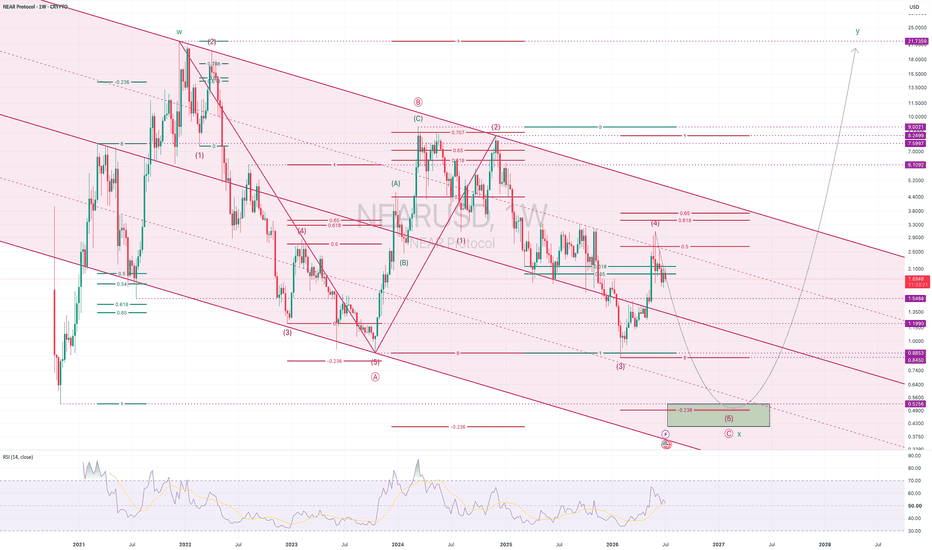
EURUSD: Climbs an Ascending Channel – Can Buyers Extend Rally?Hello everyone, here is my breakdown of the current EURUSD setup.
Market Analysis
EURUSD previously traded inside a range before breaking below support, confirming a bearish shift. After forming a rounding top beneath the long-term descending trendline, price declined into the 1.1400 Support Zone, where buyers stepped in and started a recovery inside an ascending channel.
Currently, EURUSD is trading above the 1.1400 Support Zone while remaining below the 1.1470 Resistance Zone. The recovery continues within the rising channel, with price gradually approaching the key resistance area.
My Scenario & Strategy
As long as EURUSD holds above the 1.1400 Support Zone and respects the ascending channel, the bullish scenario remains valid. A continuation higher could push price toward the 1.1470 Resistance Zone (TP1).
However, if EURUSD breaks below the 1.1400 Support Zone and loses the channel support, the bullish outlook would weaken and sellers could regain control.
That’s the setup I’m tracking. Thank you for your attention, and always manage your risk.