Short
Short
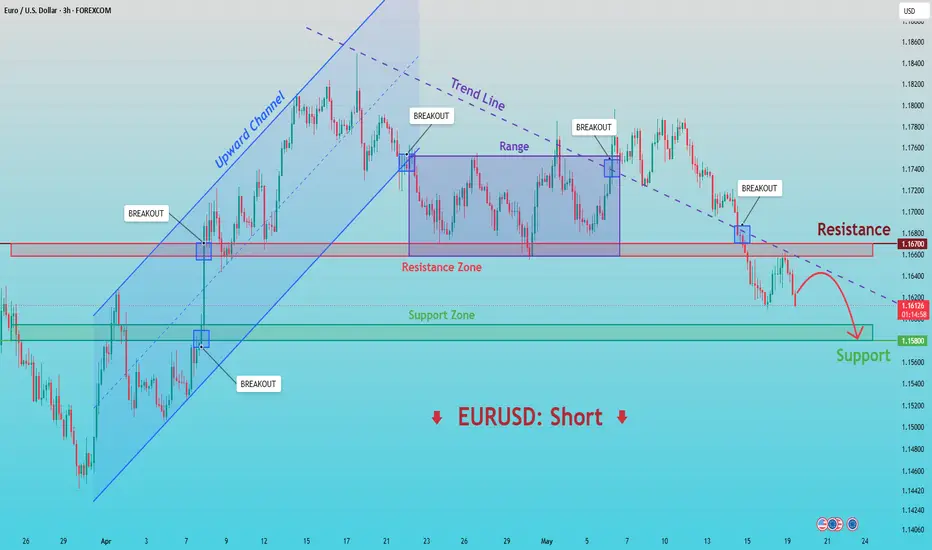
EURUSD: Descending Trendline Signals Further Downside To 1.1580Hello everyone, here is my breakdown of the current EURUSD setup.
Market Analysis
EURUSD previously traded inside an upward channel, confirming strong bullish momentum. After breaking below the channel support, price entered a consolidation range near the 1.1750 area before losing momentum and reversing lower.
Currently, EURUSD is trading below the 1.1670 resistance zone while holding above the 1.1580 support zone. Price recently broke below the range support and continues to respect the descending trendline, signaling that sellers remain in control and bearish pressure is still dominant.
My Scenario & Strategy
As long as EURUSD remains below the 1.1670 resistance zone and respects the descending trendline, the bearish scenario remains valid. A continuation lower could push price toward the 1.1580 support zone (TP1).
However, if price breaks back above the 1.1670 resistance zone and reclaims the descending trendline, the bearish outlook would be invalidated, opening the path for a stronger recovery.
That’s the setup I’m tracking. Thank you for your attention, and always manage your risk. XAUUSD: Rejection at Resistance Opens Path to 4,440 Support ZoneHello everyone, here is my breakdown of the current XAUUSD setup.
Market Analysis
XAUUSD previously traded inside an upward channel, confirming strong bullish momentum. After reaching the major 4,720 resistance zone, price lost momentum and entered a downward channel. Following a breakout from that bearish structure, gold formed a short-term range and attempted to recover.
Currently, XAUUSD is trading below the 4,720 resistance zone while holding above the 4,440 support zone. Price recently formed a fake breakout above resistance and completed a rounding top pattern, signaling that buyers are losing control and sellers are regaining momentum.
My Scenario & Strategy
As long as XAUUSD remains below the 4,720 resistance zone and fails to reclaim the upper boundary, the bearish scenario remains valid. A continuation lower could push price toward the 4,440 support zone (TP1).
However, if price breaks back above the 4,720 resistance zone and holds above the recent highs, the bearish outlook would be invalidated, opening the path for a stronger recovery.
That’s the setup I’m tracking. Thank you for your attention, and always manage your risk. Short 
Bitcoin Analysis: Rebound From 75,500 Demand Zone Toward 78,800Hello traders! Here’s my technical outlook based on the current BTCUSDT (4H) chart structure. BTCUSDT previously traded inside a range before breaking out and entering an ascending channel. After reaching the upper boundary of the channel, price broke below the structure and shifted into a consolidation phase. Currently, BTCUSDT is trading above the 75,500 buyer zone, which acts as key support, while remaining below the 78,800 seller zone that now serves as the main resistance area. Price recently declined from the descending resistance line and is retesting the ascending support line, signaling that buyers are attempting to defend the current structure. As long as BTCUSDT holds above the 75,500 support zone and respects the ascending support line, the bullish scenario remains valid. A rebound from this area could push price toward the 78,800 resistance zone (TP1). Please share this idea with your friends and click "Boost" 🚀  Long
Long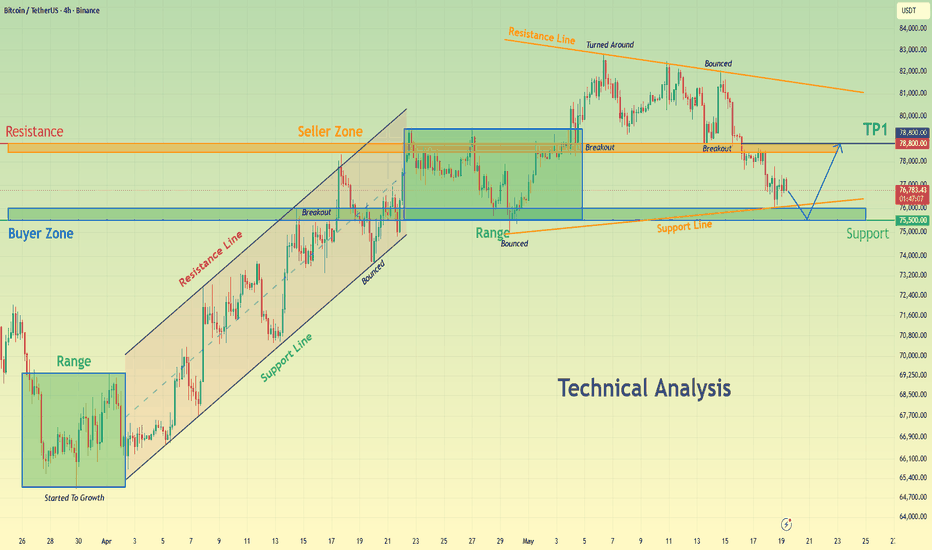
Short 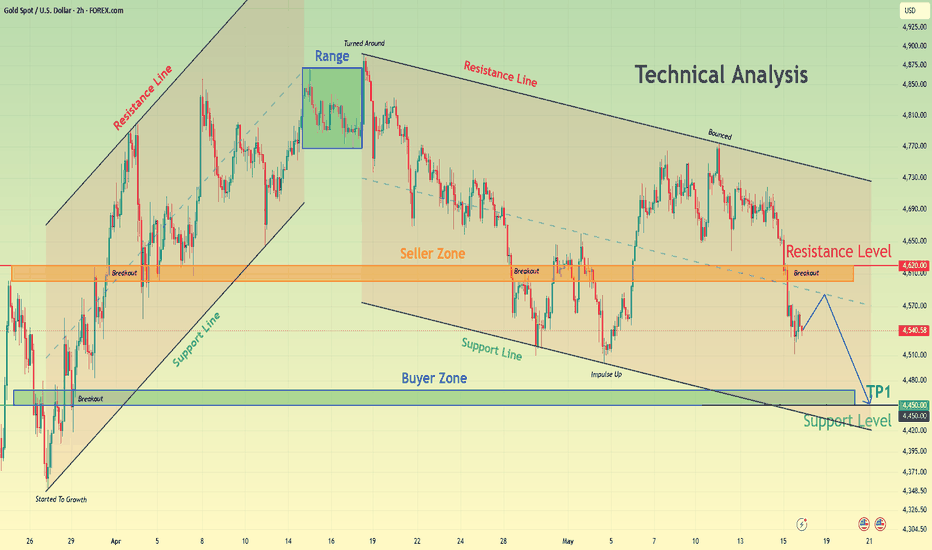
GOLD - Pre-break consolidation around 4500 ICMARKETS:XAUUSD is under pressure from a bearish trend on both the local and global scales. The strong dollar is attracting capital. The market is digesting the latest developments surrounding the U.S.-Iran conflict
The market did not buy into the “TACO” narrative, remaining cautious. Geopolitics is at an impasse, which is also putting pressure on gold through high oil prices.
The inflation shock on May 12–13 (CPI 3.7% y/y, PPI 6.0% y/y) has completely ruled out expectations of rate cuts in 2026, triggering a flight to safe-haven assets (the dollar).
Gold’s next move depends on developments in the Middle East. If stagflation risks return to the forefront, U.S. bond yields may resume their rise, putting further pressure on the non-yielding yellow metal
Resistance levels: 4588, 4607, 4646
Support levels: 4510, 4479, 4400
Globally, the focus is on the key support level at 4510. A break below this level could trigger a further decline toward 4400. However, locally, gold is consolidating between 4510 and 4588 and may remain within these boundaries for some time, testing resistance before falling.
Best Regards, R. Linda! Short 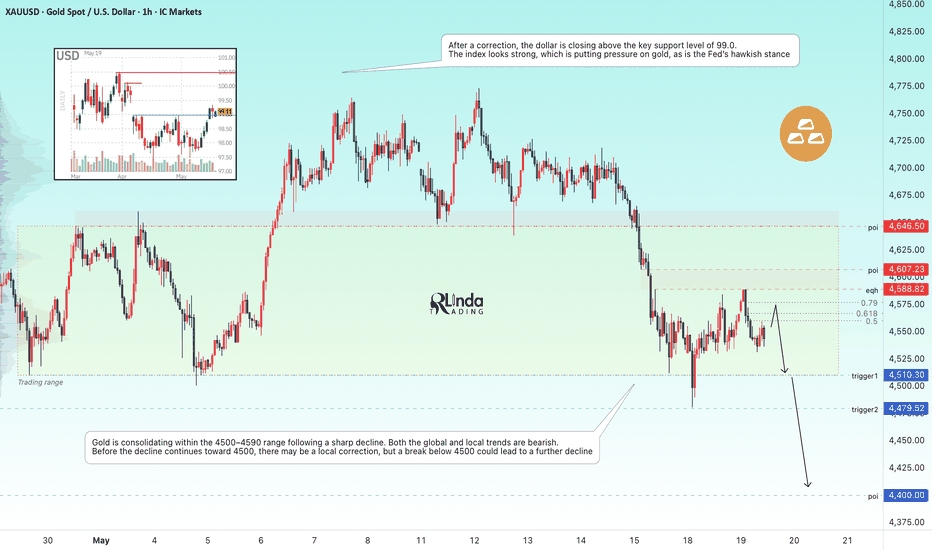
MESM May 19: Sitting on hands until 7372 or 7454 breaksMESM analysis for Tuesday, May 19
MESM is still trading inside yesterday’s range, and right now price is sitting around 7400. Because of that, this is not the kind of session where I want to be aggressive in the middle of the structure.
On the 4H chart, the key downside level I’m watching is 7372, which is yesterday’s low. If price breaks that level, then I think we could see downside continuation.
On the upside, the key bullish confirmation level for me is 7454. If we get a 4H candle close above 7454, then I think the trend could continue higher from there.
On the 1H chart, the structure remains range-bound between the marked levels, so I’d rather stay patient than force a trade inside the middle of the range.
On the 15M chart, the upside liquidity I’m watching is 7476, while the downside target I’m watching is 7362. Once the higher-time-frame range breaks, those 15-minute targets become more relevant.
Key levels
7454 = 4H bullish breakout level
7476 = upside liquidity
7372 = yesterday’s low / downside trigger
7362 = downside target
So for today, my plan is:
Stay patient while price remains in range
If price breaks 7372, watch for downside continuation
If we get a 4H close above 7454, watch for bullish continuation toward 7476
Not financial advice. No confirmation, no trade. CME_MINI:MESM2026 BTCUSDT Short: Momentum Fades, Demand Zone at 75,400 in FocusHello traders! Here’s my technical outlook on BTCUSDT (2H) based on the current chart structure. After breaking the consolidation range, BTC formed a pivot low near 74,800 and recovered inside the ascending channel. However, after reaching a pivot high near 82,800, the price lost momentum.
Currently, BTC has broken the descending channel even lower and broken the supply zone of 77,500, which now acts as resistance. This confirms the renewed pressure of sellers, and the price is now moving towards the demand zone of 75,400.
My scenario: as long as BTCUSDT remains below 77,500, the bearish bias remains valid. A continued decline could push the price to the demand zone of 75,400 (TP1). A recovery above the resistance level will weaken the bearish sentiment. Manage your risk! Short 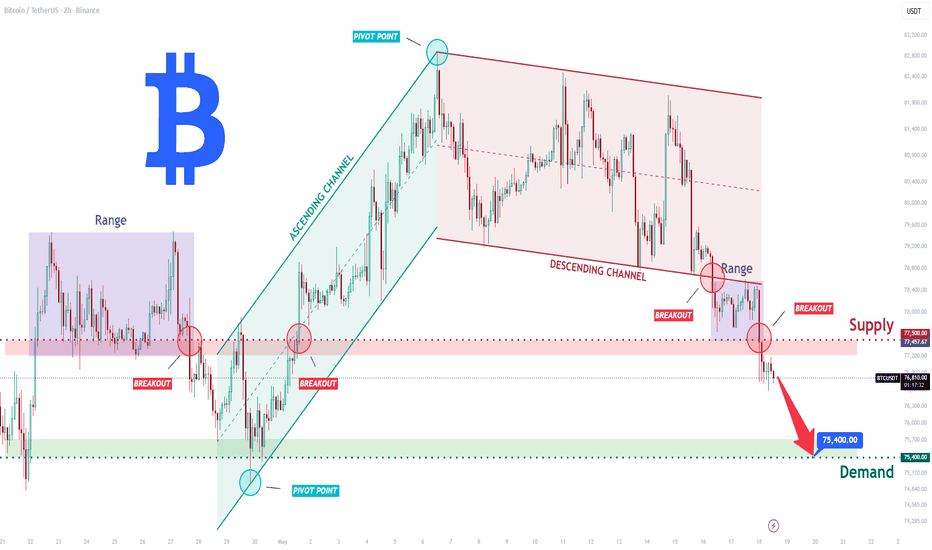
 Long
Long
 Long
Long
 Short
Short
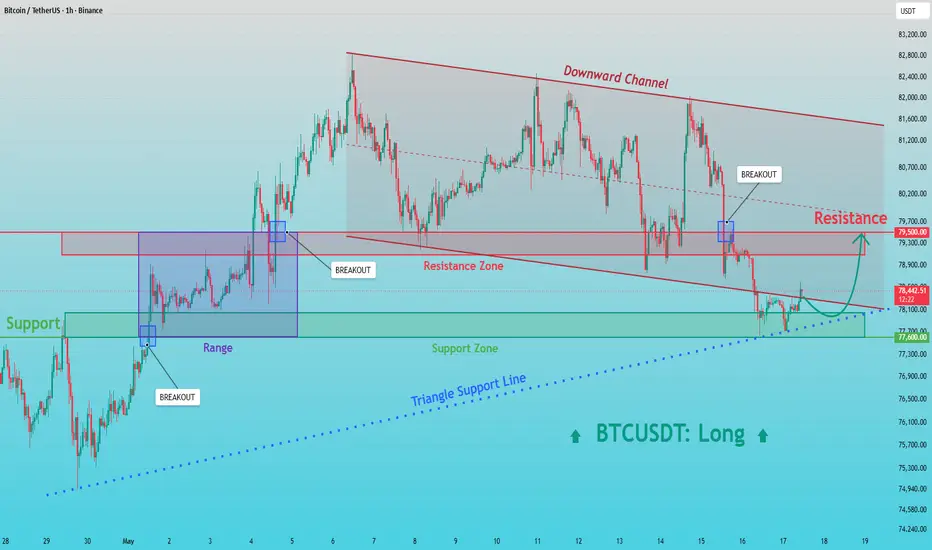
BTCUSDT: Price Holds Above 77,600 While Buyers Regain ControlHello everyone, here is my breakdown of the current BTCUSDT setup.
Market Analysis
Bitcoin previously traded inside a descending channel, confirming short-term bearish pressure. After several failed attempts to break above the resistance zone, price declined toward the lower boundary of the structure and formed a rising triangle support line near the 77,600 buyer zone.
Currently, BTCUSDT is trading above the 77,600 support zone while remaining below the 79,500 resistance level. Price recently rebounded from the triangle support structure and is attempting to recover after a strong bearish impulse, signaling that buyers are becoming active near the lower boundary of the pattern.
My Scenario & Strategy
As long as BTCUSDT remains above the 77,600 support zone and continues to respect the ascending triangle support line, the bullish recovery scenario remains valid. A continuation higher could push price toward the 79,500 resistance zone (TP1).
However, if price breaks below the 77,600 support level and loses the triangle support structure, the bullish outlook would be invalidated, opening the path for a deeper bearish continuation.
That’s the setup I’m tracking. Thank you for your attention, and always manage your risk. Long 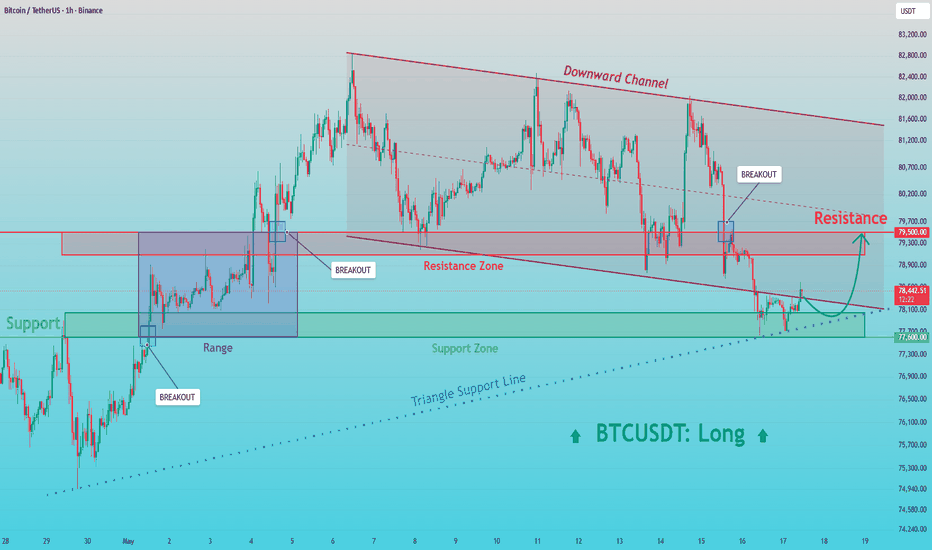
GOLD - Bear market. Trigger at 4,510 ICMARKETS:XAUUSD is under pressure again. The market is bearish. A false breakout of the trend resistance triggered a 3% drop on Friday; it will test key support. Friday’s session is closing on a weak note for the market...
The dollar has entered a bullish range. Momentum remains intact. The market is pricing in interest rate hikes; a new batch of “hot” economic data could support the index’s growth. The nearest catalysts are the release of the minutes from the Fed’s May meeting on May 20 and PCE data on May 28. Escalating geopolitical tensions will push the dollar even higher, intensifying pressure on gold.
Technically, gold is under pressure. The market is testing 4510; a close below this support level will open a new range of 450–4400 (4350). A close below 4510 could become a technical driver for the continuation of the decline
Resistance levels: 4588, 4607, 4646
Support levels: 4510, 4400, 4350
From the opening of the session, the market may form a local pullback aimed at liquidity hunting. As part of the correction, gold may test the resistance zone of 4588–4607 or the upper boundary of the range at 4646 before continuing its decline. A breakdown, close, and consolidation below 4510 could trigger a continuation of the decline.
Best Regards, R. Linda! Short 
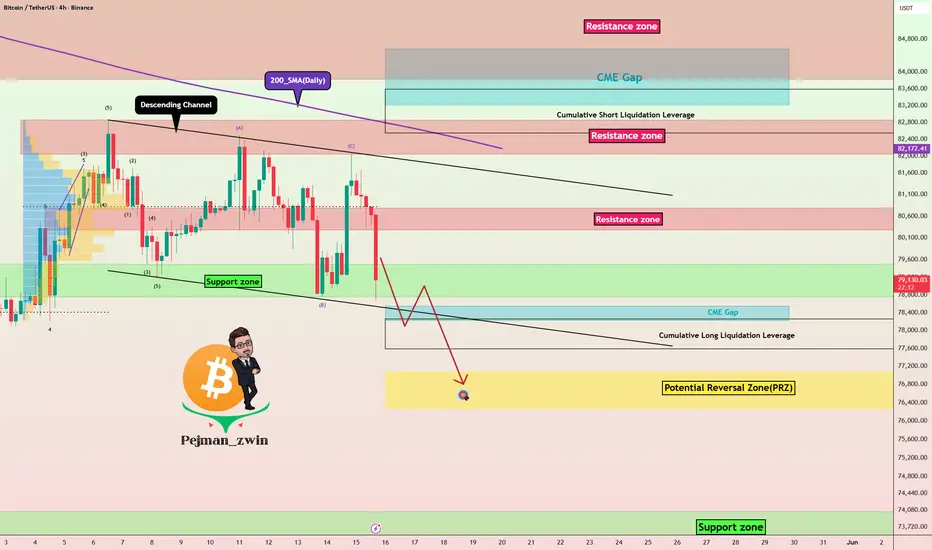
Bitcoin Is Losing Support _ And Macro Pressure Is BuildingBitcoin ( BINANCE:BTCUSDT ) started to decline right after the U.S. markets opened, surprising many traders. A large number of traders expected Bitcoin to attack the 200_SMA(Daily) once again, but that scenario did not happen.
At the moment, Bitcoin is attempting to break the support zone($79,750-$79,480) and the lower line of the descending channel.
From an Elliott Wave perspective, it seems we should expect more corrective downward waves, especially considering the bearish momentum seen in recent hours.
Additionally, the DXY index ( TVC:DXY ) is still showing bullish momentum, and due to Bitcoin’s strong correlation with the S&P 500 index ( FX:SPX500 ) in recent months, any weakness in the S&P 500 could also pressure Bitcoin further. At the same time, the U.S. 10-Year Government Bond Yield( TVC:US10 ) still appears bullish, and all of these factors together could support further downside for Bitcoin.
I expect Bitcoin to continue its bearish movement, break the support zone($79,750-$79,480), and, after filling the CME gap($78,545-$78,220), decline at least toward the Potential Reversal Zone (PRZ) .
Target: Potential Reversal Zone (PRZ)
Stop Loss(SL): $80,900(Worst)
Cumulative Long Liquidation Leverage: $83,580-$82,540
CME gap: $84,560-$83,215
What’s your view on Bitcoin? Can Bitcoin move back above $80,000, or should we expect a deeper correction?
Note: We should also continue monitoring geopolitical developments closely. Any escalation in tensions or unexpected news events could lead to further downside pressure on Bitcoin.
💡 Please respect each other's opinions and express agreement or disagreement politely.
📌Bitcoin Analysis (BTCUSDT), 4-hour time frame.
🛑 Always set a Stop Loss(SL) for every position you open.
✅ This is just my idea; I’d love to see your thoughts too!
🔥 If you find it helpful, please BOOST this post and share it with your friends. Short 
HYPE Ascends A Channel But Eyes Resistance AheadPYTH:HYPEUSD seems to have started what looks to be an Ascending Channel in Mid-March giving us our first High of the Rising Resistance and our first Low of the Rising Support beginning of April!
Now even with these impressive Bullish movements to the upside, PYTH:HYPEUSD still has some overhead Resistance to deal with and with having tested the Rising Resistance only twice, the third test could be a deciding factor if PYTH:HYPEUSD continues to the upside after breaking the Resistance around $48 - $50 to then test the All Time High of $59.39 set in September 2025!
If price is unable to surpass these price levels and sustain them, we could potentially see a move back down to the Rising Support last tested around $38 and if that support fails, a dip back down to $25, then $20 could be next!
-
What is fueling PYTH:HYPEUSD rally after all?
A lot of things are going on fundamentally, to start:
Hyperliquid's ecosystem got a big expansion with growing institutional attention after the laugh of the 21Shares Hype ETF, as well as a strong partnership struck between Hyperliquid, Coinbase and Circle with Coinbase "increasing its staked HYPE positions" and Circle "committing 500,000 Hype tokens toward validator participation" and a "migration to USDC improving broader market liquidity".
- www.tradingview.com
Tensions rising between the CME Group and ICE (Intercontinental Exchange Inc.) with the US seem to be having a negative effect on $HYPEUSD. CME and ICE are "urging the US to rein in Hyperliquid, which they described as a fast-growing, unregulated crypto platform that could skew global oil prices and be used for price manipulation."
- www.tradingview.com
-
"What is Hyperliquid?
Hyperliquid is a layer one (L1) blockchain best known for perpetual futures and spot trading. Beyond its flagship DEX trading platform, the ecosystem supports borrowing, lending, real world assets (RWAs), and a full-fledged Ethereum Virtual Machine (EVM), making it a leading force in decentralized finance (defi).
Just as electronic trading dramatically improved markets in the 2000s, Hyperliquid offers an opportunity for a massive technical upgrade of the existing financial system through a transparent, efficient, and resilient blockchain. HYPE is the native token of the Hyperliquid blockchain, with a maximum supply of 1 billion."
- coinmarketcap.com  Long
Long
EURUSD: Rounding Top Signals More Downside Toward 1.1560 SupportHello everyone, here is my breakdown of the current EURUSD setup.
Market Analysis
EURUSD previously traded inside a downward channel, confirming bearish momentum. After several breakout attempts near the resistance zone, price failed to hold above resistance and formed a rounding top pattern, signaling weakening bullish strength and a possible continuation lower.
Currently, EURUSD is trading below the 1.1720 resistance zone while moving away from the recent breakout area. The market is now approaching the 1.1560 support zone, which acts as the next key downside target.
My Scenario & Strategy
As long as EURUSD remains below the 1.1720 resistance level and respects the bearish structure, the short scenario remains valid. A continuation lower could push price toward the 1.1560 support zone (TP1).
However, if price breaks back above the 1.1720 resistance zone and holds above it, the bearish outlook would be invalidated, opening the path for a stronger bullish recovery.
That’s the setup I’m tracking. Thank you for your attention, and always manage your risk. Short 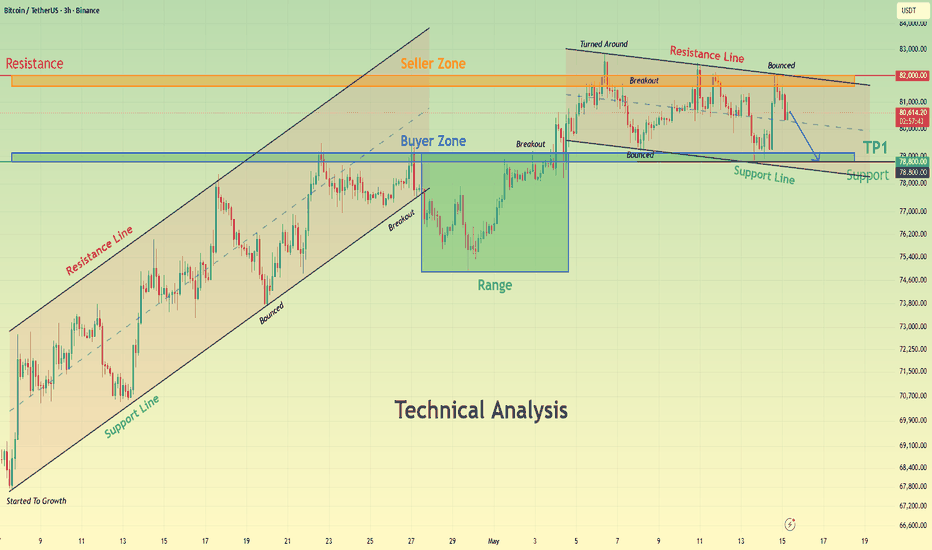
Short