ICICIGI Three White Soldiers Within a Large Ascending Triangle📊 ICICI Lombard General Insurance: Daily Technical Snapshot – Three White Soldiers Emerging Within a Large Ascending Triangle
📊STWP Equity Snapshot
________________________________________
MARKET STRUCTURE SNAPSHOT | NSE: ICICIGI | DAILY
________________________________________
• Closing Price: 1,839.00 (+48.50 | +2.71%)
• Core Trend: Downtrend (Weakening) / Recovery Structure Emerging
• Market State: Consolidation Near Breakout Zone
• Price Structure: Ascending Triangle Formation with bullish reversal characteristics
________________________________________
OPERATIONAL PRICE GRID & KEY REFERENCE LEVELS
________________________________________
• Model Reference Level: 1,844.00
• Hard Invalidation Level: 1,669.50
• Structural Risk: 174.50 (9.46%)
• Resistance Levels: R1 1,860.23 | R2 1,881.47 | R3 1,918.90
• Support Levels: S1 1,801.53 | S2 1,764.07 | S3 1,742.83
• Range Structure: Low 1,671.80 | High 1,908.90
• Higher Timeframe Observation Zones: 2,018.50 | 2,193.00
________________________________________
MOMENTUM, PARTICIPATION & CPR DATA
________________________________________
• Volume Profile: 539.56K Shares
• Volume Character: Normal Participation
• RSI Metric: 58.80 (Bullish Momentum Recovery)
• ADX Reading: 12.78 (Weak Trend Environment)
• ROC: +6.12%
• MACD Status: Recovery Phase | Momentum Improving
• Stochastic Reading: 97.10 (Strong Momentum Zone)
• Current Bias: BUY ON PULLBACKS
• CPR State: Bullish Zone | CPR Moving Up (Wide)
• Today's CPR: Pivot 1786.20 | Top 1788.35 | Base 1784.05
• Tomorrow's CPR (Projected): Pivot 1822.75 | Top 1830.90 | Base 1814.65
________________________________________
📚 EDUCATIONAL OBSERVATION
________________________________________
ICICI Lombard is displaying a constructive technical structure after spending several months consolidating within a broad contracting range. Price action has developed into what appears to be a large Ascending Triangle pattern, characterized by rising lows and a relatively stable resistance zone near the 1,900 region. Such formations often reflect gradual accumulation as buyers become increasingly willing to absorb supply at higher prices.
The dashboard identifies a Three White Soldiers pattern with an estimated reliability of approximately 64%, suggesting a strong bullish reversal signal following a period of weakness. Recent candles demonstrate improving buyer participation, with price recovering sharply from the lower boundary of the triangle and approaching the upper resistance region once again.
Momentum indicators are beginning to support the improving structure. RSI has recovered to 58.80 and remains comfortably above the neutral zone, indicating strengthening buying pressure. ROC has turned positive at 6.12%, while Stochastic readings near 97 reflect strong short-term momentum. ADX remains relatively low at 12.78, indicating that a powerful directional trend has not yet fully developed despite the recent improvement in price behavior.
The projected CPR structure remains bullish and has shifted higher, with tomorrow's Pivot projected near 1,822.75. Rising CPR structures generally indicate improving market acceptance of higher price levels and often support continuation moves when price remains above the projected range.
From a broader structural perspective, the most important level remains the descending resistance trendline near the 1,900–1,920 zone. A decisive breakout above this region could complete the larger Ascending Triangle structure and potentially shift market focus toward the higher timeframe observation zones near 2,018 and 2,193. Until such a breakout occurs, the stock remains in a consolidation-to-recovery phase rather than a confirmed expansion phase.
From a business perspective, ICICI Lombard continues to benefit from growing insurance penetration in India, increasing awareness of health and general insurance products, and long-term expansion opportunities within the domestic insurance sector. While technical analysis remains the primary focus of this report, the broader sector backdrop remains supportive for long-term growth.
Support and resistance levels should be treated as observation zones rather than predictive targets. Chart patterns, momentum indicators, volume analysis, and CPR frameworks are educational tools that help market participants understand evolving market structure within a disciplined risk-management framework.
________________________________________
⚠️ Disclaimer
________________________________________
• This analysis is provided strictly for educational and informational purposes.
• This is not financial, investment, or trading advice and should not be considered a recommendation to buy or sell any security.
• Stock market investments are subject to market risks, including the possible loss of capital.
• Past performance, historical observations, chart patterns, and technical indicators do not guarantee future results.
• Please conduct your own research and consult a SEBI-registered financial advisor before making investment decisions.
• STWP assumes no responsibility or liability for any financial loss arising directly or indirectly from the use of this information.
 Long
Long
ICICIBANK Three White Soldiers - Developing W PatternICICI Bank: High-Volume Reversal Attempt Emerges as Weakening Downtrend Approaches Critical Structural Pivot
Market Context & Structural Shift
ICICI Bank is displaying an increasingly constructive technical profile on the daily timeframe as a weakening downtrend begins transitioning into a potential recovery phase. While the broader trend has not yet fully reversed, recent price action suggests that selling pressure is losing intensity and buyers are gradually regaining control.
The most significant development on the chart is the emergence of a Three White Soldiers reversal pattern accompanied by exceptionally strong participation. The latest session recorded volume of 35.92 million shares, one of the strongest volume expansions observed in recent weeks. From an institutional perspective, volume acts as the validation mechanism behind price movement. Strong bullish candles supported by expanding participation often indicate that buying interest is becoming more committed rather than merely speculative.
The recent advance is particularly noteworthy because it follows a prolonged corrective phase. Instead of continuing lower, the stock established a higher low structure and subsequently attracted increasingly aggressive buying activity. This shift suggests a gradual transition from distribution toward accumulation.
While some market participants may identify a developing W-shaped recovery structure, it is important to note that the pattern remains incomplete. The neckline region has not yet been tested, meaning the current move should be viewed as a recovery attempt within a broader structural repair process rather than a confirmed major breakout.
At present, the technical evidence supports a narrative of improving momentum, strengthening participation, and a weakening downtrend that is approaching an important decision point.
________________________________________
Multi-Day Swing Setup & Execution Framework
The current setup revolves around the Reference Zone at ₹1,333.00, which serves as the primary structural pivot for the ongoing recovery.
With price currently trading at ₹1,317.00, the market remains slightly below this confirmation area. A sustained move toward and above ₹1,333.00 would indicate improving acceptance of higher prices and strengthen the probability of continuation toward overhead resistance levels.
Immediate Structural Hurdle
Reference Zone: ₹1,333.00
This remains the most important level in the near term. Successful acceptance above this zone would confirm that buyers are maintaining control following the recent reversal signal.
Resistance Framework
Resistance 1: ₹1,337.83
The first supply area likely to attract short-term profit-taking activity. Sustained trading above this level would further strengthen the recovery narrative.
Resistance 2: ₹1,358.67
A move into this zone would indicate increasing confidence among market participants and continued trend repair.
Resistance 3: ₹1,384.33
This level carries elevated significance because it aligns closely with the upper boundary of the recent trading structure and represents a major supply region.
Higher Range: ₹1,393.10
The ₹1,384–₹1,393 region represents the most important upside decision zone visible on the chart. This area may effectively function as the neckline region of the developing W-shaped structure. A decisive breakout above this zone would materially strengthen the medium-term technical outlook.
Extended Upside Reference Zones
Upside Reference 1: ₹1,414.70
A move toward this region would indicate that the recovery has evolved into a broader trend continuation phase rather than a simple rebound.
Upside Reference 2: ₹1,496.35
This represents the larger structural upside reference visible on the chart and would only become relevant if momentum remains strong following a successful breakout above the higher range.
________________________________________
Support Infrastructure & Risk Management
Despite the improving technical backdrop, disciplined risk management remains critical because the stock is still operating within a broader recovery framework.
Support Structure
Support 1: ₹1,291.33
This is the nearest support level and serves as the first indication of whether buyers remain committed during any pullback.
Support 2: ₹1,265.67
A decline toward this region would suggest weakening momentum and require closer monitoring of the recovery structure.
Support 3: ₹1,244.83
This level represents the final major support zone before the broader bullish thesis begins to deteriorate.
Lower Range: ₹1,200.50
A move toward this area would indicate a significant breakdown in the current recovery attempt and re-establish broader downside pressure.
Technical Invalidation
Stop Loss: ₹1,251.30
This level serves as the primary technical invalidation point for the current swing framework. A decisive break below this level would suggest that buyers have failed to maintain control following the recent reversal signal.
Risk Assessment
The setup currently carries a defined risk of ₹81.70 per share between the reference zone and the stop-loss level.
Given this risk profile, position sizing should be adjusted appropriately to ensure that portfolio exposure remains aligned with individual risk-management objectives. Strong technical setups may improve probabilities, but preserving capital remains the primary objective of professional market participation.
________________________________________
Technical Conclusion
ICICI Bank is exhibiting multiple signs of technical improvement as a weakening downtrend begins showing characteristics of a potential recovery phase. The emergence of a Three White Soldiers reversal pattern, combined with exceptionally strong volume of 35.92 million shares, provides meaningful evidence that buying participation is increasing.
The key observation is not merely the candlestick formation itself, but the combination of higher lows, expanding volume, improving momentum, and strengthening demand participation. Together, these factors suggest that the stock is undergoing a process of structural repair.
The immediate focus remains on the ₹1,333.00 reference zone. Sustained acceptance above this level would strengthen the bullish case and open the path toward ₹1,337.83, ₹1,358.67, and ultimately the major ₹1,384–₹1,393 decision zone.
While a developing W-shaped recovery structure may be emerging, confirmation would require a decisive breakout above the higher-range resistance area. Until then, the chart should be viewed as a volume-confirmed recovery attempt with improving technical characteristics rather than a completed trend reversal.
________________________________________
Educational Disclaimer
This analysis is provided solely for educational and informational purposes and reflects a technical interpretation of price action, volume behaviour, market structure, and chart patterns. It does not constitute investment advice, a recommendation, or an offer to buy or sell any financial instrument. All market participants should conduct their own independent research and consult a SEBI-registered investment advisor before making any investment or trading decisions.
 Long
Long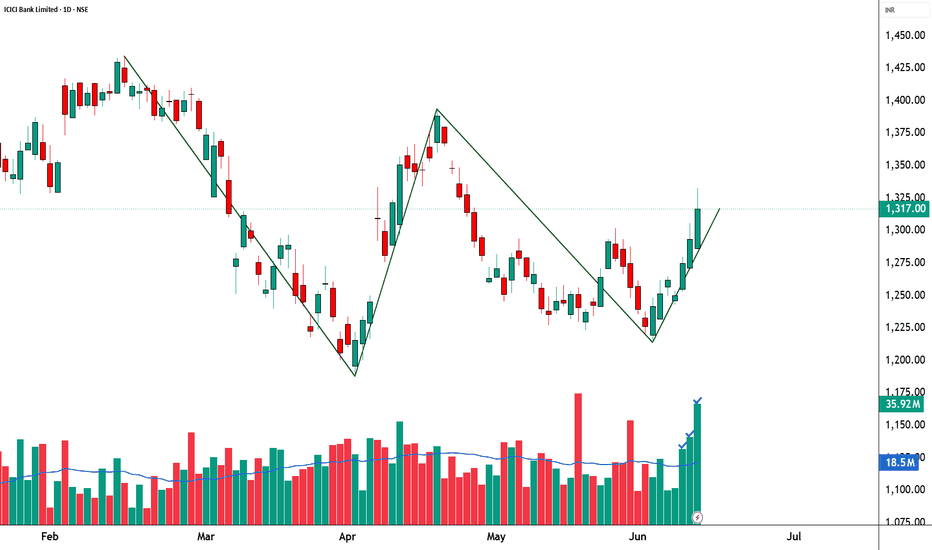
CPPLUS – STWP Equity Snapshot📊 CPPLUS – STWP Equity Snapshot
Ticker: NSE: CPPLUS
Sector: Electronic Security / Surveillance Systems
CMP: 1,689.00 ▲ (+4.91% | 27 Feb 2026)
Learning Rating: ⭐⭐⭐⭐☆ (Strong Continuation Within Expanding Structure)
Chart Pattern Observed: Three White Soldiers After Consolidation Base
Candlestick Context: Strong Bullish Expansion Candle with Above-Average Participation
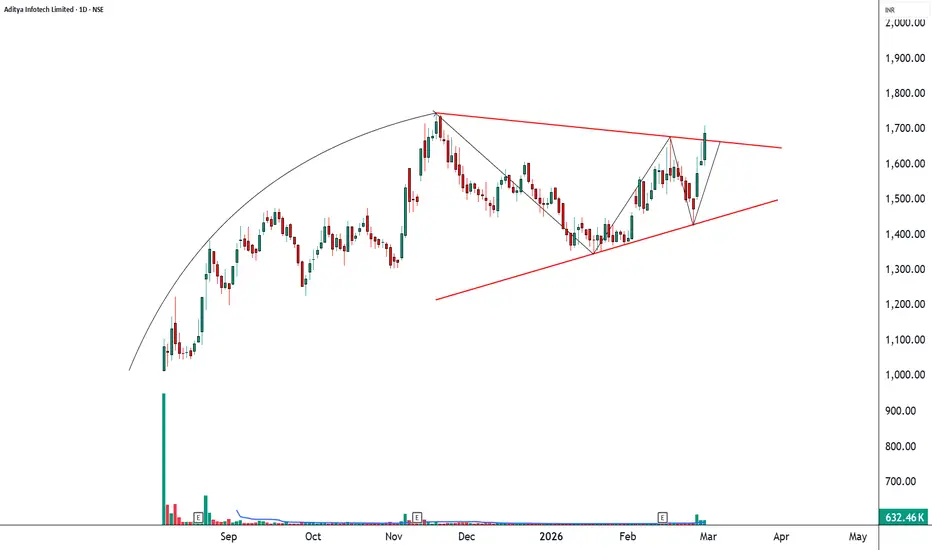
CPPLUS has transitioned from a prolonged consolidation structure into a decisive bullish expansion phase, reclaiming prior supply zones with conviction. The emergence of a Three White Soldiers formation after a base-building period signals a clear shift in short-term control toward buyers. The sequence of higher highs and higher lows now reflects developing trend structure rather than range-bound fluctuation.
RSI is positioned near 66.94, indicating strong bullish momentum without entering extreme overbought territory. This suggests continuation strength remains intact, though monitoring for short-term cooling near resistance remains essential. MACD is positively aligned and expanding, reinforcing the directional bias. The broader structure has shifted from consolidation into an active expansion phase, but price is approaching layered resistance, making acceptance behaviour critical.
From a CPR perspective, price is trading above the pivot zone, and the projected CPR is widening upward. Such behaviour typically supports continuation with shallow retracements rather than deep pullbacks. Immediate resistance lies in the 1,733–1,847 zone. Sustained acceptance above this band would confirm structural continuation, while rejection may lead to temporary consolidation within the expanding range.
Volume Analysis
Current volume is running above the recent average, with relative volume at 1.29 times normal participation. The expansion is supported by meaningful activity, strengthening the credibility of the breakout attempt. Continuation probability increases if participation sustains near resistance; a contraction in activity could result in short-term range formation before the next directional leg.
Key Levels – Daily Timeframe
Primary support areas are positioned near 1,619, followed by 1,550 and 1,526. On the upside, resistance zones are located around 1,733, 1,778, and 1,847. These levels represent prior reaction areas and will act as structural reference points for continuation or rejection.
Structure Read – What Matters Now
The decisive breakout above prior consolidation highs, backed by consecutive bullish candles, is the key structural development. Focus now shifts to whether price achieves clean acceptance above the 1,733–1,847 resistance cluster. Sustained trade below 1,526 would weaken the bullish structure and increase the probability of range re-entry. The primary risk lies in overextension after rapid expansion. The most probable near-term outcome is controlled continuation with intermittent pullbacks rather than abrupt reversal.
Price Reference Framework – Educational View
From an intraday perspective, the observation zone lies around 1,709, with risk invalidation below 1,591. Upside reference zones are positioned near 1,828 and 1,946. These levels are intended solely for studying short-term price behaviour and structural interaction.
From a swing perspective over the next two to five sessions, the observation zone remains around 1,709, with structural invalidation below 1,526. Upside reference zones extend toward 2,076 and 2,350, and become relevant only if price sustains above reclaimed resistance.
STWP View
Momentum is strong and the broader trend is classified as up. Risk remains elevated due to recent expansion velocity and proximity to resistance. Volume is moderate but supportive. Sentiment is bullish, RSI stands at 66.94 reflecting strength, and the session registered a 4.91 percent advance.
Final Outlook
Momentum: Strong
Trend: Up
Risk: High
Volume: Moderate
📘 Learning Note
Strong continuation patterns gain durability when structure, participation, and acceptance align. A breakout is confirmed by sustained behaviour above supply, not by the size of a single candle.
⚠️ Disclaimer
This post is intended solely for educational and informational purposes. It does not constitute investment advice, a recommendation, or a solicitation to buy or sell any security. Market investments are subject to risk. Please consult a SEBI-registered financial advisor before making any investment decisions. STWP is not responsible for actions taken based on this analysis.
💬Did this help you read the chart better?
🔼 Boost | ✍️ Comment | 🔁 Share with a learner
👉 Follow STWP for clean chart-reading insights
Stay Calm. Stay Clean. Trade With Patience.
 Long
Long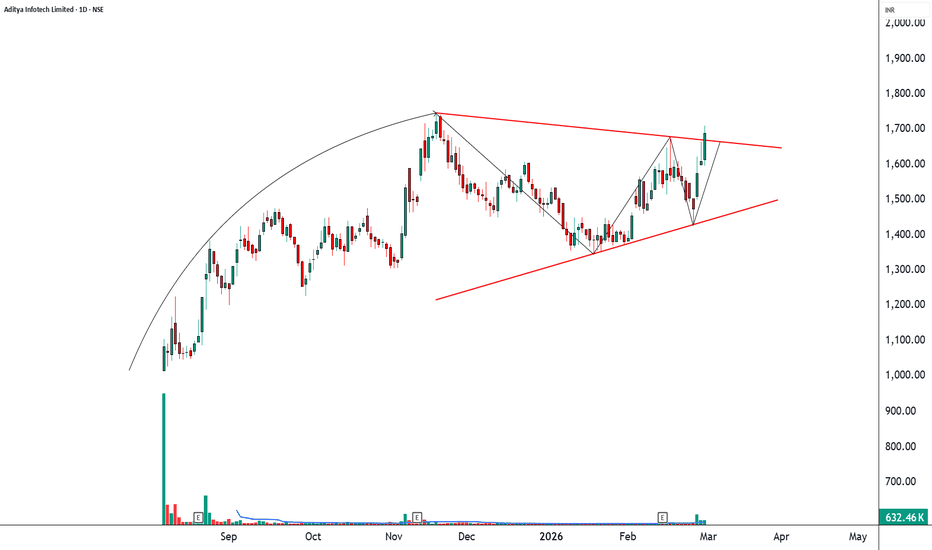
Three White Soldiers & Three Black CrowsHello, Traders! 😎
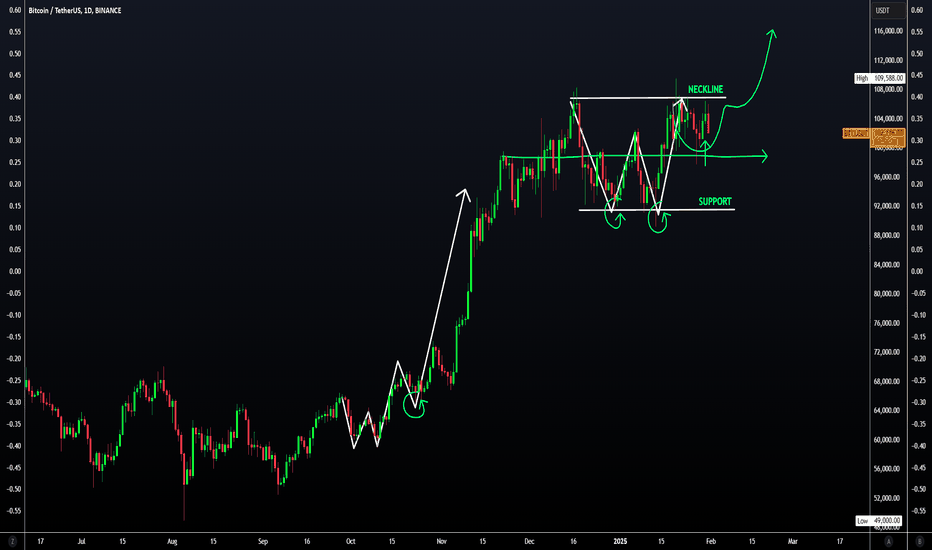
In technical analysis, not all candlestick patterns are created equal. While some merely hint at indecision or short-term corrections, others shout with conviction: "Trend reversal is coming…" Two of the most powerful momentum candlestick formations are the Three White Soldiers and the Three Black Crows. When they appear, traders PAY ATTENTION. In this article, we’ll dive deep into: What do these patterns look like? Why do they form? What do they tell us about market psychology? How to trade them?+ Their limitations 👇🏻
What Are Three White Soldiers and Three Black Crows?
These Are Multi-Candle Reversal Patterns That Suggest A Strong Shift In Market Sentiment:
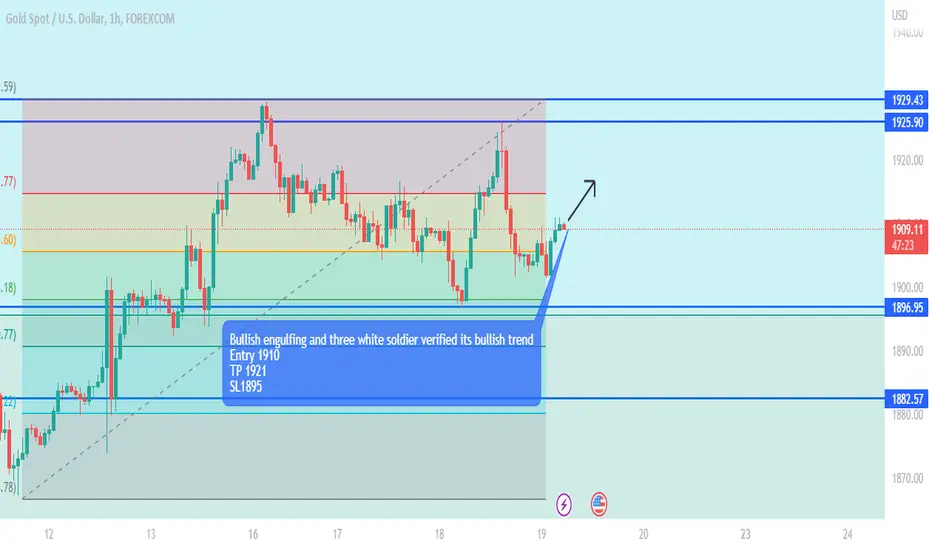
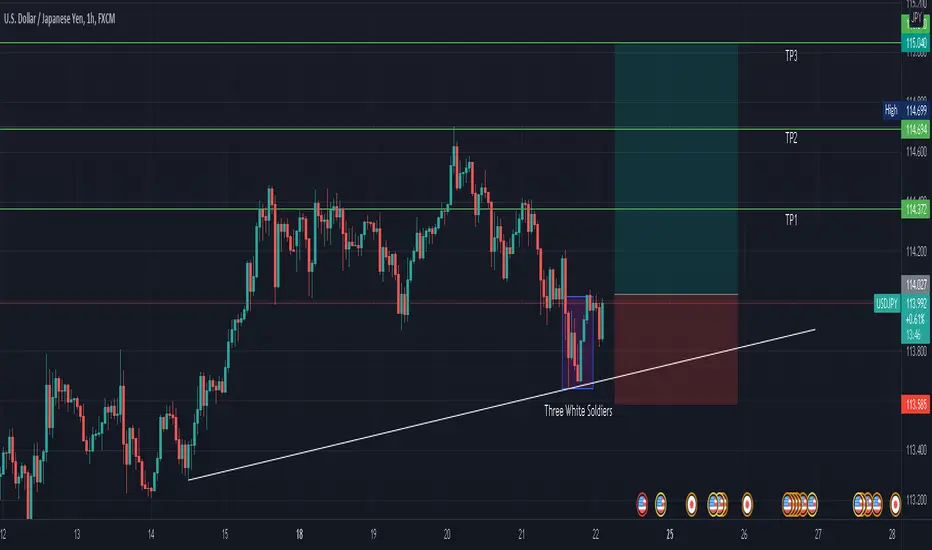
Three White Soldiers. A 🐂bullish reversal pattern that occurs after a downtrend. It consists of three consecutive long-bodied green (or white) candles, each closing higher than the last, and ideally opening within the previous candle’s real body.
Three Black Crows. A 🐻bearish reversal pattern that shows up after an uptrend. It’s made of three consecutive long-bodied red (or black) candles, each closing lower than the last and opening within the previous candle’s real body. They signal not just a change in price, but a shift in power, from sellers to buyers (or vice versa).
Candles With a Message
Unlike most one-candle signals or minor patterns, these sequences tell a real story. They show that one side has taken clear control over the market — not for an hour, not for a single day, but for multiple sessions. And that kind of shift, especially on higher timeframes like daily or weekly charts, is something seasoned traders pay close attention to.
Let’s get into the psychology for a second. Imagine you’re a trader who just watched BTC drop for two weeks. Then out of nowhere, three strong green candles appear, each more bullish than the last. You’re seeing buyers push through resistance levels like they don’t even exist. That’s not just a bounce, that’s confidence. That’s the kind of thing that makes people FOMO back in, or finally close out their shorts. Same with the Black Crows. If the price has been climbing and suddenly sellers start hammering it for three days straight? That’s not retail panic. That’s big money exiting.
Now, How do Traders Trade Them?
Well, a lot of people jump in right after the third candle closes. If you’re going long on the Three White Soldiers, you’re betting that the breakout has legs. Same for shorting the Black Crows.
But, and here’s the trap, not all of these patterns play out. Sometimes, that third candle is the climax, not the beginning. So confirmation matters. Volume should increase. The move should break a recent key level. Indicators like RSI or MACD should support the shift. Otherwise, you might just be catching the end of a move, not the start of one.
Another mistake? Ignoring context. These patterns mean nothing if they’re forming in the middle of chop or during low-volume holiday trading. They work best when they signal the end of exhaustion.
And let’s be honest. Even if the pattern is clean, you still need a plan. Stops should go below the first green candle (for bullish setups) or above the first red one (for bearish setups). If price moves against you, it means momentum never really shifted. That’s your cue to get out fast.
Final Thoughts
Three White Soldiers and Three Black Crows are powerful tools in the hands of a patient trader. Of course, these patterns aren’t perfect. They don’t account for time, so a 3-day move might seem powerful, but if it happens slowly over 12-hour candles, it’s not as strong as the same pattern on a daily chart with volume.
The takeaway? These are patterns worth knowing, not because they’re magic, but because they reflect a real shift in market behavior. When Three White Soldiers or Three Black Crows show up in the right place, at the right time, with the right confirmation… that’s when charts stop being random and start making sense. But remember. They are indicators, not guarantees. The best traders use them in conjunction with other tools and a clear trading plan.  Long
Long
Will Three White Soldiers Lead the Way?OANDA:XAUUSD Analysis
4H Chart
Current Price: 2447.215
Analysis Summary
• Three White Soldiers Pattern
• Volume Analysis
• Overbought and Resistance Zone
• Overall Bullish Trend
Three White Soldiers:
The chart shows a clear Three White Soldiers pattern, a strong bullish reversal candlestick formation indicating potential upward momentum. This pattern suggests consistent buying interest, as each candle closes higher than the previous one, signaling sustained demand.
Volume Analysis:
A closer look at volume reveals a weakening trend in the third candle of the Three White Soldiers pattern, suggesting a slight decline in buying strength:
• 1st Candle: 74.889K
• 2nd Candle: 134.962K
• 3rd Candle: 41.235K
This drop in volume in the last candle may indicate limited buying pressure, warranting caution before assuming continued upward movement.
Overbought and Resistance Zone:
The price is approaching a significant Overbought and Resistance Zone, which could act as a barrier to further upward movement in the short term. Combined with the lower volume in the third candle, this zone could lead to a potential consolidation or minor pullback before the next upward move. Despite this, the bullish reversal signaled by the Three White Soldiers suggests that the overall trend remains positive.
Interpretation:
Considering the overall bullish trend, the weakening volume in the last candle of the Three White Soldiers, and the approach to the Overbought and Resistance Zone, we anticipate the following:
1. Retracement to Support: The price may retrace down to 2739.624 before rebounding back to the Resistance Zone.
2. Potential Pullback to Ultimate Support: A further dip may take the price towards Ultimate Support at 2734.375.
3. Continued Bullish Momentum: After testing these support levels, the price is expected to resume its upward trend, with a potential breakout beyond the Resistance Zone, targeting the Extreme Overbought Zone.
Key Levels to Watch:
• Support: 2714.844
• Ultimate Support: 2734.375
• Retracement Level: 2739.624
• Overbought Zone: 2754.116
• Extreme Overbought: 2758.565
• Resistance: 2758.565
Overall Trend:
The overall trend remains bullish, with expectations of continued upward movement following any short-term pullbacks.
This analysis combines technical patterns, volume insights, and trend direction to provide a comprehensive outlook. Happy trading!
 Long
Long
Long
Three White SoldiersGreetings, traders! Today, let’s dive into a powerful candlestick pattern: the Three White Soldiers. This pattern, often regarded as a bullish signal, can provide valuable insights.
Understanding the Three White Soldiers Pattern:
The Three White Soldiers pattern is identified by three consecutive bullish candles, symbolizing a robust influx of buying pressure. When these candles appear in a sequence, it suggests a shift in market sentiment from bearish to bullish.
Key Characteristics:
Bullish Momentum: The pattern signifies a strong uptrend, indicating a potential continuation of the existing market trend.
Candlestick Size: Pay attention to the size of the candles. In this pattern, large-bodied candles with minimal wicks reflect substantial buying activity. This emphasizes the dominance of buyers in the market.
Volume Confirmation: Volume indicators on charting platforms can validate the pattern. An uptick in volume during the formation of the Three White Soldiers further strengthens its significance.
Trading Strategies with the Three White Soldiers Pattern:
Confirmation with Volume: Ensure the pattern is supported by increased trading volume, affirming the authenticity of the bullish move.
Combine with Other Indicators: Enhance your trading strategy by integrating the Three White Soldiers pattern with trend lines, Fibonacci retracement levels, or other technical indicators. This synergy can provide a more comprehensive view of the market.
Wait for Confirmation: Patience is key. Wait for the bullish candles to close before considering the pattern confirmed. This approach reduces the risk of false signals.
Consider Timeframes: Analyze the pattern across multiple timeframes. A Three White Soldiers formation on higher timeframes (such as daily or weekly charts) often indicates stronger bullish potential.
Risk Management and Trade Execution:
Set Stop-Loss: Establish stop-loss below first candlestick of the Three White Soldiers.
Diversify Your Trades: Avoid over-concentration in a single asset. Diversifying your trades across different instruments can mitigate risks associated with individual market volatility.
By combining this pattern with meticulous analysis, strategic planning, and risk management, traders can enhance their overall trading prowess.
Happy trading, and may the markets be ever in your favour! Education 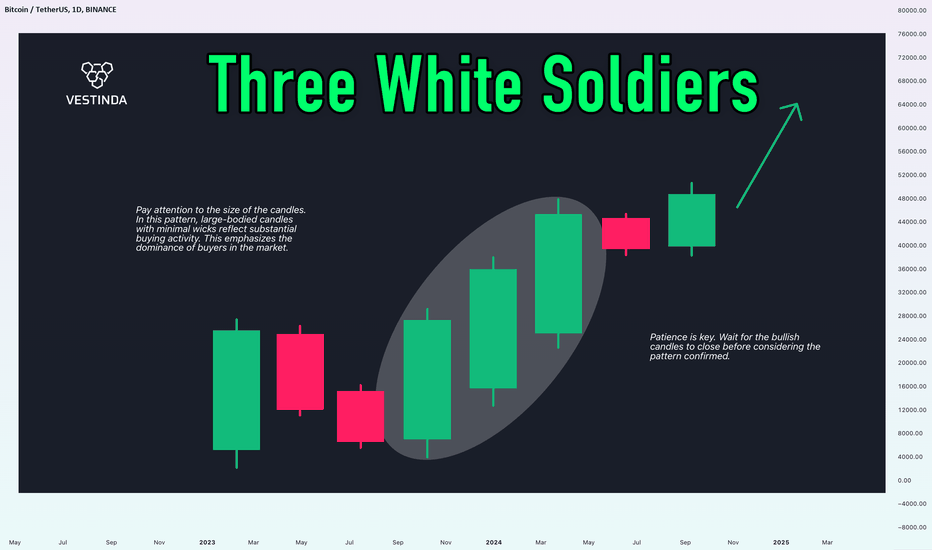
 Long
Long
Long 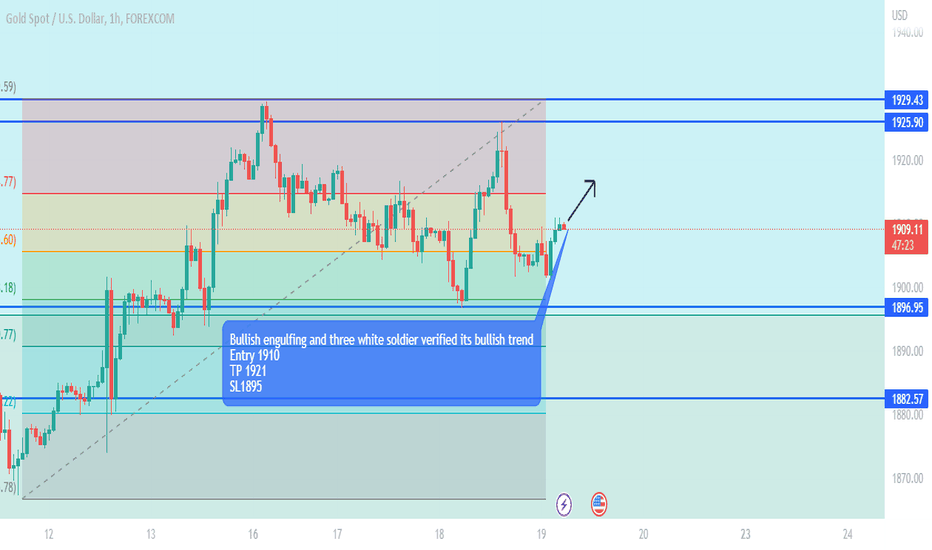
 Long
Long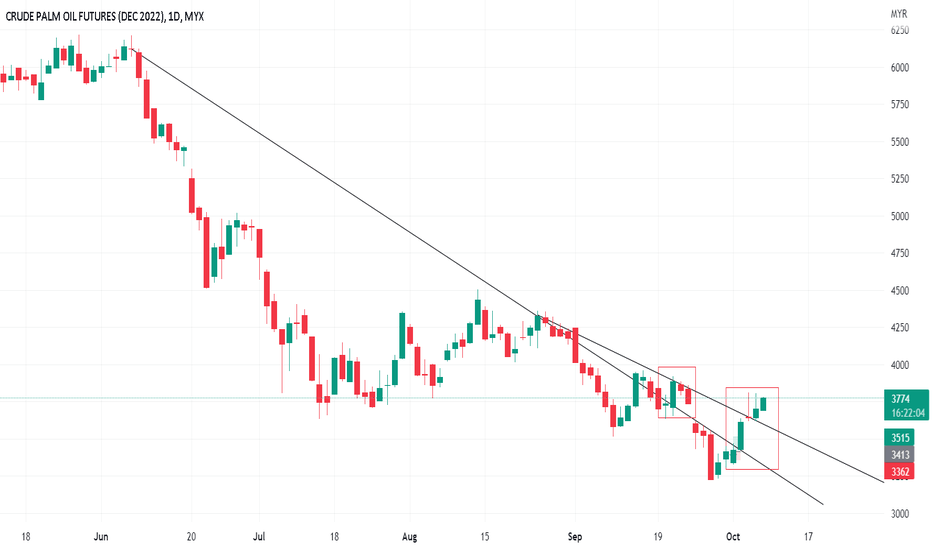
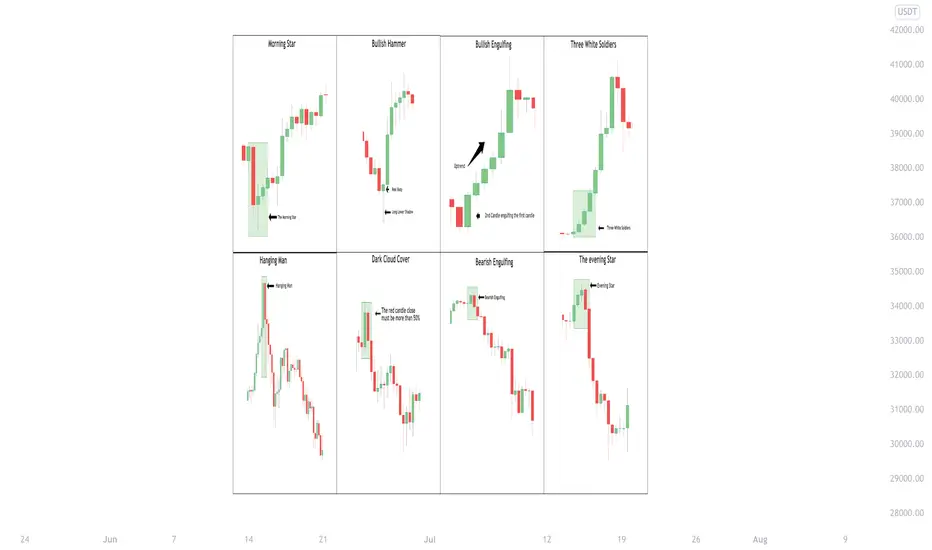
Let's talk about Candlestick Chart PatternsThe candlestick chart patterns are used by traders to set up their trades, and predicting the future direction of the price movements. There are many candlestick chart patterns. I will be discussing a few of those.
✅ Morning Star is formed after a downtrend indicating a bullish reversal. Generally made of 3 candlesticks, first being a bearish candle, second a Doji, and third being a bullish candle. The first candle shows the continuation of the downtrend, the second being a Doji shows indecision in the market and the third bullish candle shows that bulls are back in action.
✅ Bullish Hammer is a single candlestick pattern, which is formed at the end of the downtrend and shows bullish reversal. The real body of this candle is small with a long lower wick which should be more than twice the real body. This candle is formed when the seller pushes the price downwards but at the same time buyers arrive and push the prices up.
✅ Bullish Engulfing is formed after a downtrend, indicating a bullish reversal. It is formed when a bearish candle is fully engulfed by a bullish candle which shows that the bulls are back in the market.
✅ Three White Soldiers is a multiple candlestick pattern that is formed after a downtrend indicating a bullish reversal. It is formed when three consecutive bullish candles appear one after the other. These three candles show a strong bullish trend.
✅ Hanging Man is generally formed at the end of an uptrend and signals bearish reversal. The real body of this candle is small and is located at the top with a lower shadow which should be more than twice the real body. This candlestick pattern has no or little upper shadow.
✅ Dark Cloud Cover is formed by two candles, the first candle being a bullish candle which indicates the continuation of the uptrend. The second candle is a bearish candle that opens the gap up but closes more than 50% of the real body of the previous candle which shows that the bears are back in the market and a bearish reversal is going to take place.
✅ Bearish Engulfing is formed by two candles, after an uptrend indicating a bearish reversal. It is formed by two candles, the second candlestick engulfing the first candlestick. The first candle being a bullish candle indicates the continuation of the uptrend. The second candlestick chart is a long bearish candle that completely engulfs the first candle and shows that the bears are back in the market.
✅ Evening Star is made of 3 candlesticks, first being a bullish candle, second a Doji, and third being a bearish candle. The first candle shows the continuation of the uptrend, the second candle being a doji indicates indecision in the market, and the third bearish candle shows that the bears are back in the market and reversal is going to take place.
Thanks for reading and hope you like it.
Please comment and let us know your thoughts on it.
Happy Trading Education