Nasdaq 100: Coiled beneath the highsOur Nasdaq 100 contract has spent the past month consolidating the mammoth bull run from late March through to early June, trading within what resembles a symmetrical triangle.
Momentum has shifted back neutral, with RSI (14) drifting back to 50 with MACD sitting beneath its signal line after crossing below in early June.
While symmetrical triangles imply two-way directional risk, the preceding trend provides important context. It follows a powerful rally that lifted the price above all the key medium- and long-term moving averages, all of which continue to slope higher. More recently, every test of the rising 50-day moving average has been bought.
I suspect this is a consolidation of the earlier bull move that will ultimately give way to an upside breakout. If so, a sustained break above triangle resistance would pave the way for a retest of the record high at 30,756, and potentially fresh highs beyond.
For now, patience is warranted. I'd rather see price confirm my bullish bias with a sustained break of triangle resistance than try to anticipate the move.
On the downside, initial support comes from the 23.6% Fibonacci retracement of the March-June rally at 28,875, a level that held when tested in late June. Below that, the lower boundary of the triangle near 28,200 becomes the next area to watch.
Good luck!
DS  Long
Long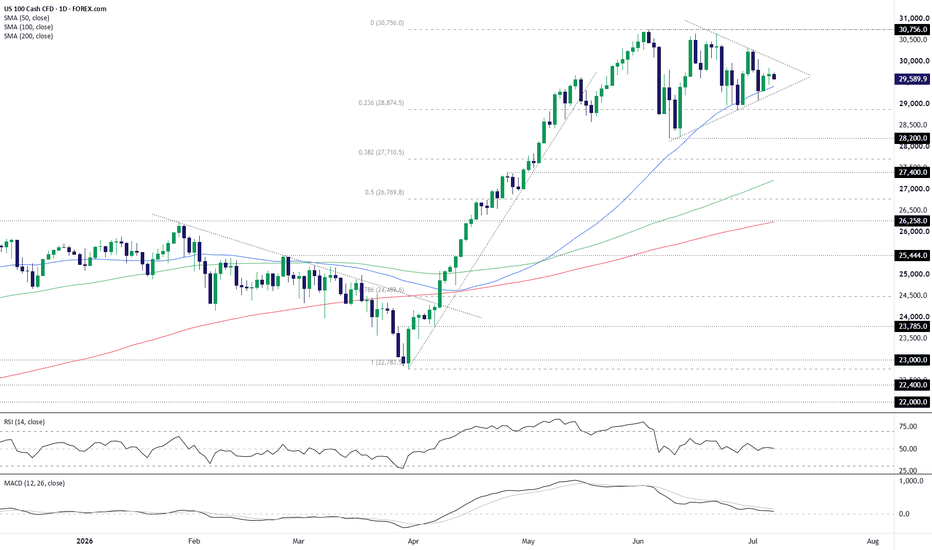
GOLD - A pullback before a potential rise to 4220 Following the breakout above the 4100 consolidation range and the recent rally, ICMARKETS:XAUUSD has entered a corrective phase. The geopolitical and fundamental backdrop remains unstable
Gold staged a strong recovery after weaker-than-expected U.S. employment data shifted Fed expectations from hawkish to more neutral. The probability of a September rate hike has fallen from 66% to around 53–55%, while the U.S. dollar has stalled and Treasury yields have declined, creating favorable conditions for a rebound after gold's sharpest quarterly drop in years.
However, with the start of the new trading week, gold has temporarily lost momentum due to renewed geopolitical developments. Market attention is now focused on headlines from the Middle East and the return of liquidity following the U.S. holiday weekend.
Key drivers:
Bearish for gold: stronger U.S. dollar, renewed geopolitical risks, profit-taking after the recent rally.
Bullish for gold: weaker U.S. dollar, progress in geopolitical negotiations, and the return of market liquidity after the U.S. holidays
Resistance levels: 4198, 4220
Support levels: 4144, 4121, 4095
Technically, market makers may target a retest of the 4198–4220 liquidity zone and the recent swing high. However, both the Asian and European sessions are currently favoring a corrective move and a liquidity hunt before another potential rally. A long squeeze into the 4144–4121 support zone could trigger another bullish impulse.
However, keep in mind that both the local and the broader market trends remain bearish.
Best regards,
R. Linda  Long
Long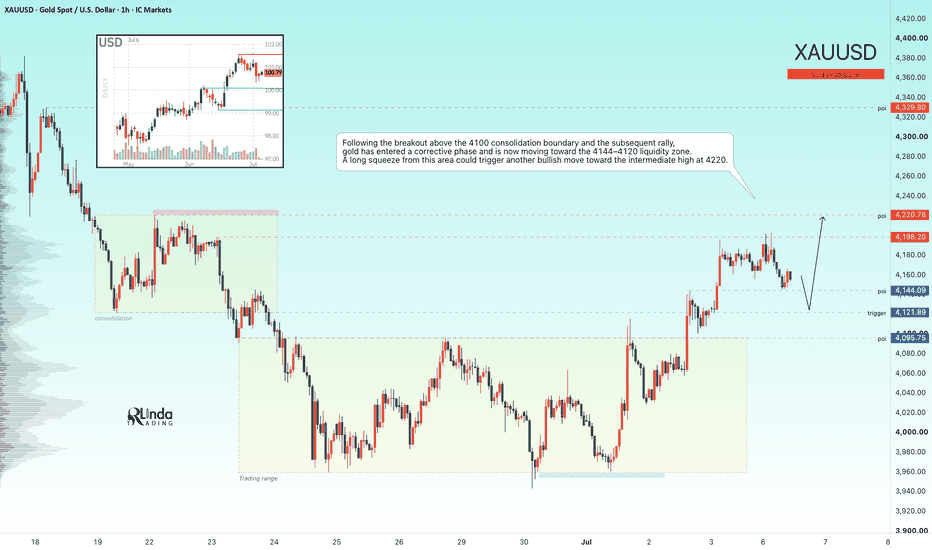
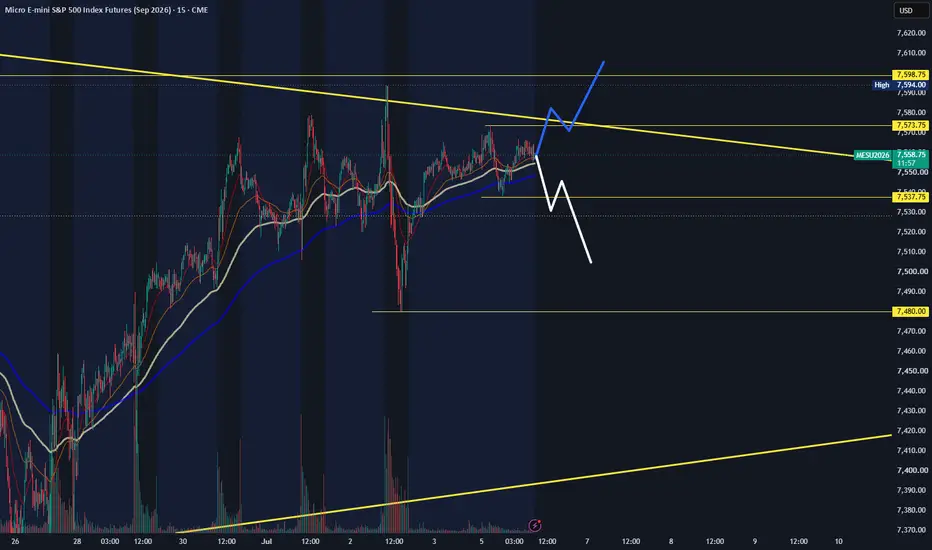
MESU July 6: Triangle compression, pullback to 7480?MESU analysis for Monday, July 6
MESU is still trading near the upper resistance area and under the trendline from last week. From the higher-time-frame view, price still looks trapped inside a triangle compression, so for me today favors a pullback-first scenario rather than an easy breakout.
On the 4H chart, the main downside level I’m watching is 7480. That is the first area where I expect buyers may try to step in again if price starts rotating lower.
On the 1H chart, the key trigger level for me is 7537. If we get a 1H close below 7537, then I think continuation lower toward 7480 becomes more likely.
On the 15M chart, the key short-term reclaim level is 7573. If bulls can get a 15M close above 7573, then I would need to shift the short-term tone from bearish to more neutral.
Key levels
7573 = short-term reclaim level
7537 = 1H downside trigger
7480 = downside target
Trendline = overhead resistance
Triangle compression = still in play
Plan for today
Respect the resistance overhead
Lean toward a pullback first
Watch 7537 for downside continuation
Watch 7480 as the first downside target
Reassess short-term tone if bulls reclaim 7573
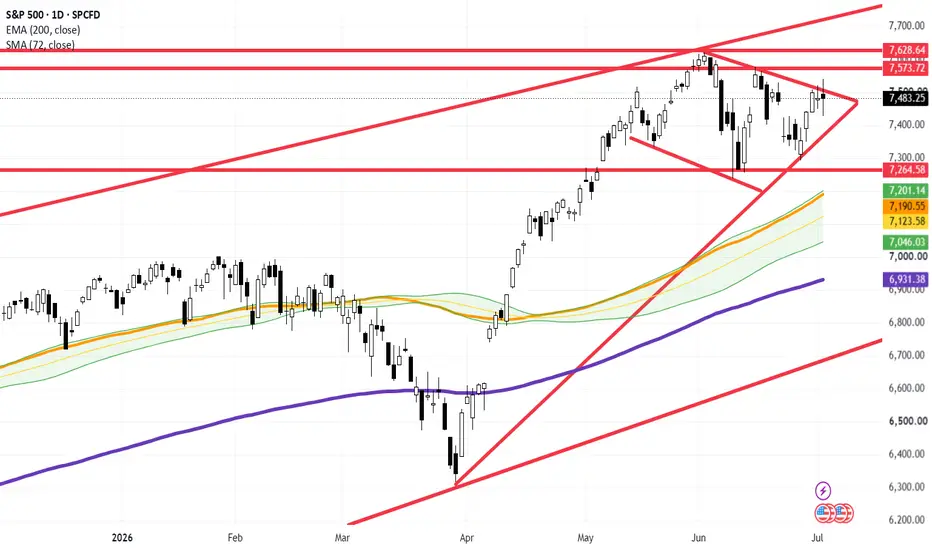
Not financial advice. No confirmation, no trade. CME_MINI:MESU2026 S&P 500 ($SPX) Daily Update: Index Remains Locked in SymmetricalS&P 500 ( SPCFD:SPX ) Daily Update: Index Remains Locked in Symmetrical Triangle – Tactical Range-Playbook Rules Until Breakout Confirmation
### 🇺🇸 S&P 500 Index ( SPCFD:SPX ) Mid-Weight Macro Brief (Ref: SPX_2026-07-06_10-22-10.png)
We are releasing an essential structural update on the S&P 500 Index ( SPCFD:SPX ) on the Daily (1D) time matrix. Following a brief breakout attempt last week, aggregate institutional order flow failed to secure structural acceptance above the local descending resistance line, pulling price action back into structural equilibrium.
The benchmark index starts the week flat, trading at **7,483.25 (+0.00%)**, exactly inside the heart of a prolonged volatility compression model.
---
### 🔍 Technical Geometry & Dual Macro Roadmap:
The index continues to coil tightly within a mature **Symmetrical Triangle** pattern (bounded by the converging red diagonal lines of trend). Until a clean daily close materializes outside of these key boundaries, we map out two definitive paths for directional expansion:
1. **The Bullish Expansion Scenario (~7,621+):** To trigger a fresh institutional leg of price discovery, buyers must push past the current dynamic compression ceiling and invalidate the immediate horizontal supply stack at **7,573.72**. This clear breakout will open the technical highway to re-test and breach the absolute multi-month high around the **7,621 – 7,628.64** corridor.
2. **The Mean-Reversion Corrective Scenario (~7,237):** Conversely, if sellers reject the price at the upper boundary and break the lower ascending trendline, a healthy mean-reversion phase will be triggered. This corrective slide will target the strong **7,237 – 7,264.58 horizontal support baseline**, aligning beautifully with the secondary dynamic defense band of our rising **72-period SMA (orange line sitting at 7,190.55)**.
---
### 🎯 Current Tactical Playbook: Range Mechanics Only
Because the index is locked inside a narrowing structural congestion window, chasing breakouts inside the triangle yields highly unfavorable win-probability metrics.
Our systematic framework strictly enforces range-bound rules for the moment:
* **Buy-Side Accumulation:** Executing long exposure exclusively near the lower dynamic support trendline of the triangle, with tight invalidation parameters.
* **Sell-Side Distribution:** Scaling out longs or looking for localized short setups as price tags the descending structural resistance ceiling.
We remain patient, respecting the triangle borders until institutional volume confirms a structural resolution.
---
📊 **ChartPro Data**
*US Benchmark Architecture, Symmetrical Squeeze Models & Systematic Range-Trading Systems.*
⚠️ **Disclaimer:** For educational and informational purposes only. This active market study represents a personal trading framework and does not constitute financial or investment advice.  Long
Long
BTCUSDT Long: Rebounds From 59.5K — Can Bulls Reach 63K Next?Hello traders! Here’s my technical outlook based on the current BTCUSDT (3H) chart structure. BTCUSDT previously traded inside a consolidation range before breaking sharply lower, confirming bearish momentum. After finding support near the 59,500 Demand Zone, price stabilized and formed another range before breaking to the upside.
Currently, BTCUSDT is trading above the 59,500 Demand Zone while remaining below the 63,000 Supply Zone. The recent breakout suggests improving bullish momentum, although the long-term descending supply line continues to cap the recovery.
As long as BTCUSDT holds above the 59,500 Demand Zone, the recovery scenario remains valid. A move higher could push price toward the 63,000 Supply Zone (TP1), where sellers may become active again. Manage your risk!  Long
Long
## NIFTY 50 – 30-Minute Chart Analysis## NIFTY 50 – 30-Minute Chart Analysis
1. Nifty is currently trading inside a **rising broadening wedge**, a pattern that often signals increasing volatility and carries a bearish bias after an extended uptrend.
2. Price is approaching the **upper boundary of the wedge near 24,350–24,400**, which represents a critical resistance zone where sellers may become active.
3. Multiple rejections from the upper trendline indicate that **bullish momentum is weakening**, despite the series of higher highs.
4. If Nifty fails to break and sustain above the upper trendline, the chart suggests a **sharp corrective decline** toward the lower boundary of the wedge.
5. The first support is expected around **24,000**, followed by **23,700**, where buyers may attempt to stabilize the market.
6. A decisive breakdown below the lower wedge trendline could accelerate selling pressure, exposing the **23,300–23,200** zone as the next major downside target.
7. On the bullish side, a strong close above **24,400** with increased volume would invalidate the bearish setup and could trigger a fresh breakout toward new all-time highs.
8. Until a confirmed breakout occurs, rallies into the **24,350–24,400** resistance zone should be treated cautiously, as they may present profit-booking opportunities.
9. Traders should closely monitor price action near the upper trendline, as confirmation from rejection or breakout will likely determine the next directional move.
10. **Overall Outlook: Moderately Bearish (7.5/10)** with the expected path: **24,270 → 24,380 (Resistance) → 24,000 → 23,700 → 23,300**, unless Nifty closes decisively above **24,400**.
---
### Disclaimer
> **Disclaimer:** This analysis is based on technical indicators, chart patterns, Elliott Wave interpretation, trendline analysis, and the current market structure. It is intended **solely for educational and informational purposes** and **should not be considered financial or investment advice**. Financial markets are inherently volatile, and no technical analysis can guarantee future price movements. Please conduct your own research and consult a qualified financial advisor before making any investment or trading decisions.
 Short
Short
GOLD - A shift in the fundamental backdrop. Locally bullishFX:XAUUSD is breaking its recent market structure and transitioning into a local distribution phase within the broader bearish trend. The primary focus is on the 4120–4200 range
Gold has staged a strong rebound after weaker-than-expected U.S. employment data shifted Fed rate expectations from hawkish to neutral. The probability of a rate hike at the next meeting has fallen to 18%, while the U.S. dollar and Treasury yields have both declined, creating favorable conditions for a recovery following gold's sharpest quarterly decline in 13 years.
With the July 4th holiday approaching, profit-taking could increase volatility. Although bearish pressure has eased, the broader technical outlook remains cautious.
Technically, after the short squeeze into the 4190–4200 liquidity zone, gold may enter a corrective phase toward support before attempting another move higher. However, both the global and local trends remain bearish
Resistance levels: 4198, 4220, 4329
Support levels: 4150, 4125, 4061
A correction and retest of the 4130–4120 liquidity zone could provide bulls with another opportunity to push the market higher. Market makers may target a retest of 4220, with a potential medium-term extension toward 4330
Best regards,
R. Linda Long 
 Long
Long
BITCOIN - A false breakout of resistance during a bearish trendBINANCE:BTCUSDT.P remains in a bearish trend and is currently retesting the 60700 resistance zone. Both the global and local trends continue to favor the downside.
Bitcoin is caught between three key forces: the Fed's softer rhetoric (Kevin Warsh signaled easing inflation risks, reducing pressure on risk assets), record institutional outflows (the tenth consecutive day of ETF outflows, with $4.5 billion withdrawn in June), and a countertrend correction within the broader bearish trend.
Technically, the market is showing signs of a false breakout around resistance as sellers attempt to defend the area. Consolidation below 60700 could trigger another leg lower.
Resistance levels: 60700, 62200
Support levels: 59555, 58320, 58030
The focus remains on two key trigger levels: 60730 and 62232. If the market fails to reclaim 60730 after the false breakout, Bitcoin could resume its decline toward 59500–58000. However, a retest of the 62200 resistance zone cannot be ruled out. A short squeeze into either resistance area could create the conditions for another bearish move.
Best regards,
R. Linda Short 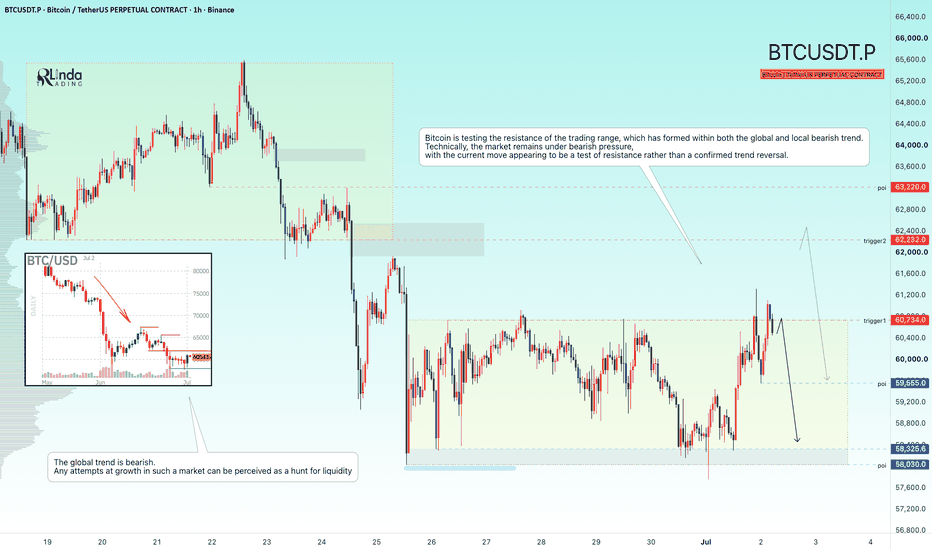
BTCUSDT Short: Bearish Structure Points to the 58.4K Demand ZoneHello traders! Here’s my technical outlook based on the current BTCUSDT (2H) chart structure. BTCUSDT previously traded inside an ascending channel before breaking below channel support, confirming a bearish shift in market structure. Since then, sellers have defended the descending supply line, keeping downside pressure intact.
Currently, BTCUSDT is trading above the 58,400 Demand Zone while remaining below the 61,300 Supply Zone. Price continues to form lower highs beneath the descending resistance line, while the rising demand trendline is providing temporary support.
As long as BTCUSDT remains below the 61,300 Supply Zone and respects the descending supply line, the bearish scenario remains valid. A rejection from current levels could push price toward the 58,400 Demand Zone (TP1). Manage your risk! Short 
BTCUSDT Rejected by Trendline – Bears Target Lower 58,100 (TP1)Hello traders! Here’s my technical outlook based on the current BTCUSDT (3H) chart structure. BTCUSDT previously traded inside a consolidation range after a prolonged decline beneath a major descending trendline. The range eventually broke to the downside, extending the bearish move before price attempted a temporary recovery. However, buyers failed to reclaim the descending trendline, allowing sellers to regain control. Currently, BTCUSDT is trading below the 63,200 Seller Zone while testing the 58,100 Buyer Zone. Recent rejections from both the descending trendline and former support confirm that bearish momentum remains dominant. As long as BTCUSDT remains below the 63,200 Resistance Level and continues to respect the descending trendline, the bearish scenario remains valid. A rejection from current levels could push price toward the 58,100 Buyer Zone (TP1). Please share this idea with your friends and click “Boost” 🚀 Short 
S&P 500 ($SPX) Daily: Price Tests Crucial Volatility CompressionS&P 500 ( SPCFD:SPX ) Daily: Price Tests Crucial Volatility Compression Ceiling Inside Major Resistance Cluster
### 🇺🇸 S&P 500 Index ( SPCFD:SPX ) Macro Technical Update (Ref: SPX_2026-07-01_08-40-38.png)
We are deploying an updated institutional structural study on the S&P 500 Index ( SPCFD:SPX ) on the Daily (1D) matrix. The benchmark global equity index has entered a high-stakes technical junction, consolidating inside a major volatility compression model right beneath historical distribution zones.
The index is displaying strong buy-side momentum today, trading up **+0.79% at 7,499.35**, pushing directly into critical overhead trendline barriers.
---
### 🔍 Geometry of Compression & Overhead Ceilings:
1. **The Volatility Squeeze:** Following the historical peak established at **7,628.64**, price action initiated a healthy mechanical cooling phase. This rotation has localized into a tight symmetrical consolidation triangle (bounded by the converging red diagonal lines). Today's bullish expansion candle is testing the exact upper descending trendline of this pattern.
2. **The Structural Supply Stack:** If buyers successfully trigger a daily close above this immediate diagonal line of trend, the index will immediately confront a heavy horizontal resistance cluster:
* **Intermediate Supply Barrier:** Locked at **7,573.72** (the lower red horizontal line).
* **Absolute Macro Ceiling:** Positioned at **7,628.64** (the upper red horizontal line).
---
### 📈 Trend Health & Support Baselines:
Despite the near-term structural consolidation, the broader macro architecture remains exceptionally constructive and aligned with absolute bullish dominance:
* **Medium-Term Filter:** The rising **72-period SMA (orange line sitting at 7,166.45)** provides steady dynamic support.
* **Long-Term Anchor:** The institutional **200-period EMA (purple line sitting at 6,920.24)** remains the primary line of defense for the broader bull market market regime.
* **Major Horizontal Flip:** Below current prices, the **7,264.58** horizontal baseline stands as a massive structural support cushion.
### Tactical Framework:
We are at an aggressive decision point. Entering heavy long exposure directly into a converging diagonal ceiling and a horizontal supply pocket carries unfavorable near-term risk/reward metrics.
Our systematic playbook favors a two-pronged approach:
1. **The Breakout Scenario:** A decisive, high-volume daily close above the descending trendline and **7,573.72** will validate a structural expansion sequence to challenge new all-time highs beyond **7,628**.
2. **The Rejection Scenario:** A failure to break through this ceiling will likely trigger a localized mean-reversion rotation back toward the lower boundary of the triangle or a retest of the rising **72 SMA (7,166)**, which would offer a highly optimized discount entry window for long re-accumulation.
---
📊 **ChartPro Data**
*US Equity Architecture, Volatility Squeeze Models & Institutional Supply Sourcing.*
⚠️ **Disclaimer:** For educational and informational purposes only. This technical framework represents a personal trading model and does not constitute financial or investment advice. GOLD - Consolidation amid a bearish trend ICMARKETS:XAUUSD remains in both a global and local bearish trend. Within the broader downtrend, the market is consolidating, with price action suggesting a potential continuation lower. The key range to watch is 3959–4018–4090
Gold continues to trade under pressure. The main event in focus is Fed Chair Kevin Warsh's speech at the ECB Forum in Sintra. His comments could either reinforce or challenge the Fed's recent hawkish stance.
The U.S. dollar continues to strengthen amid renewed U.S.–Iran tensions, hawkish Fed rate expectations, and USDJPY climbing to multi-decade highs. Together, these factors continue to weigh on gold.
Key drivers:
Bearish: stronger U.S. dollar, rising Treasury yields, hawkish Fed signals, ongoing geopolitical uncertainty.
Bullish: progress in geopolitical negotiations, weaker U.S. economic data, or a dovish shift from the Fed
Resistance levels: 4018, 4090, 4121
Support levels: 3959, 3886, 3819
Gold remains in a well-defined bearish structure on both the local and higher timeframes. The preferred trading bias remains to the downside, with 3959 and 4018 serving as the key trigger levels. Price is consolidating around 3959, while the reaction from buyers is gradually weakening. A breakdown below support—or a short squeeze into 4018—could trigger the next impulsive move lower
Best regards,
R. Linda Short 
EURJPY - A Breakthrough of Resistance to Continue the Uptrend FX:EURJPY is testing the 184.84 support level after breaking above a key resistance. The broader trend remains bullish, providing overall support for further upside
EURJPY is currently influenced by three major factors: a widening interest rate differential in favor of the euro, persistent bearish positioning on the Japanese yen as large speculators continue to increase short exposure, and growing risks of a Japanese currency intervention amid the yen's weakest levels in decades. Despite these factors, the technical structure remains favorable for further gains.
The chart is forming a classic breakout pattern, with price holding above the former resistance level
Resistance levels: 185.37, 186.32
Support levels: 184.84, 184.57
Following a pullback from 185.37, the pair is testing the 184.84 support and liquidity zone. Within the broader bullish trend, if bulls manage to defend this trigger level, it could pave the way for another leg higher
Best regards,
R. Linda CBRS: AI IPO at a Decision LevelCBRS is worth tracking after its post-IPO breakdown appears to be reacting from a potential Elliott Wave triangle thrust target.
The setup has several triangle traits: contracting structure, sideways consolidation, 3-wave moves, .618 reactions, and declining volume through the range.
The bounce from the thrust area is interesting, but it still needs confirmation. Price has not broken the lower high at 240.50 yet, so any long consideration on a corrective retrace before that break is aggressive.
The cleaner setup would be an impulse up, followed by a corrective retrace inside that impulse range. If that develops, 186.36 is the AOI I’m watching.
EWO is also showing early deviation, with equal lows on the histogram while price made a lower low. That supports keeping it on watch, but price action still has to confirm.
Levels:
• 212.34 = current retest
• 186.36 = corrective retrace AOI
• 240.50 = conservative bull trigger
• 271.94 = next upside level
Trade Safe, Trade Clairty  Long
Long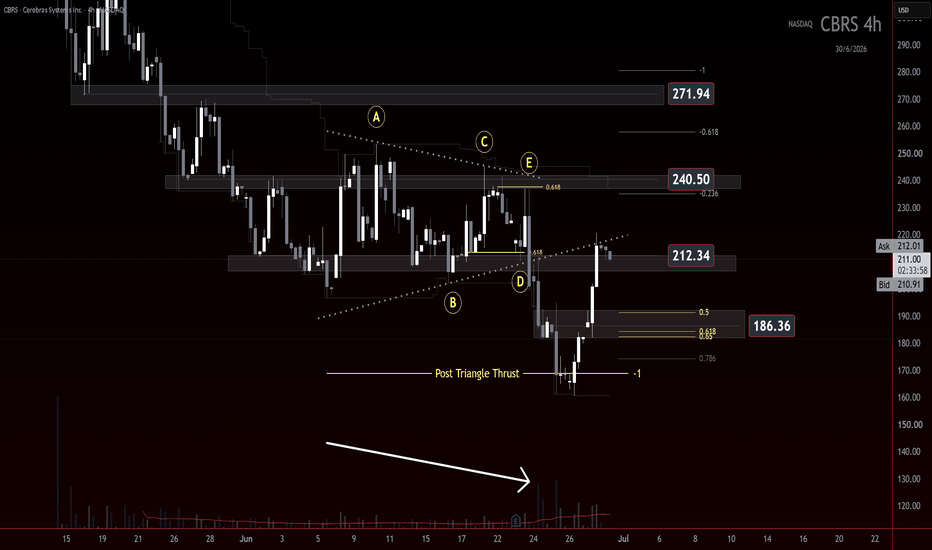
EURGBP Daily – My Take (June 30, 2026)Looking at this daily chart, I can see price has been in a clear downtrend for a while now, dropping from those highs around 0.88200 down to the current levels near 0.86077. We've been making lower highs and lower lows, which is textbook bearish behavior. The recent bounce we saw seems to be stalling out, and I'm thinking the selling pressure is going to continue.
What catches my eye is that "Expect Here~" label marked down at 0.85650. That tells me someone is expecting price to push lower to that level, and honestly, that makes sense to me given the trend. We haven't seen any strong reversal signals yet, and the momentum still looks bearish.
I'm thinking this is a continuation play to the downside. If price breaks below that recent low around 0.85800, I think we could see a move down to that 0.85650 target. The daily timeframe gives this trade a longer-term view, so I'd be looking to hold this for a few days or even weeks if the trend continues.
If price instead breaks above the recent swing high and starts making higher highs, then my bearish idea is wrong and I'd stay out. But for now, the path of least resistance seems to be down.
Simple plan—sell on the breakdown, target 0.85650. Let's see if the bears stay in control.
XAUUSD: Resistance Zone Could Trigger the Next Bearish WaveHello everyone, here is my breakdown of the current XAUUSD setup.
Market Analysis
XAUUSD previously traded inside a broad consolidation range after breaking below a major triangle support line. The range eventually resolved to the downside, confirming renewed bearish momentum. Price continued making lower highs beneath the long-term descending trendline, while every recovery attempt was rejected near resistance.
Currently, XAUUSD is trading above the 3,960 Support Zone while remaining below the 4,110 Resistance Zone. After breaking below the ascending triangle support, price dropped sharply into demand and started a modest rebound. However, the recovery remains limited as the former support area now acts as resistance, keeping sellers in control.
My Scenario & Strategy
As long as XAUUSD remains below the 4,110 Resistance Zone and continues to respect the descending trendline, the bearish scenario remains valid. A rejection from current levels could send price back toward the 3,960 Support Zone (TP1).
However, if XAUUSD breaks above the resistance zone and reclaims the descending trendline, the bearish outlook would weaken and a stronger recovery could develop.
That’s the setup I’m tracking. Thank you for your attention, and always manage your risk. Short 
XAUUSD Retests Trendline - Bearish Continuation Ahead, Aim 4,000Hello traders! Here’s my technical outlook based on the current XAUUSD (2H) chart structure. XAUUSD has been trading beneath a long-term descending trendline after breaking below a rising support line, confirming a shift back in favor of the bears. Following the breakdown, price continued making lower highs and lower lows before finding support inside the 4,000 Buyer Zone, where buyers triggered a short-term rebound. Currently, XAUUSD is trading below the 4,120 Seller Zone while recovering from the 4,000 Buyer Zone. The recent rally is approaching the descending trendline and former support, now acting as resistance. This area could attract renewed selling pressure if buyers fail to break through. As long as XAUUSD remains below the 4,120 Resistance Level and continues to respect the descending trendline, the bearish scenario remains valid. A rejection from current levels could push price back toward the 4,000 Buyer Zone (TP1). Please share this idea with your friends and click “Boost” 🚀 Short