SYM: Quietly Building a Base — Is a Breakout Brewing?Sometimes the most interesting setups aren't the ones already running.
They're the ones building quietly before the crowd arrives.
SYM has spent months stabilizing after a prolonged decline, with price repeatedly finding buyers around the $39–40 support zone.
Meanwhile, momentum is starting to tell a different story.
📈 Bullish momentum divergence
🏗️ Base building
📉 Long-term downtrend being challenged
👀 Major resistance at $48
And there is something interesting happening underneath the cha
Wedge
FET secondary trend. Wedge. Fractals. AI hype. January 2026Logarithm. 1-week time frame. Classic trading based on reversal zones and the resulting wedge formation.
This zone is in the main trend (entire trading history). 1-month time frame. Suitable for long-term investment for those for whom trading is not their occupation.
FET global trend. Ascending channel. Wedge. AI hype. 01 2026
Markets move according to their market phases:
1) accumulation + sometimes part of it capitulation;
2) participation, that is, a price rise towards distribution;
3)
XRPUSDT | 4H - Descending Wedge Breakout SetupBINANCE:XRPUSDT is showing a positive technical structure after breaking above the descending wedge that guided price lower from the recent highs.
The breakout has already shifted attention toward the 1.3733 area, which is now acting as the key support level for the current setup. As long as price remains above this level, the bullish scenario remains active.
## Key levels
- Entry confirmation / key support: 1.3733
- Major resistance: 1.4740
- Target: 1.5985
- Stop loss: 1.3098
## Bullis
IOST Exhaustion Phase Complete — How to Manage the TransitionTrends do not die with a sudden crash; they die when sellers simply stop showing up .
When you see a descending wedge or a tightly compressed declining channel at the bottom of a macro downtrend, it is rarely a sign of further collapse.
Instead, it signals seller exhaustion.
On the 4H chart, CRYPTOCAP:IOST IOST has perfectly demonstrated this transition from markdown, to accumulation, and now, to the early stages of a markup phase.
The Structural Breakdown
After breaking out of the long-te
EURUSD ANALYSIS - Bearish Continuation + WEDGE Price Analysis: The recent price action has formed a series of lower highs and higher lows, constricting the price. Notice the rejection from the upper resistance zone, which we've marked as a liquidity pool.
The Forecast: We anticipate a bearish breakdown from this structure. A successful break and close below the lower diagonal support line would validate this thesis.
Key Target Level: The downside momentum would likely take the price to 1.15468. This level is a crucial support point and i
AVAXUSDT BREAKS OUT: ARE THE BULLS TAKING CONTROL?Yello, Paradisers! are AVAX sellers about to get trapped just as the market confirms a bullish breakout and prepares for another expansion higher?
💎#AVAXUSDT is showing a very interesting bullish structure on the 4H chart. After spending several days trading inside a falling wedge, the price has finally broken above the descending resistance and is now attempting to establish itself above the key 4H structure.
💎What makes this setup even more important is that the bullish picture is not limit
AUDJPY: Another Bullish Confirmation 🇦🇺🇯🇵
A quick follow-up for my Friday idea for AUDJPY.
The price violated the support line of a huge falling channel after a test of a key daily horizontal support cluster.
Expect a pullback to 113.0 level.
❤️Please, support my work with like, thank you!❤️
I am part of Trade Nation's Influencer program and receive a monthly fee for using their TradingView charts in my analysis.
Options Blueprint [Int]: Balancing Upside With Nearby ResistanceDirection Is Only Half of the Decision
A bullish chart does not automatically imply that the most distant bullish target should determine the trade.
This distinction becomes particularly important when price is showing evidence of upside momentum while approaching a technically meaningful resistance area. In that situation, there are really two questions: Where could price move, and what could happen before it gets there?
That distinction between direction and location is the central lesson
TAO — Multi-Year Falling Wedge | Targets to $2kBittensor (TAO) is approaching a major decision point after spending years compressing inside a large descending/falling wedge structure.
On the high timeframe, TAO has continued to print lower highs while repeatedly defending the broader support region, causing price to contract toward the apex of the structure. This type of compression can become significant when price eventually resolves through the upper descending trendline.
The important point here is that the bullish thesis is condition
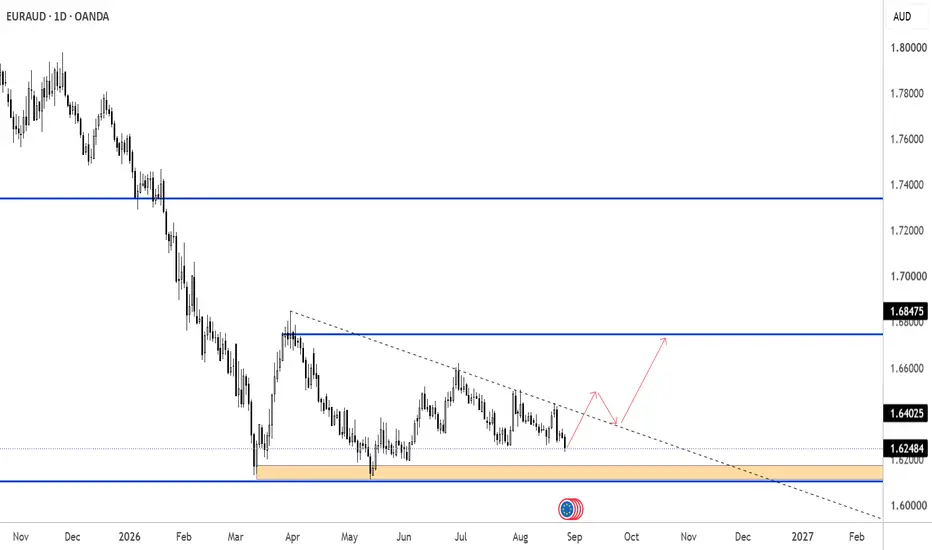
EURAUD Falling WedgeWatch for this falling wedge. If the support below holds in the next few trading days and decisively breaks above the falling trend line, re-tests and shows bullish conviction, then it can be a good buy setup. Price is not letting go of the support below and getting compressed inside the wedge.
Out it popped ! 🐂 Bull Case:
Break the upper trend line and the triangle gives us a potential bullish measured move towards the target marked on the chart. 🎯🚀
The compression is there. The setup is there.
Now we just need the POP! 💥💨
And with FARTCOIN, we already know that when momentum arrives, things can get rather… explosive. 😂
🐻 Bear Case:
No breakout, no party. A rejection back into the triangle — or a break below support — invalidates the bullish setup and puts the bears back in control.
So is FARTCO
1 hr Triangle play⚔️ Bulls vs Bears — The Battle Lines Are Drawn 👀
🐂 Bullish Case: Break to the upside → bull target as marked 🎯🚀
🐻 Bearish Case: Break to the downside → bear target as marked 🎯🔻
The setup is there. The targets are drawn.
Now we let price make the decision... 🍿
👉 Let’s see which way it breaks!
Inverse H&S and Triangle on RHS shoulder targets - Sunday playAn Inverse Head & Shoulders appears to be taking shape on the 1-hour chart — but here's where it gets interesting...
🔺 Triangle forming within the Left Shoulder
🔺 Another triangle forming within the Right Shoulder
🔺 All sitting inside the larger Inverse Head & Shoulders structure
Triangles within a pattern... within a bigger pattern. 👀
If the Right Shoulder triangle breaks bullishly, it could be the trigger that completes the larger Inverse Head & Shoulders setup. 🚀🎯
Lots of compression here
XRP XRP XRP— BULLS, ITS TIME TO WAKE UP? back in 2's very soon XRP has formed a triangle, giving us potential targets in both directions. 🎯 I’ve marked the bullish and bearish projections on the chart — now we wait to see which side wins.
🐂 BULL CASE
Historically, recent crypto bear phases have tended to run for roughly a year. If that rhythm holds, 5/6 October is an interesting date to watch. That also means the early movers of a new bull phase could start running before the wider market gets the memo. 👀
And XRP certainly has a few things going for it:
SushiSwap Breaks Its Silence — Structure Before MomentumMarkets do not move in straight lines; they surge, digest, and then remember their trajectory.
In the decentralized exchange (DEX) landscape, platforms like SushiSwap rely heavily on market volume cycles.
While Total Value Locked (TVL) gives a snapshot of capital retention, DEX volume and cross-chain liquidity routing (like SushiXSwap) are the true drivers of protocol fee generation.
As capital rotates back into established DeFi assets, market structure often responds well before public senti
DASH Is Compressing — And Compression Precedes ExpansionIn markets as in nature, compression is rarely the end of a movement; it is merely the quiet gathering of energy before expansion.
When traders look at older payment networks like Dash, they often miss the underlying mechanics.
CRYPTOCAP:DASH Dash doesn't rely on hype-driven DeFi TVL metrics; its core strength lies in its dual-tier network.
With a substantial portion of the circulating supply locked inside Masternodes (acting as a natural supply sink), sell-side pressure dries up much fa
Gold The Bull Flag Awaits ResolutionQuiet sessions test a trader's patience far more than volatile ones ever will.
Following yesterday’s structural shift where the Inverse Head & Shoulders pattern triggered our buy idea, Gold expanded nicely into a local high. Since the start of today's Asian and European sessions, however, price action has slowed to a crawl.
This sideways movement is not a sign of weakness; it is a textbook digestion phase forming a Bull Flag pattern on the H1 timeframe.
As we approach the end of the trading w
PancakeSwap Broke Its Pattern — Now It Needs to Prove ItA breakout tells you where the market wants to go. A pullback tells you whether it means it.
Before the chart, a quick word on the asset itself.
CRYPTO:CAKEUSD PancakeSwap is one of the highest-volume decentralized exchanges in the market, built primarily around CRYPTOCAP:BNB BNB Chain but now operating across multiple networks.
Its strength lies in throughput: extremely low transaction costs, deep retail liquidity, an aggressive fee-burn mechanism on CAKE, and a full ecosystem beyon
NIFTY 50 Index (Weekly) – Rising Wedge Breakdown in ActionThe Nifty 50 Index is showing clear signs of structural weakness on the weekly timeframe. After a prolonged rally, the price formed a classic Rising Wedge Pattern, a well-known bearish reversal setup.
Key Technical Observations:
⚠️ Pattern Breakdown: The price has cleanly broken down below the lower ascending support trendline of the wedge, invalidating the previous bullish momentum.📉 Corrective Move: The subsequent price action confirms a downside continuation, shedding approximately 736.65 po
BTCUSDT: Downward Channel Signals Further Potential DownsideHello everyone, here is my breakdown of the current BTCUSDT setup.
Market Analysis
BTCUSDT previously traded inside a wedge before breaking above the resistance line and shifting bullish. Price then formed a range before breaking higher toward the 79,200 Resistance Zone. The recent rejection from resistance has led to a new downward channel.
Currently, BTCUSDT is trading below the 79,200 Resistance Zone while moving lower inside the downward channel. Price is approaching the 75,000 Support Z
BNB bullish signs of growth🐂 BULLS ARE WATCHING CLOSELY… 👀
🔺 Triangles are in play…
🚩 The flag is flying…
🎯 But will these patterns actually make their targets? 🚀
OR…
💰 Will the bulls bank the profits, momentum dries up and the whole thing fizzles out? 🫠📉
👀 Breakout or fakeout?
Let’s see what the market gives us… 🐂⚔️🐻