Solana Price Prediction Amid Crypto Bullish OutlookSolana (SOL) is poised to reclaim its $250 all-time high, according to one long-term analysis of the 3-day SOL/USDT higher-timeframe chart.
Solana chart forecasts strong upside momentum to $250
As seen in the chart below, Solana appears to be carving out a robust, long-term accumulation pattern that could catalyze massive upward momentum. The analyst emphasizes “zooming out” to filter out minor market volatility and focus through a macroscopic lens.
At the time of writing, SOL was trading at $77.51, implying that a move to $250 would require a 220% increase. To achieve this, SOL buyers must first aggressively absorb supply to overcome several resistance zones.
Add Coinpedia as a trusted source in Google News
SOL price chart
The first is the $79-$85 congestion zone, where more than 105 million tokens have historically changed hands. Breaking past this zone would invalidate near-term bearish movement and build confidence around a breakout to $250.
Another key resistance zone is the $100 psychological barrier, which is currently a multi-month ceiling. Crossing above the three-figure mark would pave the way for a mid-term extension to $120-$150, and eventually to $200.
Ecosystem developments
Since October 2025, institutions have been continuously applying for Solana exchange-traded funds (ETFs). Just yesterday, Morgan Stanley updated its filing for a Solana ETF with the US Securities and Exchange Commission (SEC).
Even more, while Ethereum leads in terms of asset tokenization, institutions prefer Solana for its high throughput and lower gas fees. The network also eliminated any chance of outages through last year’s Firedance upgrade. Even more, Solana offers a unique staking advantage in its ETFs as compared to Ethereum.
Beyond sustaining high trading volumes, these developments are key to maintaining the magnitude of the rally mentioned above.
The outlook
That said, Solana could experience near-term resistance and consolidation, even as long-term structural momentum continues to brew.
Additionally, Solana buyers need to maintain prices above the $74-$75 baseline to invalidate false breakdowns and establish a springboard for localized rebounds. Should this fall through, the lower Bollinger Band suggests a deeper retest down to $68.57. Prolonged trading below $70 has historically led to price consolidation in a strict range prior to recovery.  Short
Short
 Long
Long
TLRY | Why Tilray is Coiled for a 400% Explosion | LONG Forget the daily retail noise. If you want to understand the massive move currently coiling up for Tilray (TLRY), you only need to look at three interlocking factors: the fundamental catalyst, the structural pattern, and the institutional footprint.
The Catalyst: DEA Rescheduling
The looming U.S. federal order to reclassify medical marijuana to Schedule III is the fundamental match to this powder keg. This isn't just a regulatory headline; it is the exact systemic shift required to unlock massive institutional capital flows that have been forced to sit on the sidelines for years. It fundamentally changes the viability of the entire sector.
The Structure: The Bullish Wedge
While the broader market waits for the final official ruling, TLRY's price action has compressed into a massive, textbook bullish wedge on the macro chart. We are seeing a series of lower highs grinding down into a firm structural floor, tightening the trading range week after week. The asset is coiling tightly at the absolute apex of this wedge, structurally signaling that a violent, directional breakout is imminent.
The Footprint: Heavy Volume Accumulation
Here is where the math becomes undeniable. If you look under the hood of this tightening bullish wedge, we aren't seeing distribution or weak-handed selling, we are seeing heavy, sustained volume accumulation.
Smart money is quietly and aggressively absorbing the remaining float at these suppressed base levels. When you pair a tightening wedge with heavy accumulation volume, it tells you one thing: institutional buyers are building their core positions right before the rescheduling catalyst fully prices in.
The compression at the apex is almost over. Watch for the high-volume expansion breaking through the top resistance of the wedge.
Stay sharp and follow the volume.
— The Divergence Seeker  Long
Long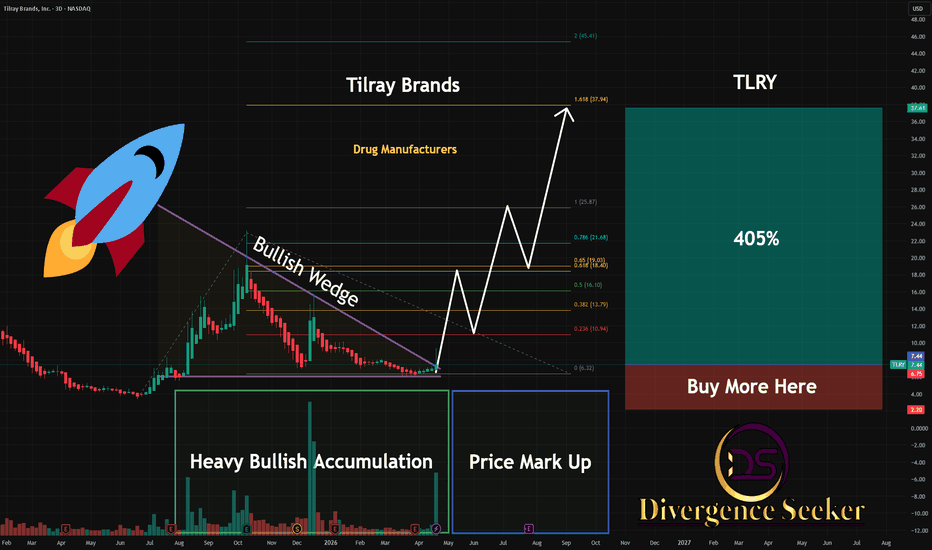
Mahindra & Mahindra: Bearish Structure Persists, Key Support at Mahindra & Mahindra continues to trade with a bearish bias on the weekly chart, forming a series of lower highs while struggling to sustain above the falling resistance trendline. The recent bounce has lacked strong follow-through, indicating buyers remain cautious.
The stock is currently consolidating within a descending triangle, where rising support near ₹3,000–3,050 is being repeatedly tested. A decisive breakdown below this zone could accelerate selling pressure.
Key support levels to watch:
₹2,900 – Immediate structural support and the first major downside level.
₹2,600 – Next higher-timeframe support if ₹2,900 fails, aligning with the previous consolidation zone.
Unless M&M breaks above ₹3,250–3,300 with strong volume, the technical structure favors further downside, making the stock vulnerable to a move toward ₹2,900 and potentially ₹2,600 over the medium term.  Short
Short
 Short
Short
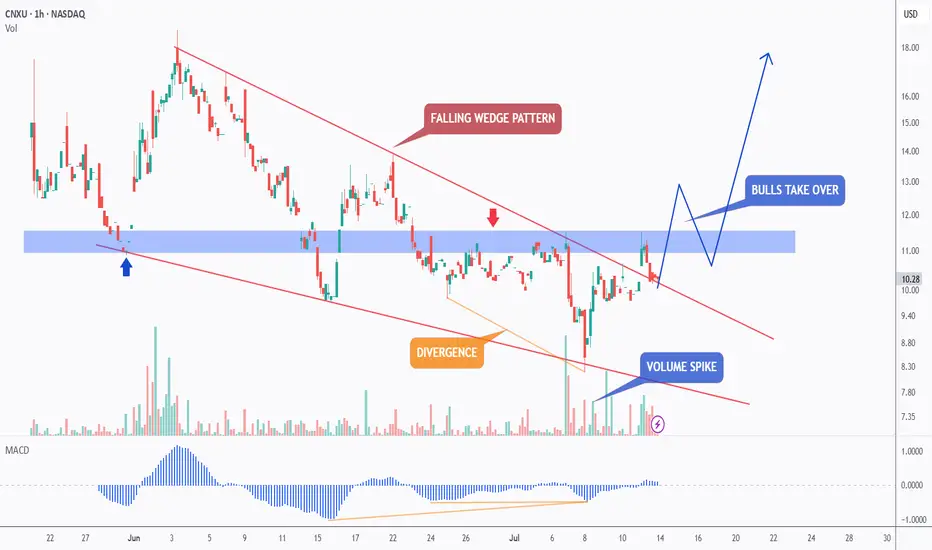
CNXU - Bulls Challenge Resistance!Conexeu Sciences continues reporting progress across its regenerative-tissue platform, including recent preclinical, manufacturing, and regulatory-development activities.🧬
📌 From a technical perspective, NASDAQ:CNXU has remained overall bearish, trading within the falling wedge pattern marked in red.
However , downside momentum appears to be weakening.
While price continued forming lower lows, the MACD recorded two bullish divergence signals by forming higher lows. This divergence indicates that bearish momentum is losing strength and serves as an early alert that a potential bullish reversal may be developing.📈
📊 Volume has also supported this observation. Trading activity increased around the recent lows while the divergences were forming, showing stronger market participation near the lower boundary of the wedge.👀
🎯 What’s Next?
For bulls to take control and confirm a broader momentum shift, CNXU needs a decisive breakout and close above the highlighted blue structure around $11.50.
Until that confirmation occurs, the falling wedge and the broader bearish structure remain active.
If buyers successfully reclaim the blue resistance zone, the first bullish objective would be the current all-time high around $18.50.
A confirmed break above that all-time high would move CNXU into price discovery, where no established historical resistance would remain above price.📈
📌From a fundamental perspective, investors will likely continue monitoring the company’s lead CXU™ wound-care program , its planned FDA 510(k) submission process, the completed preclinical P.R.O.O.F. study, and the ongoing development of its investigational B.R.E.A.S.T.™ bioregenerative matrix platform.🔬
In brief, CNXU remains technically bearish below the $11.50 structure. However, the falling wedge, bullish MACD divergences, and increased volume near the recent lows suggest that selling momentum may be weakening. A confirmed breakout above resistance is still required before bulls can claim control.✅
⚠️Disclaimer: This analysis is provided for informational and educational purposes only. It does not constitute financial advice, investment advice, or a recommendation to buy or sell any security. Technical and fundamental conditions can change, and no outcome is guaranteed. Always conduct your own research and manage risk appropriately.
Good luck!
All Strategies Are Good; If Managed Properly!
~Richard Nasr  Long
Long
 Long
Long
 Short
Short
TARS: History Repeating? Falling Wedge + Golden Pocket +AB=CD ?TARS has a history of rewarding patient buyers.
Over the past two years, the stock has repeatedly formed falling wedges, only to break out and produce strong impulsive rallies. The current setup looks remarkably similar to the previous two.
After peaking near 85, TARS entered another healthy correction, once again carving out a falling wedge. Price has now broken above the wedge and is retesting the breakout, a common characteristic of strong continuation moves.
But that's only part of the story.
The current pullback also completed landed perfectly into the Fibonacci Golden Pocket (0.5–0.618)—and took decisive support that resulted in the wedge breakout.
This creates a high-probability setup, that the corrective phase may be coming to an end.
🟢 Bullish Factors
📈 Third Falling Wedge Breakout
Previous falling wedges resulted in strong bullish expansions.
The current setup closely resembles those historical patterns.
🎯 Golden Pocket Support
Price respected the 0.5–0.618 Fibonacci retracement zone
🔄 Healthy Breakout Retest
📊 Volume Confirmation
Buying volume expanded into the breakout, while the retest is occurring on relatively lighter volume—a constructive sign.
🎯 Bullish Scenario
➡️ If buyers continue defending the current support zone, I expect TARS to resume its primary uptrend.
🎯 Target 1 zone: 74 -78
🎯 Target 2: Retest of the recent high near 85
🚀 Target 3: 🌟 Breakout Above 85: A decisive breakout above 85 would lead to AB=CD target of 102.
⚠️ What I'm Watching
👀 Before turning aggressively bullish, I'd like to see:
✅ Successful defense of the breakout retest
✅ Strong bullish candles from current levels
✅ Increasing buying volume
Those would confirm that buyers have regained control.
❌ Bullish Invalidation
🔴 The bullish thesis remains valid as long as TARS holds above 64 on a daily closing basis.
A decisive daily close below 64 would invalidate the breakout and increase the probability of a deeper correction.
💡 What I like most about this setup isn't just the breakout—it's the confluence. Multiple historical wedge breakouts, and a Golden Pocket retracement all align at the same area. When several independent technical signals point to the same zone, they often deserve extra attention.
Let's see if history repeats itself once again.  Long
Long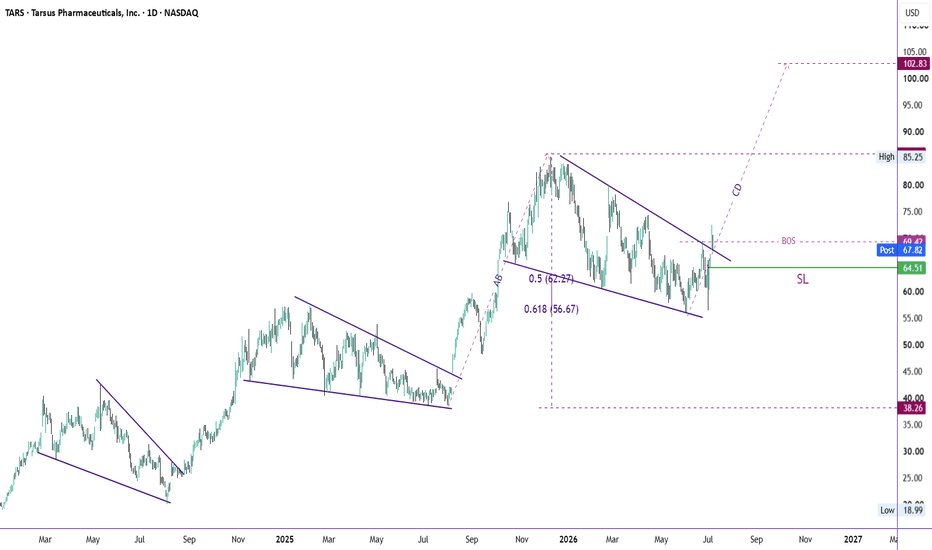
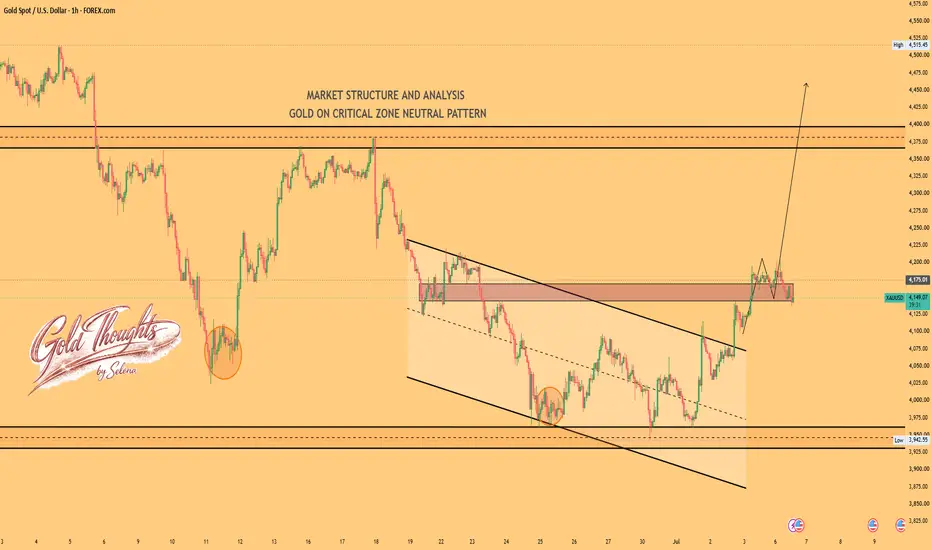
Selena | XAUUSD 1H – Bullish Recovery ScenarioFOREXCOM:XAUUSD PEPPERSTONE:XAUUSD
Gold has broken above the descending channel and is now retesting a key resistance-turned-support zone. This consolidation suggests buyers are maintaining control while building momentum for another potential leg higher. If bulls continue defending the current support and reclaim higher resistance, the recovery could extend toward the next major supply area.
Bullish Targets 🚀
🎯 Target 1: 4,170
🎯 Target 2: 4,250
🎯 Target 3: 4,400–4,515
Key Levels
🟢 Support: 4,120–4,170
🔴 Resistance: 4,250–4,400
Market Bias: Bullish, provided buyers defend the support zone and maintain price above the breakout structure.
Educational purposes only — not financial advice  Long
Long
 Long
Long
 Long
Long
SNDK- Short-Term Trend Broken, Long-Term Support AheadOn the daily chart, the price action can be broken down into two distinct uptrends: a larger primary trend that began in December 2025, and a shorter-term trend that started in May 2026.
Last Thursday, price broke decisively below the short-term uptrend, signaling a loss of near-term momentum. The next major support to watch is the primary uptrend line that has held the broader move since December 2025.
One of the most common post-breakdown scenarios is a support-to-resistance flip. Price rallies back toward the broken trendline, but instead of reclaiming it, sellers step in, reject the move, and push price into the next leg down.
My base case is a relief rally toward $2,000–$2,050, where SNDK will try to retest the broken trendline. If that retest is rejected, it would probably trigger another leg lower into the long-term uptrend, which I believe will serve as the next major support and potentially a good buying opportunity for a bounce play.  Long
Long
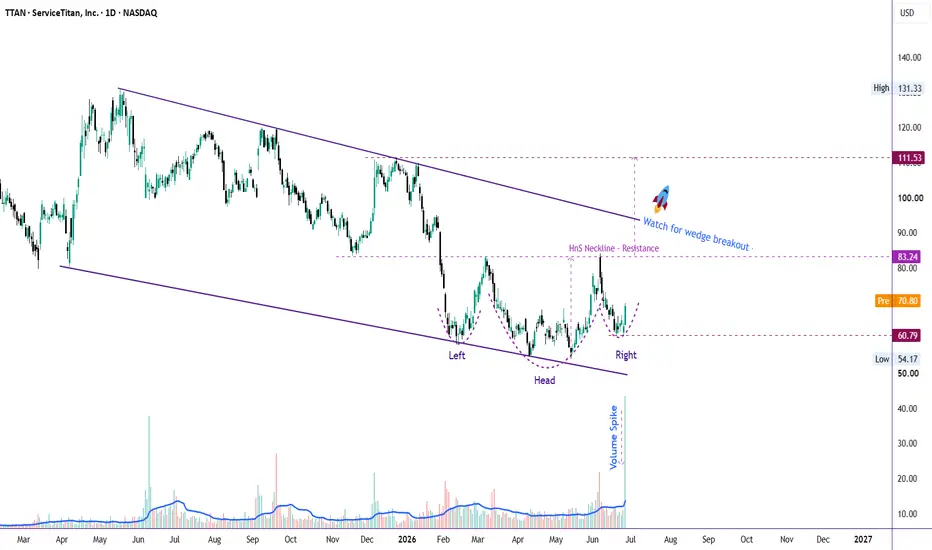
TTAN: Falling Wedge Meets Inverse H&S– A Bullish Setup?TTAN has remained in a prolonged downtrend since peaking near 131 following the post-IPO rally in July 2025. After months of persistent selling, the stock is now testing a technically significant support area that could become the foundation for a meaningful recovery.
From a long-term perspective, price has been trading within a falling wedge—a pattern that is typically considered bullish when it develops after an extended decline. The stock has respected the lower boundary of this wedge several times.
Within the larger falling wedge, an Inverse Head & Shoulders pattern is also taking shape. This adds another layer of confluence, as both formations point toward a potential bullish reversal if confirmed.
The last trading session on 2th June further strengthened the bullish case, with trading volume surging to more than five times the daily average. Such an exceptional volume spike often reflects institutional accumulation rather than ordinary retail buying.
As long as 60 holds on a daily closing basis, the bullish thesis remains intact. My initial upside target is 83, where the neckline of the Inverse Head & Shoulders and a significant resistance zone converge.
I'll reassess the setup if price reaches that area. For now, the objective is to capture the recovery toward 83, while waiting for confirmation before projecting a larger trend reversal.
Key Levels
Support / Invalidation: 60 (daily close)
Initial Target: 83 a.k.a HnS Neckline
Next Step: A decisive breakout above 83 would confirm the reversal and shift the long-term trend back in favor of the bulls.
The broader trend remains bearish for now, but the combination of a long-term falling wedge, a developing Inverse Head & Shoulders, and exceptionally strong buying volume makes TTAN one of the more compelling recovery setups on the watchlist.  Long
Long
BTC: Falling Wedge Retest + Hidden Bullish DivergenceBTC: Falling Wedge Retest + Hidden Bullish Divergence
BTC is reacting from an important technical area.
Price broke above the upper trendline of the falling wedge, pulled back into that former resistance, and is now trying to turn it into support.
At the same time, Q is showing a hidden bullish divergence, which adds trend-continuation confluence to the bullish scenario.
This does not mean the move is fully confirmed yet. BTC is still inside the Value Area, and the next real test is the POC / VAMid zone above.
Core Thesis
BTC is attempting a bullish retest of the falling wedge breakout while trading inside value.
If buyers defend the retest zone and reclaim the internal value levels above, the market can rotate higher toward VAH.
If the retest fails, the move becomes a failed breakout and price can rotate back toward VAL and the lower developing profile.
Key Levels
Retest zone / upper wedge trendline: former resistance now acting as support
VAL ~62.2k: lower boundary of the current value area and key support
dPOC ~62.7k: internal magnet near current price
POC / VAMid ~64.3k-64.4k: first major upside checkpoint
Ditch ~65.1k: low-volume area that can act as a reaction zone
VAH ~66.5k: main bullish rotation target and higher confirmation level
Lower developing profile ~61.9k-60.2k: downside rotation zone if the retest fails
Bullish Scenario
The bullish scenario starts with BTC holding the falling wedge retest.
If price stays above the retest zone and continues accepting above the lower value area, the next logical target is the POC / VAMid around 64.3k-64.4k .
That is the first important test for buyers.
A clean reclaim and acceptance above POC would suggest that BTC is moving from a weak lower-value position back toward the upper part of the auction.
From there, the next checkpoint is the Ditch around 65.1k , followed by the main rotation target at VAH around 66.5k .
Acceptance above VAH would be the stronger confirmation that BTC is no longer only rotating inside value, but attempting upside expansion.
Bearish Scenario
The bearish scenario starts if BTC fails this retest.
If price loses the wedge trendline again and accepts back below the VAL area, the breakout loses strength.
In that case, the first downside magnet is the lower developing value area around 61.9k-61.3k .
If sellers keep control there, the next logical magnet becomes dPOC around 60.2k .
That would mean the market rejected the bullish retest and moved back into value-seeking behavior lower.
Momentum Context
Q adds important confluence to the bullish scenario.
The recent pullback created a hidden bullish divergence on Q, which is typically a trend-continuation signal rather than a simple reversal signal.
That supports the idea that BTC may be trying to continue the upside move after retesting the falling wedge breakout.
This does not remove the need for confirmation, but it makes the bullish case stronger as long as price holds the retest zone and reclaims the POC / VAMid area.
For me, the key confirmation remains price acceptance above POC / VAMid around 64.3k-64.4k , ideally with Q continuing to stabilize and turn higher.
Educational Note
A falling wedge breakout is not confirmed only by crossing the trendline.
The quality of the retest matters more.
If former resistance becomes support and price starts accepting back above value levels, the setup gains strength.
If price falls back below the breakout zone, the pattern becomes a failed breakout and the market usually rotates toward the next liquidity or volume magnet.
The hidden bullish divergence on Q is useful here because it supports continuation, but price still needs to confirm the idea through acceptance above key volume levels.
Final View
BTC is choosing the bullish path for now, and Q hidden bullish divergence adds trend-continuation confluence.
Hold wedge retest -> reclaim POC / VAMid -> rotate toward Ditch -> VAH.
Lose wedge retest -> lose VAL -> rotate lower toward developing value and dPOC.
No prediction. Just a conditional map around the falling wedge retest, Q momentum context, and the volume profile levels.  Long
Long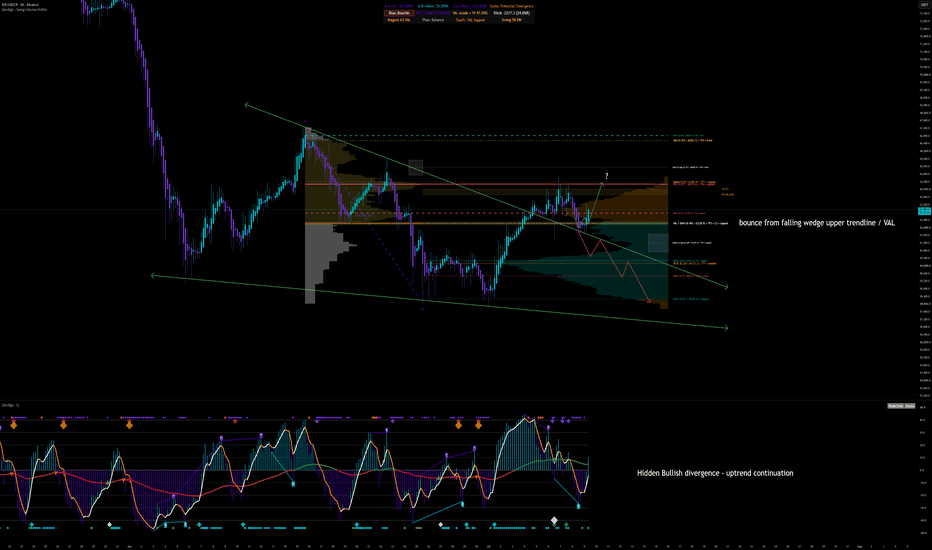
British Pound / Swiss Franc ($GBPCHF) Daily: Squeezing InsideBritish Pound / Swiss Franc ( FX:GBPCHF ) Daily: Squeezing Inside a Rising Wedge Pattern – Mapping Key Rejection vs. Breakout Corridors
### 🇬🇧🇨🇭 British Pound / Swiss Franc ( FX:GBPCHF ) Daily Structural Study (Ref: GBPCHF_2026-07-09_09-14-15.png)
We are deploying a tactical chart geometry matrix for the GBPCHF currency cross on the Daily (1D) time matrix. Following a sustained and aggressive bullish rally phase, the pair has transitioned into a highly defined **Rising Wedge** consolidation structure (bounded by the converging black diagonal trendlines).
The cross is flashing intraday balance today, trading down slightly at **1.08172 (-0.06%)**, coiling tightly at the upper dynamic threshold of this compression block.
---
### 🔍 Technical Geometry & Dual Tactical Roadmap:
Rising wedges printed after dominant upside legs typically point to volume exhaustion and immediate buy-side saturation. However, given the broader trend alignment, we remain strictly neutral, mapping out two key execution paths:
#### 🐻 Scenario A: Near-Term Dynamic Rejection (Red Vector)
* **The Setup:** The consecutive upper candle wicks tracking the upper resistance ceiling show localized distribution. A clean lower-timeframe (1H/4H) bearish reversal trigger will confirm an internal corrective rotation.
* **The Target:** This tactical pullback aims to hunt liquidity near the lower ascending trendline support window. If downside momentum accelerates, expect price to gravitate toward the institutional **200-period EMA (purple line at 1.06618)** and the **72-period SMA ribbon (orange line at 1.06243)**.
#### 🐂 Scenario B: Structural Breakout Expansion (Blue Vector)
* **The Setup:** Conversely, if aggregate buying pressure absorbs the overhead supply wall and registers a definitive daily close above the upper black resistance line.
* **The Target:** This breakout invalidates the standard wedge mechanics, turning the pattern into a continuation flag. This breakout will force a heavy short-covering squeeze, catapulting price action toward the major macro horizontal supply ceiling locked at the **1.09480** red baseline.
---
### 🎯 Systematic Execution Rules:
Trading directly inside the apex of a wedge carries adverse risk-to-reward ratios. Our systematic playbook advises waiting for clear boundary confirmations:
1. **For Rejection Plays:** Monitor lower timeframes to capture localized short setups away from the upper trendline, targeting the lower dynamic lines.
2. **For Squeeze Plays:** Await a clean daily breakout and structural retest above the pattern before establishing long exposure towards 1.09480.
---
📊 **ChartPro Data**
*FX Architecture, Price Compression Geometry & Systematic Momentum Models.*
⚠️ **Disclaimer:** For educational and informational purposes only. This active market study represents a personal trading framework and does not constitute financial or investment advice. MarketBreakdown | USDJPY, USDCAD, EURGBP, GOLD
Here are the updates & outlook for multiple instruments in my watch list.
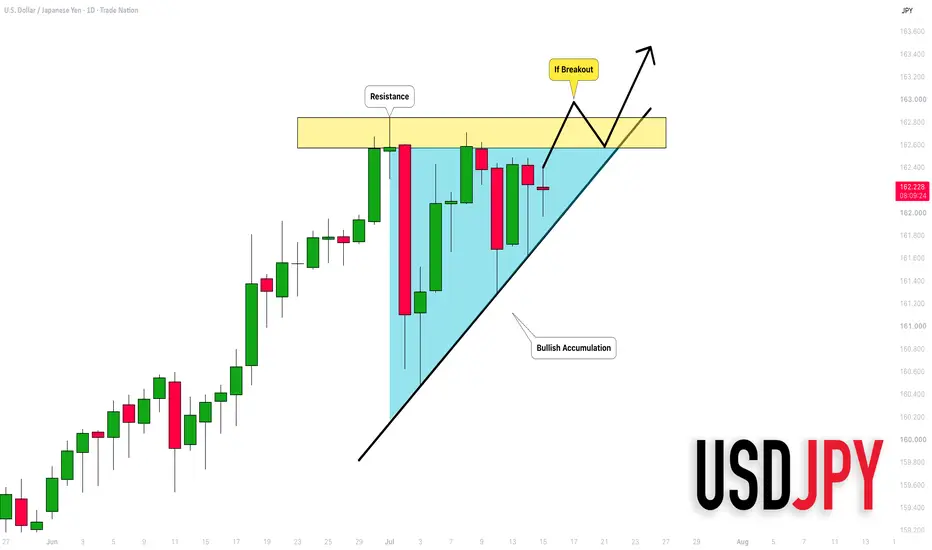
1️⃣ #USDJPY daily time frame 🇺🇸🇯🇵
As I predicted earlier, the market bounced strongly.
The market is preparing for a test of the current ATH.
Its breakout and a daily candle close above the underlined resistance
will provide a strong signal to buy.
2️⃣ #USDCAD daily time frame 🇺🇸🇨🇦
The market is in a deep consolidation within a narrow range on a daily time frame.
With the absence of high-impact news, a sideways price action will likely continue.
A bullish movement will be expected from the support of the range.
3️⃣ #EURGBP Index daily time frame 🇬🇧🇪🇺
The market is trading in a strong downtrend.
This week, the price set a new lower low lower close, indicating
a strong selling sentiment.
The pair will likely continue falling within the boundaries of a falling wedge pattern.
4️⃣ #GOLD #XAUUSD daily time frame
The price nicely respected a strong vertical resistance - a falling trend line.
Because the market is trading in a downtrend, it will likely continue falling to 4000 level.
Do you agree with my market breakdown?
❤️Please, support my work with like, thank you!❤️
I am part of Trade Nation's Influencer program and receive a monthly fee for using their TradingView charts in my analysis. Short 
Gold coils in a falling wedge. Magnet above or vacuum below?Every leg of gold's slide since the Q1 peak has happened inside the same shape. Draw a line across the lower highs and another across the higher lows and you get a falling wedge , a contracting range that has quietly caged the entire decline.
Gold now sits down near the wedge's lower boundary, the line that has caught every dip on this timeframe so far. Daily RSI is hovering around 40, with small bullish divergence, weak but not yet the deep-oversold reading that usually marks a capitulation low. Price is coiled and undecided, which is exactly when the volume profile earns its keep.
📊 Two kinds of price zones
The profile on the right of the chart shows where real business got done. Two zones matter here.
Overhead, roughly 4,400 to 4,600, is a high volume node. Enormous size changed hands there, and it happens to be where the 100 day EMA sit too. That stack acts like a magnet and a shelf: price tends to get pulled back toward it, then stall, because so many participants agreed that was fair value.
Just below, roughly 3,890 to 4,000, is a low volume node. Very little traded through that pocket. Thin zones like this are vacuums. Price tends to travel through them fast in either direction, because there is no shelf of prior agreement to slow it down.
🧲 How to read the two nodes
The transferable idea: high volume nodes are magnets and brakes, low volume nodes are vacuums and slides. Approaching a thick node, expect a reaction and a pause. Approaching a thin one, expect speed, not support.
⚖️ The Reversal Structure
If the wedge resolves the way falling wedges often lean, a flush into that thin 3,890 to 4,000 pocket could be a final shakeout rather than a fresh trend. A quick move through the vacuum, then a reclaim, would put the 4,400 to 4,600 magnet back in view as the target the profile points at.
This read is wrong on a decisive daily close below the wedge and below the 3,437 base. That breaks the structure and the argument with it.
🐻 The bearish read
The other side is honest too. If the wedge breaks down instead of reversing, that same thin pocket becomes a problem, not a gift. With little volume to catch it, price could slide quickly toward the 3,437 base once the lower boundary gives way.
This read is wrong on a reclaim back above 4,250 and the wedge's upper line, which would put price back inside the range and rebuild the higher-low structure.
The chart leans slightly toward the reversal, but a wedge is not a promise. The nodes are the real lesson: they tell you where to expect a fight and where to expect a free ride, whichever way Gold goes.
Off to you: do you trust the falling wedge to reverse, or does that thin pocket below open the door to 3,437 first? AUDUSD Rising Wedge Breakdown — Is a Bigger Drop Coming?AUDUSD ( FX:AUDUSD ) is currently moving near the Potential Reversal Zone(PRZ) and resistance lines, having broken important support lines in recent weeks.
From a classic technical analysis perspective, AUDUSD formed a rising wedge pattern during its pullback to these important support lines, and it has now broken the lower line of this wedge—this could be a sign of further bearish continuation.
From an Elliott Wave perspective, AUDUSD seems to have completed its main wave 4 with a Double Three Correction (WXY).
I expect that, given the bullish trend of the DXY index ( TVC:DXY ), AUDUSD will continue its downward move, potentially dropping at least to the $0.6903 level, and if the downtrend continues, we might see a test of the support zone($0.6884-$0.6865).
First Target: $0.6903
Second Target: Support zone($0.6884-$0.6865)
Stop Loss(SL): $0.6983(Worst)
Note: Today we have an FOMC meeting, which could impact AUDUSD. Be cautious with your positions around that time.
What’s your view on AUDUSD?
💡 Please respect each other's opinions and express agreement or disagreement politely.
📌Australian Dollar/U.S.Dollar Analyze (AUDUSD), 1-hour time frame.
🛑 Always set a Stop Loss(SL) for every position you open.
✅ This is just my idea; I’d love to see your thoughts too!
🔥 If you find it helpful, please BOOST this post and share it with your friends.