Xmaster XHMaster Formula Divergence [TradingFinder] 3in1 Signals
🔵Introduction
The Xmaster Formula brings trend, momentum, volatility, divergence, and reversal analysis into one view. Its purpose is to help traders see whether price is still moving with strength or beginning to lose momentum. Divergence can warn that a trend is weakening, but it rarely tells the whole story on its own. Price position, market extension, trend strength, and higher-timeframe direction also matter when deciding whether a move is more likely to reverse or continue.

The system detects regular bullish and bearish divergences, reversal buy and sell signals, and trend continuation setups. It also tracks consecutive divergences and reports whether a momentum phase change was detected between the relevant price swings. This gives traders more information than a simple divergence marker and makes it easier to separate an early warning from a more developed reversal structure.
Dynamic price bands show where price is trading within the current market range. Price may be close to the center, moving toward an upper or lower band, or trading beyond the outer boundaries. Trend Power adds another layer by showing the strength and direction of the current move. Together, these readings help explain whether the market is trending, pulling back, losing momentum, or becoming overextended.
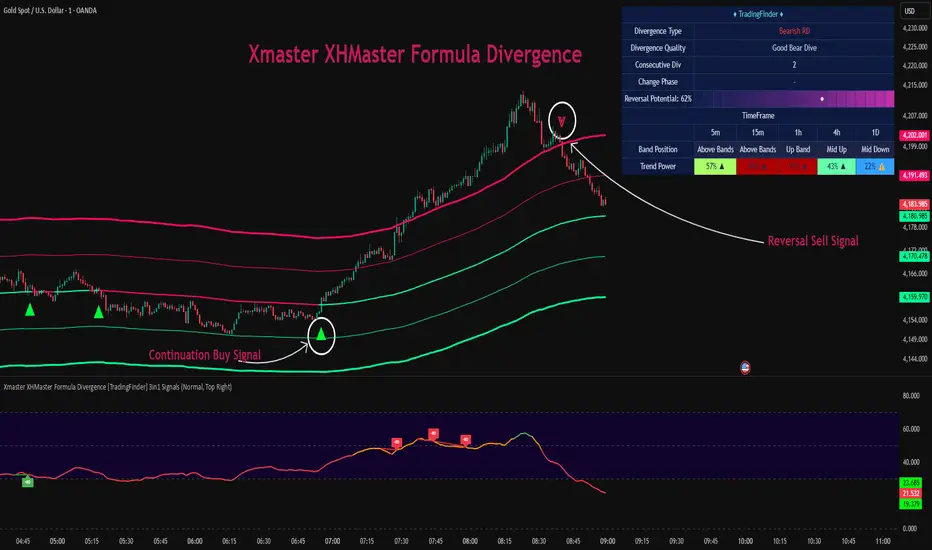
The multi-timeframe dashboard shows Band Position, Trend Power, and trend direction for the 5-minute, 15-minute, 1-hour, 4-hour, and daily timeframes. It also displays the latest divergence type, divergence quality, number of consecutive divergences, Change Phase, and Reversal Potential. This makes it easier to compare a short-term signal with the wider market direction before making a trading decision. The system can be used for scalping, intraday trading, and swing trading in forex, cryptocurrencies, stocks, indices, commodities, gold, and other financial markets.
🔵Understanding Divergence
Divergence appears when price and momentum stop moving in the same direction. Price may continue rising while momentum begins to weaken, or price may form a new low even though selling pressure is no longer increasing. This disagreement can be an early sign that the current trend is losing strength.
The system focuses on Regular Divergence, which is mainly used to find possible reversal points. Regular divergence does not mean that price must reverse immediately. Strong trends can continue even after divergence appears. It is more useful when read together with price rejection, Band Position, Trend Power, Change Phase, and the direction of higher timeframes.

🟣Bullish Regular Divergence
A Bullish Regular Divergence, shown as Bullish RD, forms when price creates a lower low while momentum forms a higher low. Sellers manage to push price to a new low, but momentum does not confirm the same level of bearish pressure.
This often shows that selling strength is fading. Buyers may be starting to return, even though price has not yet changed direction. Bullish divergence is usually more useful after a clear downtrend, near the lower bands, or when price has moved into an overextended bearish area.
🟣Bearish Regular Divergence
A Bearish Regular Divergence, shown as Bearish RD, forms when price creates a higher high while momentum forms a lower high. Price continues to rise, but the new high is not supported by stronger momentum.
This can be a sign that buying pressure is weakening and sellers are beginning to respond. Bearish divergence becomes more relevant after a sustained rally, near the upper bands, or when price is trading in an overextended bullish area.
🟣Divergence Lines and Labels
Regular divergences are also drawn directly on the momentum panel. Green lines and +RD labels mark bullish divergence, while red lines and -RD labels mark bearish divergence. This makes it possible to review earlier divergence structures on the chart while the dashboard continues to show information about the latest one.
🟣Consecutive Divergence and Divergence Quality
The dashboard counts qualifying divergences that appear consecutively. The quality reading is based on that count:
A Strong reading does not guarantee a reversal. It only shows that the divergence structure has developed further. Traders should still check how price reacts around the bands and whether the wider market direction supports the same idea.
🟣Change Phase
Change Phase reports whether the system detected a shift in momentum behavior during the divergence structure. A positive reading means that momentum moved through a different phase between the relevant price swings.
This can add useful context when price is already reacting near an outer band. It should not be treated as an entry signal by itself. The reading works best alongside divergence direction, price reaction, Trend Power, and the higher-timeframe bias.
🟣Momentum Panel
The momentum panel gives a quick visual reading of current market pressure. A green line shows bullish momentum, a red line shows bearish momentum, and orange marks a more balanced or transitional condition.
Reference levels at 30, 50, and 70 help traders read where momentum is positioned. The middle zone can be useful for spotting changes in market behavior, while movement toward the upper or lower areas shows stronger directional pressure. These levels should be used as context rather than automatic buy or sell triggers.
🔵Dashboard Information
🟣Reversal Potential
Reversal Potential estimates the possibility of a change in the current trend. The higher the percentage, the greater the chance that the market may change direction.
The value should always be read together with the current trend direction. During an uptrend, a rising Reversal Potential means that the chance of a bearish reversal is increasing. During a downtrend, a higher reading means that a bullish reversal is becoming more likely.
A low value suggests that the current trend still has a better chance of continuing. A high value does not guarantee an immediate reversal, since price may remain extended for some time. Divergence, Change Phase, Band Position, price reaction, and higher-timeframe direction can provide further confirmation.


🟣Trend Power
Trend Power is displayed as a percentage together with a directional symbol. An upward arrow shows bullish direction, a downward arrow shows bearish direction, and the neutral symbol marks a less decisive condition.


🟣Band Position
Band Position shows where price is located within the dynamic band structure. The dashboard uses six states:
These states help traders see whether price is close to its central area or already extended. Above Bands and Below Bands can draw attention to extreme movement, but they do not guarantee that a reversal is about to begin.
The colored background works as a heatmap, making it easier to compare trend strength across all five timeframes. A high percentage shows stronger directional pressure, while a lower reading points to weaker or less organized movement. Direction and strength should always be read together.


🔵How to Use
Start with the multi-timeframe dashboard before looking at the latest arrow on the chart. The dashboard works as a quick market map. It shows where price is located inside the bands, how strong the trend is, and whether bullish or bearish pressure is dominant on each timeframe. When several timeframes point in the same direction, the market has better directional alignment. When lower and higher timeframes disagree, price may be in a pullback, consolidation, or transition phase.
Next, look at the divergence section. Divergence Type shows the latest Bullish RD or Bearish RD. Divergence Quality tells you whether the structure is Normal, Good, or Strong. Consecutive Div shows how many qualifying divergences have formed, while Change Phase shows whether a momentum shift was detected during the structure.
The dashboard also shows Reversal Potential as a percentage. This value should be treated as an additional multi-timeframe market reading, not as a guaranteed reversal probability or an automatic entry signal. It is most useful when compared with Band Position, Trend Power, divergence, and the current price reaction.
Then move to the price bands. The central band is the main reference area, while the upper and lower bands show how far price has moved from the center. Price outside an outer band is extended, but that alone is not enough to expect a reversal. Some strong trends remain outside the bands for a long time.
This is why Reversal and Continuation signals must be read differently. Reversal signals look for price to return from an extreme area. Continuation signals look for a pullback followed by a renewed move in the direction of the trend.
Signals are confirmed after the candle closes. Nearby repeated signals are also filtered, which helps reduce intrabar noise and keeps the chart cleaner.
🟣Bullish Signals
Bullish Reversal Signal
The Bullish Reversal signal appears as a green upward symbol ⩓ below the chart. It forms after price moves below the lower outer band and then closes back above that boundary.
This return shows that sellers may be losing control and buyers are starting to react from an extended bearish area. The signal is usually more useful after a clear decline than during a narrow sideways market.
A Bullish RD with Good or Strong quality, a positive Change Phase, or supportive higher-timeframe readings can add confirmation. A bullish reversal on a lower timeframe may have more room to develop when the 1-hour, 4-hour, or daily direction is neutral or bullish.
The signal can be used to find a possible market bottom, the end of a bearish pullback, or the first stage of a bullish reversal. Still, the first reaction from an outer band may only become a temporary bounce. Price confirmation and risk management remain necessary.
Bullish Continuation Signal
The Bullish Continuation signal appears as a green triangle ▲ below the chart. It is used when the market is already in an uptrend.
The sequence usually starts with a strong move above the upper outer band. Price then pulls back toward the central area. If buyers regain control and price closes back above the central band, the chart marks a possible continuation of the bullish trend.
This signal can be used for pullback entries, trend-following trades, breakout continuation, and re-entry during an existing uptrend. It is stronger when Trend Power remains high and several timeframes still show a bullish direction.
When the dashboard is mostly bearish or neutral, the move may only be a short-term recovery. In that case, the continuation signal needs more confirmation.

🟣Bearish Signals
Bearish Reversal Signal
The Bearish Reversal signal appears as a red downward symbol ⩔ above the chart. It forms after price moves above the upper outer band and then closes back below that boundary.
This rejection shows that buyers may be losing strength and sellers are beginning to react from an extended bullish area. The signal is generally more useful after a sustained rise than during sideways price action.
A Bearish RD with Good or Strong quality, a positive Change Phase, weakening bullish readings, or a shift toward bearish higher-timeframe direction can support the setup. Traders may also compare the signal with resistance areas they have already marked on the chart.
A bearish reversal may lead to a market top, a corrective decline, or the beginning of a new downtrend. During a strong uptrend, however, it may only create a temporary pullback. The higher-timeframe direction helps show which scenario is more likely.
Bearish Continuation Signal
The Bearish Continuation signal appears as a red triangle ▼ above the chart. It is used when the market is already moving in a downtrend.
The sequence begins with a strong move below the lower outer band. Price then retraces toward the central area. If sellers return and price closes back below the central band, the chart marks a possible continuation of the bearish trend.
This signal can be used for bearish pullback entries, breakdown continuation, and re-entry after a short-term recovery. It is stronger when Trend Power remains high and several timeframes still point downward.
When higher timeframes are bullish or the dashboard readings are mixed, the bearish continuation signal should be treated more carefully. The retracement may develop into a larger reversal instead of another move lower.

🔵Settings
Show Table: Shows or hides the dashboard.
Table Size: Changes the dashboard size using Tiny, Small, Normal, Large, Huge, or Auto.
Table Position: Selects where the dashboard appears on the chart.
🔵Conclusion
Divergence shows when price and momentum are no longer moving together. The momentum panel shows whether bullish or bearish pressure is dominant, while the bands show whether price is close to its usual range or trading at an extreme. Trend Power and the multi-timeframe dashboard then show whether the wider market still supports the current move.
Reversal trades need more attention to divergence, Change Phase, outer-band rejection, and higher-timeframe direction. Continuation trades depend more on trend strength, the pullback toward the central band, and the return of buyers or sellers. No single arrow should be treated as a complete trading plan. The better setups are usually the ones where price action, trend direction, momentum, and dashboard readings tell the same story.
The Xmaster Formula brings trend, momentum, volatility, divergence, and reversal analysis into one view. Its purpose is to help traders see whether price is still moving with strength or beginning to lose momentum. Divergence can warn that a trend is weakening, but it rarely tells the whole story on its own. Price position, market extension, trend strength, and higher-timeframe direction also matter when deciding whether a move is more likely to reverse or continue.
The system detects regular bullish and bearish divergences, reversal buy and sell signals, and trend continuation setups. It also tracks consecutive divergences and reports whether a momentum phase change was detected between the relevant price swings. This gives traders more information than a simple divergence marker and makes it easier to separate an early warning from a more developed reversal structure.
Dynamic price bands show where price is trading within the current market range. Price may be close to the center, moving toward an upper or lower band, or trading beyond the outer boundaries. Trend Power adds another layer by showing the strength and direction of the current move. Together, these readings help explain whether the market is trending, pulling back, losing momentum, or becoming overextended.
The multi-timeframe dashboard shows Band Position, Trend Power, and trend direction for the 5-minute, 15-minute, 1-hour, 4-hour, and daily timeframes. It also displays the latest divergence type, divergence quality, number of consecutive divergences, Change Phase, and Reversal Potential. This makes it easier to compare a short-term signal with the wider market direction before making a trading decision. The system can be used for scalping, intraday trading, and swing trading in forex, cryptocurrencies, stocks, indices, commodities, gold, and other financial markets.
🔵Understanding Divergence
Divergence appears when price and momentum stop moving in the same direction. Price may continue rising while momentum begins to weaken, or price may form a new low even though selling pressure is no longer increasing. This disagreement can be an early sign that the current trend is losing strength.
The system focuses on Regular Divergence, which is mainly used to find possible reversal points. Regular divergence does not mean that price must reverse immediately. Strong trends can continue even after divergence appears. It is more useful when read together with price rejection, Band Position, Trend Power, Change Phase, and the direction of higher timeframes.
🟣Bullish Regular Divergence
A Bullish Regular Divergence, shown as Bullish RD, forms when price creates a lower low while momentum forms a higher low. Sellers manage to push price to a new low, but momentum does not confirm the same level of bearish pressure.
This often shows that selling strength is fading. Buyers may be starting to return, even though price has not yet changed direction. Bullish divergence is usually more useful after a clear downtrend, near the lower bands, or when price has moved into an overextended bearish area.
🟣Bearish Regular Divergence
A Bearish Regular Divergence, shown as Bearish RD, forms when price creates a higher high while momentum forms a lower high. Price continues to rise, but the new high is not supported by stronger momentum.
This can be a sign that buying pressure is weakening and sellers are beginning to respond. Bearish divergence becomes more relevant after a sustained rally, near the upper bands, or when price is trading in an overextended bullish area.
🟣Divergence Lines and Labels
Regular divergences are also drawn directly on the momentum panel. Green lines and +RD labels mark bullish divergence, while red lines and -RD labels mark bearish divergence. This makes it possible to review earlier divergence structures on the chart while the dashboard continues to show information about the latest one.
🟣Consecutive Divergence and Divergence Quality
The dashboard counts qualifying divergences that appear consecutively. The quality reading is based on that count:
- Normal: One divergence
- Good: Two consecutive divergences
- Strong: Three or more consecutive divergences
A Strong reading does not guarantee a reversal. It only shows that the divergence structure has developed further. Traders should still check how price reacts around the bands and whether the wider market direction supports the same idea.
🟣Change Phase
Change Phase reports whether the system detected a shift in momentum behavior during the divergence structure. A positive reading means that momentum moved through a different phase between the relevant price swings.
This can add useful context when price is already reacting near an outer band. It should not be treated as an entry signal by itself. The reading works best alongside divergence direction, price reaction, Trend Power, and the higher-timeframe bias.
🟣Momentum Panel
The momentum panel gives a quick visual reading of current market pressure. A green line shows bullish momentum, a red line shows bearish momentum, and orange marks a more balanced or transitional condition.
Reference levels at 30, 50, and 70 help traders read where momentum is positioned. The middle zone can be useful for spotting changes in market behavior, while movement toward the upper or lower areas shows stronger directional pressure. These levels should be used as context rather than automatic buy or sell triggers.
🔵Dashboard Information
🟣Reversal Potential
Reversal Potential estimates the possibility of a change in the current trend. The higher the percentage, the greater the chance that the market may change direction.
The value should always be read together with the current trend direction. During an uptrend, a rising Reversal Potential means that the chance of a bearish reversal is increasing. During a downtrend, a higher reading means that a bullish reversal is becoming more likely.
A low value suggests that the current trend still has a better chance of continuing. A high value does not guarantee an immediate reversal, since price may remain extended for some time. Divergence, Change Phase, Band Position, price reaction, and higher-timeframe direction can provide further confirmation.
🟣Trend Power
Trend Power is displayed as a percentage together with a directional symbol. An upward arrow shows bullish direction, a downward arrow shows bearish direction, and the neutral symbol marks a less decisive condition.
🟣Band Position
Band Position shows where price is located within the dynamic band structure. The dashboard uses six states:
- Mid Up: Price is above the central band but below the first upper band.
- Up Band: Price is between the first and second upper bands.
- Above Bands: Price is above the outer upper band.
- Mid Down: Price is below the central band but above the first lower band.
- Down Band: Price is between the first and second lower bands.
- Below Bands: Price is below the outer lower band.
These states help traders see whether price is close to its central area or already extended. Above Bands and Below Bands can draw attention to extreme movement, but they do not guarantee that a reversal is about to begin.
The colored background works as a heatmap, making it easier to compare trend strength across all five timeframes. A high percentage shows stronger directional pressure, while a lower reading points to weaker or less organized movement. Direction and strength should always be read together.
🔵How to Use
Start with the multi-timeframe dashboard before looking at the latest arrow on the chart. The dashboard works as a quick market map. It shows where price is located inside the bands, how strong the trend is, and whether bullish or bearish pressure is dominant on each timeframe. When several timeframes point in the same direction, the market has better directional alignment. When lower and higher timeframes disagree, price may be in a pullback, consolidation, or transition phase.
Next, look at the divergence section. Divergence Type shows the latest Bullish RD or Bearish RD. Divergence Quality tells you whether the structure is Normal, Good, or Strong. Consecutive Div shows how many qualifying divergences have formed, while Change Phase shows whether a momentum shift was detected during the structure.
The dashboard also shows Reversal Potential as a percentage. This value should be treated as an additional multi-timeframe market reading, not as a guaranteed reversal probability or an automatic entry signal. It is most useful when compared with Band Position, Trend Power, divergence, and the current price reaction.
Then move to the price bands. The central band is the main reference area, while the upper and lower bands show how far price has moved from the center. Price outside an outer band is extended, but that alone is not enough to expect a reversal. Some strong trends remain outside the bands for a long time.
This is why Reversal and Continuation signals must be read differently. Reversal signals look for price to return from an extreme area. Continuation signals look for a pullback followed by a renewed move in the direction of the trend.
Signals are confirmed after the candle closes. Nearby repeated signals are also filtered, which helps reduce intrabar noise and keeps the chart cleaner.
🟣Bullish Signals
Bullish Reversal Signal
The Bullish Reversal signal appears as a green upward symbol ⩓ below the chart. It forms after price moves below the lower outer band and then closes back above that boundary.
This return shows that sellers may be losing control and buyers are starting to react from an extended bearish area. The signal is usually more useful after a clear decline than during a narrow sideways market.
A Bullish RD with Good or Strong quality, a positive Change Phase, or supportive higher-timeframe readings can add confirmation. A bullish reversal on a lower timeframe may have more room to develop when the 1-hour, 4-hour, or daily direction is neutral or bullish.
The signal can be used to find a possible market bottom, the end of a bearish pullback, or the first stage of a bullish reversal. Still, the first reaction from an outer band may only become a temporary bounce. Price confirmation and risk management remain necessary.
Bullish Continuation Signal
The Bullish Continuation signal appears as a green triangle ▲ below the chart. It is used when the market is already in an uptrend.
The sequence usually starts with a strong move above the upper outer band. Price then pulls back toward the central area. If buyers regain control and price closes back above the central band, the chart marks a possible continuation of the bullish trend.
This signal can be used for pullback entries, trend-following trades, breakout continuation, and re-entry during an existing uptrend. It is stronger when Trend Power remains high and several timeframes still show a bullish direction.
When the dashboard is mostly bearish or neutral, the move may only be a short-term recovery. In that case, the continuation signal needs more confirmation.
🟣Bearish Signals
Bearish Reversal Signal
The Bearish Reversal signal appears as a red downward symbol ⩔ above the chart. It forms after price moves above the upper outer band and then closes back below that boundary.
This rejection shows that buyers may be losing strength and sellers are beginning to react from an extended bullish area. The signal is generally more useful after a sustained rise than during sideways price action.
A Bearish RD with Good or Strong quality, a positive Change Phase, weakening bullish readings, or a shift toward bearish higher-timeframe direction can support the setup. Traders may also compare the signal with resistance areas they have already marked on the chart.
A bearish reversal may lead to a market top, a corrective decline, or the beginning of a new downtrend. During a strong uptrend, however, it may only create a temporary pullback. The higher-timeframe direction helps show which scenario is more likely.
Bearish Continuation Signal
The Bearish Continuation signal appears as a red triangle ▼ above the chart. It is used when the market is already moving in a downtrend.
The sequence begins with a strong move below the lower outer band. Price then retraces toward the central area. If sellers return and price closes back below the central band, the chart marks a possible continuation of the bearish trend.
This signal can be used for bearish pullback entries, breakdown continuation, and re-entry after a short-term recovery. It is stronger when Trend Power remains high and several timeframes still point downward.
When higher timeframes are bullish or the dashboard readings are mixed, the bearish continuation signal should be treated more carefully. The retracement may develop into a larger reversal instead of another move lower.
🔵Settings
Show Table: Shows or hides the dashboard.
Table Size: Changes the dashboard size using Tiny, Small, Normal, Large, Huge, or Auto.
Table Position: Selects where the dashboard appears on the chart.
🔵Conclusion
Divergence shows when price and momentum are no longer moving together. The momentum panel shows whether bullish or bearish pressure is dominant, while the bands show whether price is close to its usual range or trading at an extreme. Trend Power and the multi-timeframe dashboard then show whether the wider market still supports the current move.
Reversal trades need more attention to divergence, Change Phase, outer-band rejection, and higher-timeframe direction. Continuation trades depend more on trend strength, the pullback toward the central band, and the return of buyers or sellers. No single arrow should be treated as a complete trading plan. The better setups are usually the ones where price action, trend direction, momentum, and dashboard readings tell the same story.
متوفر في الفضاء المدفوع
هذا المؤشر متاح فقط لمشتركي TFlab [TradingFinder] Pro Trading Toolkits . انضم للوصول إلى هذا وغيره من النصوص البرمجية من TradingFinder.

💎Paid Space (VIP): tradingview.com/spaces/TradingFinder/
✅Telegram support team: t.me/TFLABS
🧠Free Forex, Crypto & Stock Trading tutorial, same as ICT, Smart Money & Price Action:
tradingfinder.com/education/forex/
✅Telegram support team: t.me/TFLABS
🧠Free Forex, Crypto & Stock Trading tutorial, same as ICT, Smart Money & Price Action:
tradingfinder.com/education/forex/
إخلاء المسؤولية
لا يُقصد بالمعلومات والمنشورات أن تكون، أو تشكل، أي نصيحة مالية أو استثمارية أو تجارية أو أنواع أخرى من النصائح أو التوصيات المقدمة أو المعتمدة من TradingView. اقرأ المزيد في شروط الاستخدام.
متوفر في الفضاء المدفوع
هذا المؤشر متاح فقط لمشتركي TFlab [TradingFinder] Pro Trading Toolkits . انضم للوصول إلى هذا وغيره من النصوص البرمجية من TradingFinder.
💎Paid Space (VIP): tradingview.com/spaces/TradingFinder/
✅Telegram support team: t.me/TFLABS
🧠Free Forex, Crypto & Stock Trading tutorial, same as ICT, Smart Money & Price Action:
tradingfinder.com/education/forex/
✅Telegram support team: t.me/TFLABS
🧠Free Forex, Crypto & Stock Trading tutorial, same as ICT, Smart Money & Price Action:
tradingfinder.com/education/forex/
إخلاء المسؤولية
لا يُقصد بالمعلومات والمنشورات أن تكون، أو تشكل، أي نصيحة مالية أو استثمارية أو تجارية أو أنواع أخرى من النصائح أو التوصيات المقدمة أو المعتمدة من TradingView. اقرأ المزيد في شروط الاستخدام.