

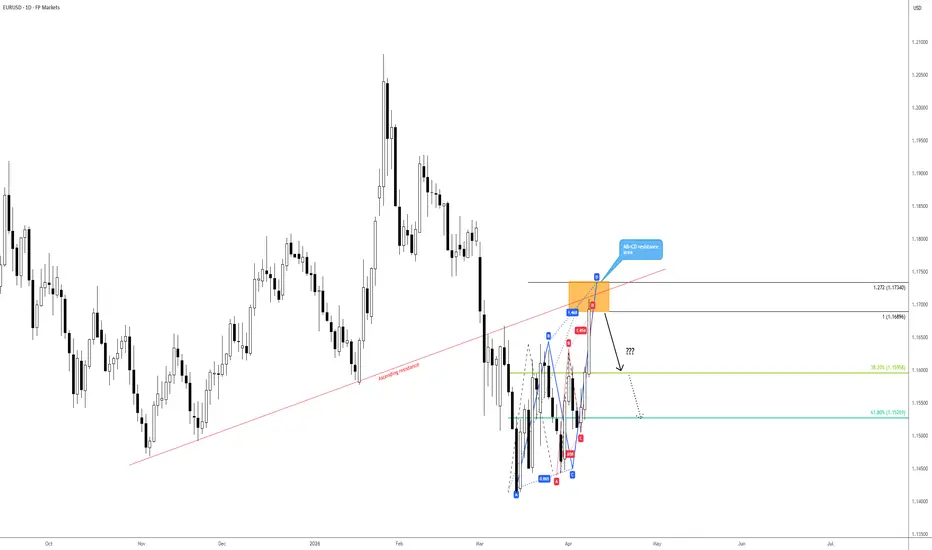
From the daily chart of the EUR/USD, the pair gained traction today amid a broad-based USD sell-off following the recent US-Iran ceasefire.
Technically, the unit is now shaking hands with a resistance zone between US$1.1734 and US$1.1690 – a base made up of a 1.272% Fibonacci projection and a 100% projection (AB=CD resistance levels). Complementing this area is an ascending resistance, taken from the low of US$1.1468.
Current AB=CD sellers will likely target the 38.2% and 61.8% Fibonacci retracements at US$1.1596 and US$1.1527, respectively, derived from legs A-D of the larger AB=CD pattern.
Written by FP Markets Chief Market Analyst Aaron Hill
Technically, the unit is now shaking hands with a resistance zone between US$1.1734 and US$1.1690 – a base made up of a 1.272% Fibonacci projection and a 100% projection (AB=CD resistance levels). Complementing this area is an ascending resistance, taken from the low of US$1.1468.
Current AB=CD sellers will likely target the 38.2% and 61.8% Fibonacci retracements at US$1.1596 and US$1.1527, respectively, derived from legs A-D of the larger AB=CD pattern.
Written by FP Markets Chief Market Analyst Aaron Hill

Aviso legal
As informações e publicações não se destinam a ser, e não constituem, conselhos ou recomendações financeiras, de investimento, comerciais ou de outro tipo fornecidos ou endossados pela TradingView. Leia mais nos Termos de Uso.
Aviso legal
As informações e publicações não se destinam a ser, e não constituem, conselhos ou recomendações financeiras, de investimento, comerciais ou de outro tipo fornecidos ou endossados pela TradingView. Leia mais nos Termos de Uso.