
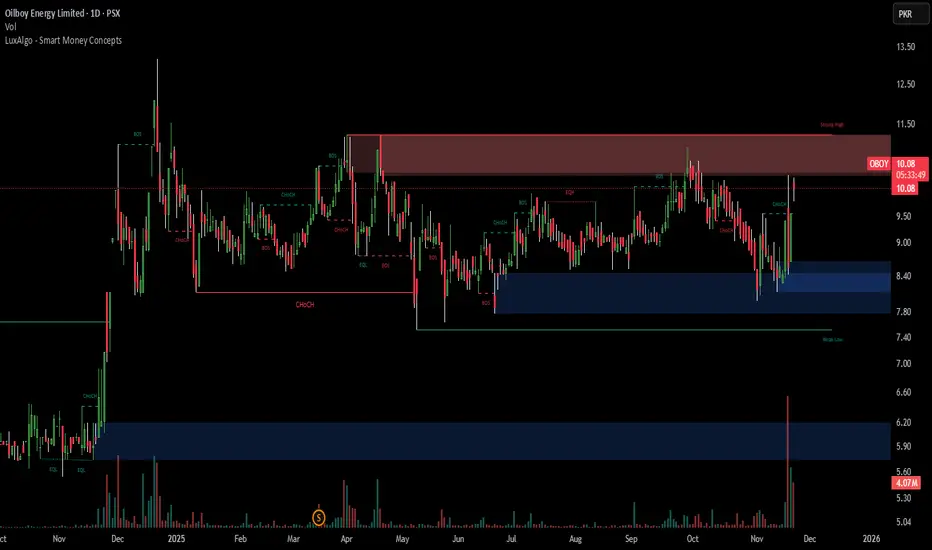
Chart Date: November 21, 2025 | Current Price: PKR 10.01 (+4.82%)
📊 Market Overview
Oilboy Energy is trading at PKR 10.01, showing strong recovery momentum after bouncing from the critical 8.40 support zone. The stock is currently testing the 9.50-10.00 resistance area and attempting to break into the major overhead resistance zone at 10.50-11.50.
🔍 Technical Pattern Analysis
Range-Bound Consolidation with Breakout Potential
The price action shows:
Wide trading range between 8.40 support (blue zone) and 10.50-11.50 resistance (brown zone)
Recent bounce from 8.40 with strong bullish momentum
Multiple tests of the 10.50-11.50 resistance throughout 2025
Current position at the lower boundary of major resistance
Pattern Implication: The stock has been consolidating for months. A decisive break above 10.50 could trigger a significant move toward the 11.50 resistance and potentially higher.
📈 Key Technical Levels
Resistance Zones
Immediate Resistance: 10.20-10.50 (current test area)
Major Resistance: 10.50-11.50 - Heavy supply zone with multiple rejections (brown zone)
Extended Target: 11.80-12.00 (if major resistance breaks)
Support Zones
Immediate Support: 9.50-9.80 (recent consolidation)
Strong Support: 8.40-8.80 (blue demand zone) - Critical level that held multiple times
Major Support: 7.80-8.00 (lower boundary)
🎯 Price Targets
Bullish Case: Target 10.50-11.50
Why This Target Makes Sense:
1. Range Resistance
The 10.50-11.50 zone has been the ceiling for this stock throughout 2025
Breaking above this would open doors to higher levels
Represents 5-15% upside from current levels
2. Support Holding Strong
The 8.40 support zone has proven to be extremely reliable
Each bounce from this level has led to 15-20% rallies
Recent bounce shows renewed buying interest
3. Volume Pattern
Recent volume spike at the 8.40 support shows accumulation
Higher volume on up-days indicates buying pressure
Need volume confirmation for breakout above 10.50
📉 Volume Analysis
Significant volume spike visible at the recent 8.40 bounce (late November)
Above-average volume on recent recovery suggests institutional interest
Volume expansion required for a confirmed breakout above 10.50
🔔 Trading Strategy
Primary Bullish Setup
Current Entry: 9.80-10.20 (current zone)
Breakout Entry: Above 10.50 with strong volume
Target 1: 10.80-11.00
Target 2: 11.50 (+15%)
Stop Loss: Below 9.30 (tight) or 8.30 (wider)
Risk-Reward: 1:2 to 1:3
Conservative Approach
Wait for: Consolidation above 10.50
Entry: Retest of 10.50 as support
Target: 11.50-12.00
Stop Loss: Below 10.00
Bearish Scenario (Alternative)
Trigger: Rejection at 10.50 and break below 9.30
Target: Retest of 8.40 support
Invalidation: Hold above 9.50
⚠️ Key Points to Monitor
✅ Support at 8.40 has been rock solid - multiple successful tests
✅ Recent bounce from lows shows strong buying interest
✅ Volume accumulation at support levels indicates smart money buying
⚠️ Multiple rejections at 10.50-11.50 shows strong overhead supply
⚠️ Needs volume confirmation for sustainable breakout
⚠️ Range-bound for extended period - patience required
🎓 Conclusion
Oilboy Energy is at a critical juncture after bouncing strongly from the 8.40 support zone. The technical setup suggests:
✅ Strong support structure at 8.40-8.80
✅ Currently testing resistance at 10.00-10.50
✅ Breakout above 10.50 targets 11.50+ zone
✅ Good risk-reward for patient traders
Recommendation: Watch for a decisive break above 10.50 with strong volume. The 10.50-11.50 zone is the key resistance that needs to be conquered for the next leg up. If price gets rejected here, expect a retest of the 9.50 or 8.40 support zones. Risk-reward favors bullish positioning with stop below 9.30 or 8.30 depending on risk tolerance.
Disclaimer: This is technical analysis for educational purposes only. Always do your own research and consult with a financial advisor before making investment decisions.
Chart Source: TradingView | Analysis Date: November 21, 2025
📊 Market Overview
Oilboy Energy is trading at PKR 10.01, showing strong recovery momentum after bouncing from the critical 8.40 support zone. The stock is currently testing the 9.50-10.00 resistance area and attempting to break into the major overhead resistance zone at 10.50-11.50.
🔍 Technical Pattern Analysis
Range-Bound Consolidation with Breakout Potential
The price action shows:
Wide trading range between 8.40 support (blue zone) and 10.50-11.50 resistance (brown zone)
Recent bounce from 8.40 with strong bullish momentum
Multiple tests of the 10.50-11.50 resistance throughout 2025
Current position at the lower boundary of major resistance
Pattern Implication: The stock has been consolidating for months. A decisive break above 10.50 could trigger a significant move toward the 11.50 resistance and potentially higher.
📈 Key Technical Levels
Resistance Zones
Immediate Resistance: 10.20-10.50 (current test area)
Major Resistance: 10.50-11.50 - Heavy supply zone with multiple rejections (brown zone)
Extended Target: 11.80-12.00 (if major resistance breaks)
Support Zones
Immediate Support: 9.50-9.80 (recent consolidation)
Strong Support: 8.40-8.80 (blue demand zone) - Critical level that held multiple times
Major Support: 7.80-8.00 (lower boundary)
🎯 Price Targets
Bullish Case: Target 10.50-11.50
Why This Target Makes Sense:
1. Range Resistance
The 10.50-11.50 zone has been the ceiling for this stock throughout 2025
Breaking above this would open doors to higher levels
Represents 5-15% upside from current levels
2. Support Holding Strong
The 8.40 support zone has proven to be extremely reliable
Each bounce from this level has led to 15-20% rallies
Recent bounce shows renewed buying interest
3. Volume Pattern
Recent volume spike at the 8.40 support shows accumulation
Higher volume on up-days indicates buying pressure
Need volume confirmation for breakout above 10.50
📉 Volume Analysis
Significant volume spike visible at the recent 8.40 bounce (late November)
Above-average volume on recent recovery suggests institutional interest
Volume expansion required for a confirmed breakout above 10.50
🔔 Trading Strategy
Primary Bullish Setup
Current Entry: 9.80-10.20 (current zone)
Breakout Entry: Above 10.50 with strong volume
Target 1: 10.80-11.00
Target 2: 11.50 (+15%)
Stop Loss: Below 9.30 (tight) or 8.30 (wider)
Risk-Reward: 1:2 to 1:3
Conservative Approach
Wait for: Consolidation above 10.50
Entry: Retest of 10.50 as support
Target: 11.50-12.00
Stop Loss: Below 10.00
Bearish Scenario (Alternative)
Trigger: Rejection at 10.50 and break below 9.30
Target: Retest of 8.40 support
Invalidation: Hold above 9.50
⚠️ Key Points to Monitor
✅ Support at 8.40 has been rock solid - multiple successful tests
✅ Recent bounce from lows shows strong buying interest
✅ Volume accumulation at support levels indicates smart money buying
⚠️ Multiple rejections at 10.50-11.50 shows strong overhead supply
⚠️ Needs volume confirmation for sustainable breakout
⚠️ Range-bound for extended period - patience required
🎓 Conclusion
Oilboy Energy is at a critical juncture after bouncing strongly from the 8.40 support zone. The technical setup suggests:
✅ Strong support structure at 8.40-8.80
✅ Currently testing resistance at 10.00-10.50
✅ Breakout above 10.50 targets 11.50+ zone
✅ Good risk-reward for patient traders
Recommendation: Watch for a decisive break above 10.50 with strong volume. The 10.50-11.50 zone is the key resistance that needs to be conquered for the next leg up. If price gets rejected here, expect a retest of the 9.50 or 8.40 support zones. Risk-reward favors bullish positioning with stop below 9.30 or 8.30 depending on risk tolerance.
Disclaimer: This is technical analysis for educational purposes only. Always do your own research and consult with a financial advisor before making investment decisions.
Chart Source: TradingView | Analysis Date: November 21, 2025

Aviso legal
As informações e publicações não se destinam a ser, e não constituem, conselhos ou recomendações financeiras, de investimento, comerciais ou de outro tipo fornecidos ou endossados pela TradingView. Leia mais nos Termos de Uso.
Aviso legal
As informações e publicações não se destinam a ser, e não constituem, conselhos ou recomendações financeiras, de investimento, comerciais ou de outro tipo fornecidos ou endossados pela TradingView. Leia mais nos Termos de Uso.