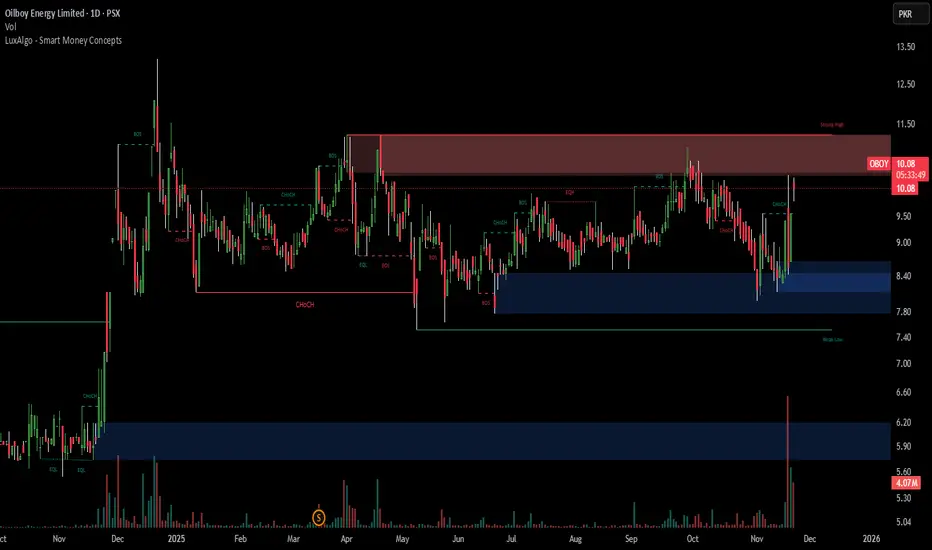
#OBOY — Inner Channel Breakout Confirmed#OBOY — Inner Channel Breakout Confirmed
LDCP: 16.82
OBOY has successfully broken out of its inner descending channel, signaling a continuation of the ongoing recovery trend. The stock is now challenging a major long-term descending trendline, with momentum and volume favoring further upside.
The
Oilboy Energy Limited
No trades
No trades
Compare with Oilboy Energy Limited
Key stats
Details
Sector
Industry
Website
Headquarters
Lahore
Founded
1993
IPO date
Jun 6, 1996
ISIN
PK0074701019
FIGI
BBG000GMZMP9
Identifiers
ISIN PK0074701019
Oilboy Energy Ltd. engages in the trading of fuel and energy supplies. It operates through the following segments: Petroleum and Coal. The Petroleum segment focuses on procurement, storage, and sale of petroleum and related products. The Coal segment includes coal trading and related services. The company was founded on June 28, 1993 and is headquartered in Lahore, Pakistan.
Needs to Sustain its Breakout!OBOY Analysis
CMP 11.75 (15-05-2026 04:04PM)
Earlier, in January 2025 I shared analysis that
played perfectly well.
Now, again breakout has been done but it needs
to sustain 11.20 on weekly basis. for further upside move.
It will start its uptrend once it crosses 16 with
Good volumes and sustains i
Beautiful Breakout of Ascending Triangle.OBOY Analysis
Closed at 12.69 (09-01-2026)
Beautiful Breakout of Ascending Triangle.
10.90 - 11.55 seems to be a very Important Support.
Upside resistance is around 16, however mid way
resistance still lies around 12.50 - 13.50
Breaking 10 may bring the price towards 9 -9.10
OBOY – (Weekly) topped out in 2021 near 26.3–27.0OBOY – (Weekly):
OBOY topped out in 2021 near 26.3–27.0, marking its all-time high, followed by a prolonged corrective phase with a series of lower highs, defining the long-term downtrend. Subsequent rebound attempts were capped around 13.1–13.5, which remains a major supply zone and first meaningf
Oilboy Energy Limited (OBOY) - Technical AnalysisChart Date: November 21, 2025 | Current Price: PKR 10.01 (+4.82%)
📊 Market Overview
Oilboy Energy is trading at PKR 10.01, showing strong recovery momentum after bouncing from the critical 8.40 support zone. The stock is currently testing the 9.50-10.00 resistance area and attempting to break into
Buy Plan (OBoy Energy Limited – PSX)Buy Plan (OBoy Energy Limited – PSX)
Condition to Enter:
Buy once price closes above 12.00 (cisd level) on the weekly chart.
Entry Zone:
Enter on a confirmed weekly close above 12.00, or on a small retracement back to the breakout level.
Stop Loss (SL):
Below 7.50 (last consolidation support).
T
See all ideas
Summarizing what the indicators are suggesting.
Oscillators
Neutral
SellBuy
Strong sellStrong buy
Strong sellSellNeutralBuyStrong buy
Oscillators
Neutral
SellBuy
Strong sellStrong buy
Strong sellSellNeutralBuyStrong buy
Summary
Neutral
SellBuy
Strong sellStrong buy
Strong sellSellNeutralBuyStrong buy
Summary
Neutral
SellBuy
Strong sellStrong buy
Strong sellSellNeutralBuyStrong buy
Summary
Neutral
SellBuy
Strong sellStrong buy
Strong sellSellNeutralBuyStrong buy
Moving Averages
Neutral
SellBuy
Strong sellStrong buy
Strong sellSellNeutralBuyStrong buy
Moving Averages
Neutral
SellBuy
Strong sellStrong buy
Strong sellSellNeutralBuyStrong buy
Displays a symbol's price movements over previous years to identify recurring trends.
Frequently asked questions
The current price of OBOY is 16.42 PKR — it has decreased by −1.32% in the past 24 hours. Watch Oilboy Energy Limited stock price performance more closely on the chart.
Depending on the exchange, the stock ticker may vary. For instance, on PSX exchange Oilboy Energy Limited stocks are traded under the ticker OBOY.
OBOY stock has risen by 2.18% compared to the previous week, the month change is a −18.23% fall, over the last year Oilboy Energy Limited has showed a 73.57% increase.
OBOY reached its all-time high on Oct 6, 2015 with the price of 32.16 PKR, and its all-time low was 1.19 PKR and was reached on Jul 31, 2019. View more price dynamics on OBOY chart.
See other stocks reaching their highest and lowest prices.
OBOY stock is 4.05% volatile and has beta coefficient of 1.40. Track Oilboy Energy Limited stock price on the chart and check out the list of the most volatile stocks — is Oilboy Energy Limited there?
No, OBOY doesn't pay any dividends to its shareholders. But don't worry, we've prepared a list of high-dividend stocks for you.
Like other stocks, OBOY shares are traded on stock exchanges, e.g. Nasdaq, Nyse, Euronext, and the easiest way to buy them is through an online stock broker. To do this, you need to open an account and follow a broker's procedures, then start trading. You can trade Oilboy Energy Limited stock right from TradingView charts — choose your broker and connect to your account.
Investing in stocks requires a comprehensive research: you should carefully study all the available data, e.g. company's financials, related news, and its technical analysis. So Oilboy Energy Limited technincal analysis shows the neutral today, and its 1 week rating is buy. Since market conditions are prone to changes, it's worth looking a bit further into the future — according to the 1 month rating Oilboy Energy Limited stock shows the buy signal. See more of Oilboy Energy Limited technicals for a more comprehensive analysis.
If you're still not sure, try looking for inspiration in our curated watchlists.