#OBOY — Inner Channel Breakout Confirmed#OBOY — Inner Channel Breakout Confirmed
LDCP: 16.82
OBOY has successfully broken out of its inner descending channel, signaling a continuation of the ongoing recovery trend. The stock is now challenging a major long-term descending trendline, with momentum and volume favoring further upside.
The broader structure remains constructive as long as the breakout holds. A decisive move above the long-term downtrend line could trigger the next leg higher toward the 21.50+ zone.
⚠️ Note: OBOY is a high-beta, speculative counter and can be highly volatile. Avoid chasing extended moves; manage risk accordingly.
Disclaimer: This analysis is for educational purposes only and does not constitute investment advice.
#PSX #KSE100 #OBOY
Oilboy Energy Limited
No trades
No trades
In-depth trading ideas
Needs to Sustain its Breakout!OBOY Analysis
CMP 11.75 (15-05-2026 04:04PM)
Earlier, in January 2025 I shared analysis that
played perfectly well.
Now, again breakout has been done but it needs
to sustain 11.20 on weekly basis. for further upside move.
It will start its uptrend once it crosses 16 with
Good volumes and sustains it.
Beautiful Breakout of Ascending Triangle.OBOY Analysis
Closed at 12.69 (09-01-2026)
Beautiful Breakout of Ascending Triangle.
10.90 - 11.55 seems to be a very Important Support.
Upside resistance is around 16, however mid way
resistance still lies around 12.50 - 13.50
Breaking 10 may bring the price towards 9 -9.10
OBOY – (Weekly) topped out in 2021 near 26.3–27.0OBOY – (Weekly):
OBOY topped out in 2021 near 26.3–27.0, marking its all-time high, followed by a prolonged corrective phase with a series of lower highs, defining the long-term downtrend. Subsequent rebound attempts were capped around 13.1–13.5, which remains a major supply zone and first meaningful resistance on any upside.
A sustained breakout above 13.5 would be the first confirmation of a structural trend change, while acceptance above 17.5 would open the path toward a retest of the 26+ zone over the medium to long term.
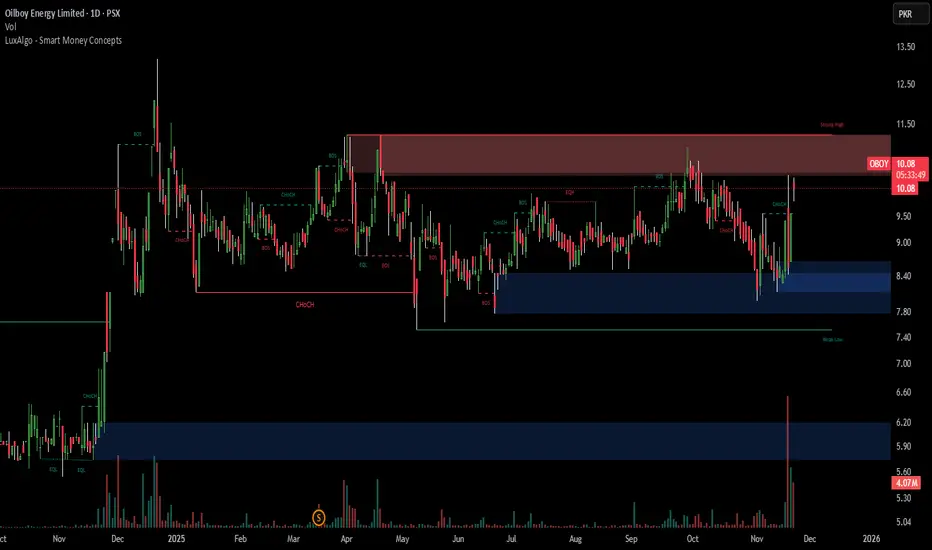
Oilboy Energy Limited (OBOY) - Technical AnalysisChart Date: November 21, 2025 | Current Price: PKR 10.01 (+4.82%)
📊 Market Overview
Oilboy Energy is trading at PKR 10.01, showing strong recovery momentum after bouncing from the critical 8.40 support zone. The stock is currently testing the 9.50-10.00 resistance area and attempting to break into the major overhead resistance zone at 10.50-11.50.
🔍 Technical Pattern Analysis
Range-Bound Consolidation with Breakout Potential
The price action shows:
Wide trading range between 8.40 support (blue zone) and 10.50-11.50 resistance (brown zone)
Recent bounce from 8.40 with strong bullish momentum
Multiple tests of the 10.50-11.50 resistance throughout 2025
Current position at the lower boundary of major resistance
Pattern Implication: The stock has been consolidating for months. A decisive break above 10.50 could trigger a significant move toward the 11.50 resistance and potentially higher.
📈 Key Technical Levels
Resistance Zones
Immediate Resistance: 10.20-10.50 (current test area)
Major Resistance: 10.50-11.50 - Heavy supply zone with multiple rejections (brown zone)
Extended Target: 11.80-12.00 (if major resistance breaks)
Support Zones
Immediate Support: 9.50-9.80 (recent consolidation)
Strong Support: 8.40-8.80 (blue demand zone) - Critical level that held multiple times
Major Support: 7.80-8.00 (lower boundary)
🎯 Price Targets
Bullish Case: Target 10.50-11.50
Why This Target Makes Sense:
1. Range Resistance
The 10.50-11.50 zone has been the ceiling for this stock throughout 2025
Breaking above this would open doors to higher levels
Represents 5-15% upside from current levels
2. Support Holding Strong
The 8.40 support zone has proven to be extremely reliable
Each bounce from this level has led to 15-20% rallies
Recent bounce shows renewed buying interest
3. Volume Pattern
Recent volume spike at the 8.40 support shows accumulation
Higher volume on up-days indicates buying pressure
Need volume confirmation for breakout above 10.50
📉 Volume Analysis
Significant volume spike visible at the recent 8.40 bounce (late November)
Above-average volume on recent recovery suggests institutional interest
Volume expansion required for a confirmed breakout above 10.50
🔔 Trading Strategy
Primary Bullish Setup
Current Entry: 9.80-10.20 (current zone)
Breakout Entry: Above 10.50 with strong volume
Target 1: 10.80-11.00
Target 2: 11.50 (+15%)
Stop Loss: Below 9.30 (tight) or 8.30 (wider)
Risk-Reward: 1:2 to 1:3
Conservative Approach
Wait for: Consolidation above 10.50
Entry: Retest of 10.50 as support
Target: 11.50-12.00
Stop Loss: Below 10.00
Bearish Scenario (Alternative)
Trigger: Rejection at 10.50 and break below 9.30
Target: Retest of 8.40 support
Invalidation: Hold above 9.50
⚠️ Key Points to Monitor
✅ Support at 8.40 has been rock solid - multiple successful tests
✅ Recent bounce from lows shows strong buying interest
✅ Volume accumulation at support levels indicates smart money buying
⚠️ Multiple rejections at 10.50-11.50 shows strong overhead supply
⚠️ Needs volume confirmation for sustainable breakout
⚠️ Range-bound for extended period - patience required
🎓 Conclusion
Oilboy Energy is at a critical juncture after bouncing strongly from the 8.40 support zone. The technical setup suggests:
✅ Strong support structure at 8.40-8.80
✅ Currently testing resistance at 10.00-10.50
✅ Breakout above 10.50 targets 11.50+ zone
✅ Good risk-reward for patient traders
Recommendation: Watch for a decisive break above 10.50 with strong volume. The 10.50-11.50 zone is the key resistance that needs to be conquered for the next leg up. If price gets rejected here, expect a retest of the 9.50 or 8.40 support zones. Risk-reward favors bullish positioning with stop below 9.30 or 8.30 depending on risk tolerance.
Disclaimer: This is technical analysis for educational purposes only. Always do your own research and consult with a financial advisor before making investment decisions.
Chart Source: TradingView | Analysis Date: November 21, 2025
Buy Plan (OBoy Energy Limited – PSX)Buy Plan (OBoy Energy Limited – PSX)
Condition to Enter:
Buy once price closes above 12.00 (cisd level) on the weekly chart.
Entry Zone:
Enter on a confirmed weekly close above 12.00, or on a small retracement back to the breakout level.
Stop Loss (SL):
Below 7.50 (last consolidation support).
Targets:
Target 1: 26.37 (≈135% gain)
Target 2: 32.16 (major resistance zone)
Risk Management:
Risk only 1–2% of capital.
Move stop loss to breakeven once price reaches halfway to Target 1.
Notes:
Wait for weekly candle close confirmation above 12.00, not just intraday spikes.
Patience is key — don’t chase before breakout is validated.
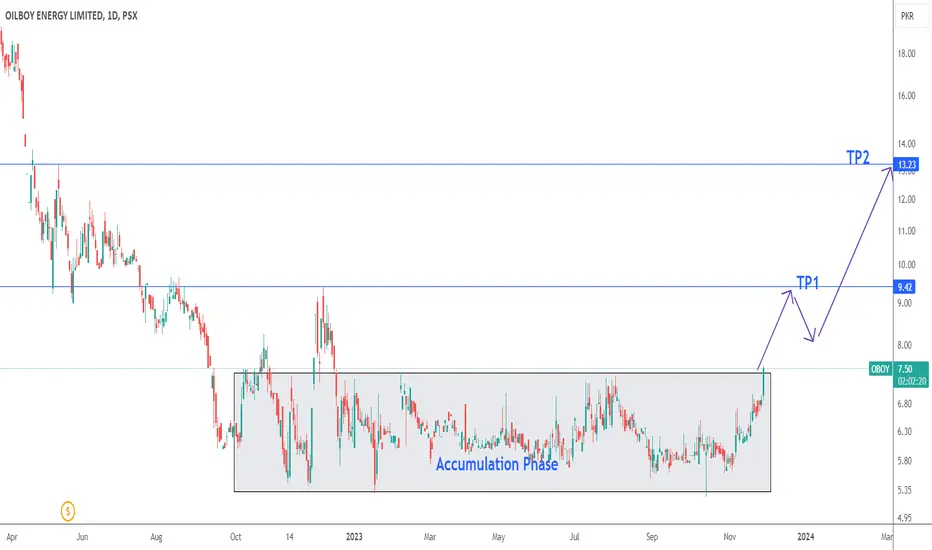
PSX:- OBOY FORMING A CONTINUATION PATTERN CUP & HANDLESince the start of 2023 the script has been in consolidation after a long bearish spell. At the end of year it gathered some support to stage a break out but could not sustain the Bears consequently it went in to another strength gaining spell. From the last week of April we are witnessing gradual increase in volume which is also showing in the rise of Average Volumes. Last weak b the bulls tested the previous high of 7.93. Albeit the succeed to cross it yet they could not sustain. Thus making a potential Cup. Now we have to wait and see if it forms a handle or not.
If it forms the handle the entry price shall be close above 8 and TP shall be at 10.5. Stop loss has been placed at 6 but this shall be confirmed once the handle has been formed.
Due diligence and strict money management is solicited.
Have a profitable trading.