
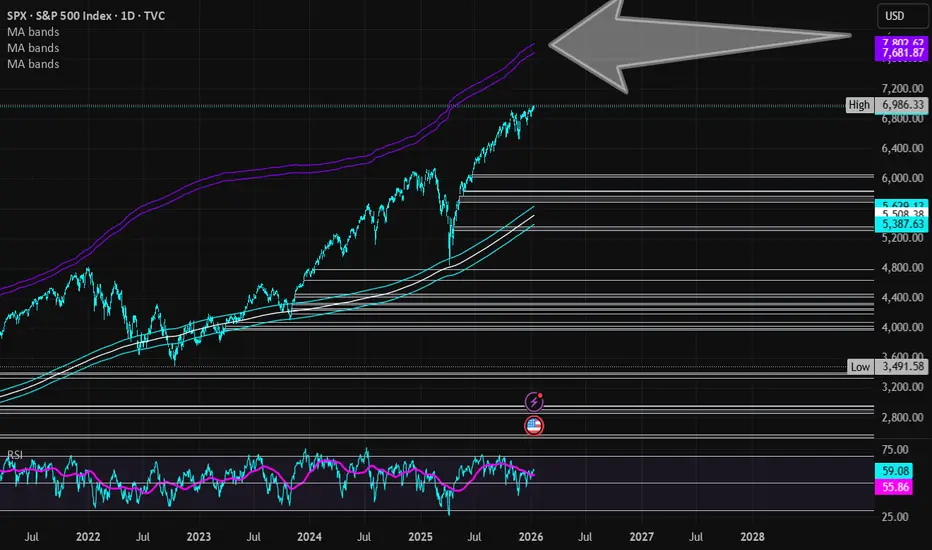
In recognition of surpassing 500 followers, I thought I would take a moment to write about when I plan to fully exit equities, stockpile cash, and continue to acquire into 20-year treasury bonds (which I have started with TLT). This post is not encouraging others to do as I do. Instead, it's an attempt to answer a common question I am asked: "When do you think this rally will be over?"
The answer is: "I do not know. But, using technical analysis, I can estimate a personal 'fear' indicator."
My 'Fear' Indicator
I use technical analysis to make informed decisions about entries and exits. It reduces emotional trading, chasing, and FOMO. My technical analysis does not conform to the "standard" 50-, 100-, 200-simple moving averages (SMA). In fact, back testing these standard SMAs show they are (arguably) traps for retail traders. The system wants your money, so why on earth would they share their secrets with such basic numbers as 50, 100, etc.?
Instead, the "devil" is in the details. What I will call my "historical SMA". That's as much as I will share because... well... I want your money too ;)
I view my historical SMA as primary support. It's the white line on the chart. Around that area is a range of values that the price can bounce around in (or slightly out) without causing panic or fear that support has been lost. From the historical SMA, other bands can be extended out to estimate additional support or resistance. If you follow me, you've seen I often trade using a "crash" and "major crash" SMA. These zones often indicate bottom areas for price reversal (i.e. algorithmic trading kicks in and pre-programmed computers quickly accumulate shares). Personally, it's a great indicator by taking out guesswork and letting time work for you instead of against you. It's not perfect, but the odds of success have been extremely high.
So, what's the opposite of my crash or major crash SMA? The "fear" SMA. I call it that because it's when people should ***really*** be fearful of their market exposure (unlike the crash and major crash SMAs which are opportunities). It's currently on the chart as purple lines near 7,600 and 7,800 (and rising). This band is where I am moving out of equities completely and going cash and TLT . The throttle is maxed and headed for a wall, as they say. Does that mean once price hits that zone the market has topped and it's only down from there? Absolutely not. It may ride that level or jump higher for a few months, year, etc. But it's a fool's game at that point. Time will not be on investor's side. FOMO will be real for those who exit, but this is why technical analysis is important. It uses data for informed decision-making. Not emotions. Profits made from reaching the purple bar will be great. More is just glutinous.
Important Note
Obviously, the conditions above are predicated on no major wars, pandemics, global catastrophes, etc. I view any further dips in the market, not due to said conditions, as opportunities. But, as always, stay cautious, trade using your own strategies, and protect yourself and your money at all times.
The answer is: "I do not know. But, using technical analysis, I can estimate a personal 'fear' indicator."
My 'Fear' Indicator
I use technical analysis to make informed decisions about entries and exits. It reduces emotional trading, chasing, and FOMO. My technical analysis does not conform to the "standard" 50-, 100-, 200-simple moving averages (SMA). In fact, back testing these standard SMAs show they are (arguably) traps for retail traders. The system wants your money, so why on earth would they share their secrets with such basic numbers as 50, 100, etc.?
Instead, the "devil" is in the details. What I will call my "historical SMA". That's as much as I will share because... well... I want your money too ;)
I view my historical SMA as primary support. It's the white line on the chart. Around that area is a range of values that the price can bounce around in (or slightly out) without causing panic or fear that support has been lost. From the historical SMA, other bands can be extended out to estimate additional support or resistance. If you follow me, you've seen I often trade using a "crash" and "major crash" SMA. These zones often indicate bottom areas for price reversal (i.e. algorithmic trading kicks in and pre-programmed computers quickly accumulate shares). Personally, it's a great indicator by taking out guesswork and letting time work for you instead of against you. It's not perfect, but the odds of success have been extremely high.
So, what's the opposite of my crash or major crash SMA? The "fear" SMA. I call it that because it's when people should ***really*** be fearful of their market exposure (unlike the crash and major crash SMAs which are opportunities). It's currently on the chart as purple lines near 7,600 and 7,800 (and rising). This band is where I am moving out of equities completely and going cash and
TLT . The throttle is maxed and headed for a wall, as they say. Does that mean once price hits that zone the market has topped and it's only down from there? Absolutely not. It may ride that level or jump higher for a few months, year, etc. But it's a fool's game at that point. Time will not be on investor's side. FOMO will be real for those who exit, but this is why technical analysis is important. It uses data for informed decision-making. Not emotions. Profits made from reaching the purple bar will be great. More is just glutinous. Important Note
Obviously, the conditions above are predicated on no major wars, pandemics, global catastrophes, etc. I view any further dips in the market, not due to said conditions, as opportunities. But, as always, stay cautious, trade using your own strategies, and protect yourself and your money at all times.

If you enjoy this idea, please follow for more: tradingview.com/u/WorthlessViews/
Aviso legal
As informações e publicações não se destinam a ser, e não constituem, conselhos ou recomendações financeiras, de investimento, comerciais ou de outro tipo fornecidos ou endossados pela TradingView. Leia mais nos Termos de Uso.
If you enjoy this idea, please follow for more: tradingview.com/u/WorthlessViews/
Aviso legal
As informações e publicações não se destinam a ser, e não constituem, conselhos ou recomendações financeiras, de investimento, comerciais ou de outro tipo fornecidos ou endossados pela TradingView. Leia mais nos Termos de Uso.