
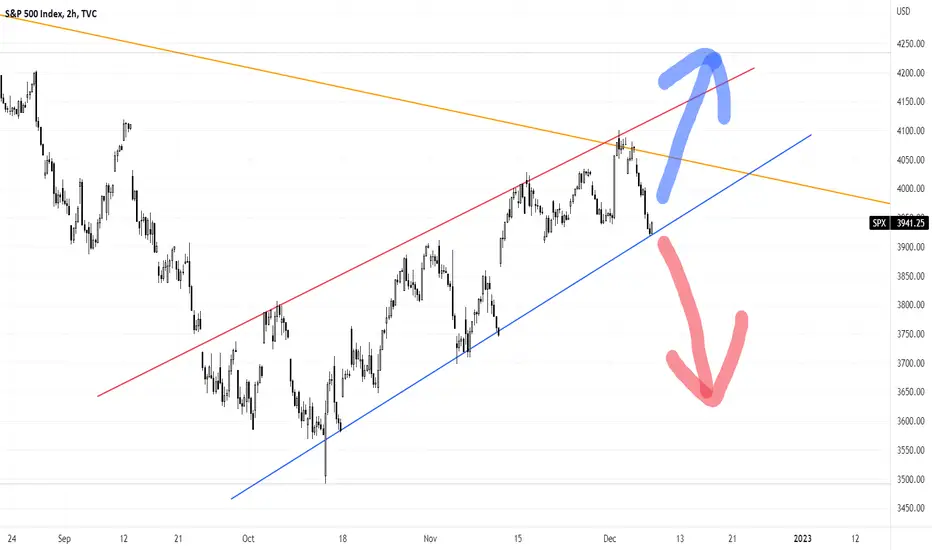
S&P 500 (2H chart) @ 6 December 2022
Drilling down to the more granular 2-hour chart, it's clear that the S&P 500 is at another make-or-break situation...
- Index is testing the strong support (blue line)
- Index previously rejected two strong resistances:- (i) mid-term trendline (red line) and (ii) long-term counter-trendline (orange line)
Drilling down to the more granular 2-hour chart, it's clear that the S&P 500 is at another make-or-break situation...
- Index is testing the strong support (blue line)
- Index previously rejected two strong resistances:- (i) mid-term trendline (red line) and (ii) long-term counter-trendline (orange line)

Publicações relacionadas
Aviso legal
As informações e publicações não se destinam a ser, e não constituem, conselhos ou recomendações financeiras, de investimento, comerciais ou de outro tipo fornecidos ou endossados pela TradingView. Leia mais nos Termos de Uso.
Publicações relacionadas
Aviso legal
As informações e publicações não se destinam a ser, e não constituem, conselhos ou recomendações financeiras, de investimento, comerciais ou de outro tipo fornecidos ou endossados pela TradingView. Leia mais nos Termos de Uso.