
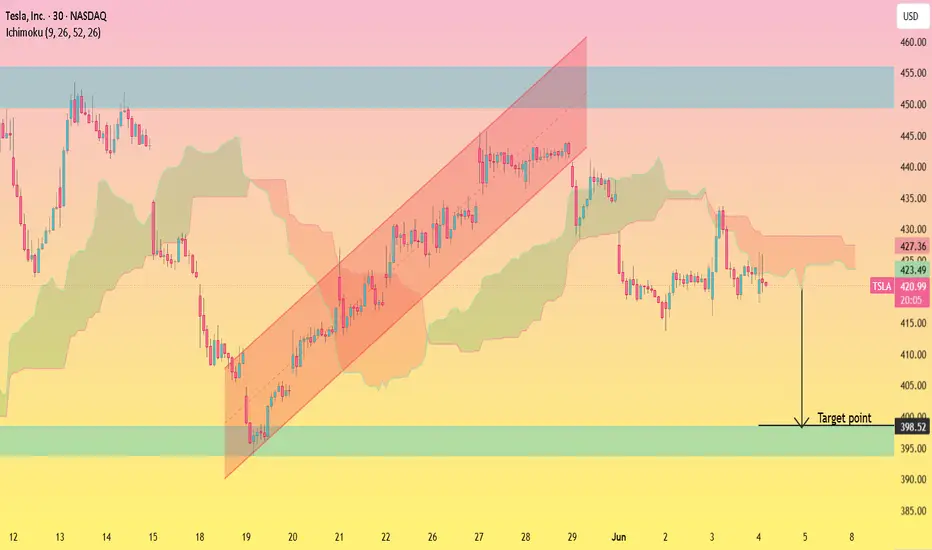
TSLA is showing signs of weakness after failing to sustain its previous bullish channel breakout. Price has moved below the Ichimoku cloud resistance and is consolidating under a key supply area, suggesting that sellers remain in control in the short term.
The chart highlights a potential bearish continuation scenario, with price likely to retrace toward the major demand zone around **398.52**. This level has previously attracted buying interest and could act as a strong support area if the decline continues.
🎯 **Target:** 398.52
📉 **Bias:** Bearish
⚠️ **Invalidation:** A sustained move back above the recent resistance zone around **435–445** would weaken the bearish outlook and signal renewed bullish momentum.
The chart highlights a potential bearish continuation scenario, with price likely to retrace toward the major demand zone around **398.52**. This level has previously attracted buying interest and could act as a strong support area if the decline continues.
🎯 **Target:** 398.52
📉 **Bias:** Bearish
⚠️ **Invalidation:** A sustained move back above the recent resistance zone around **435–445** would weaken the bearish outlook and signal renewed bullish momentum.
Trade ativo
my given target is achieved Trade fechado: objetivo atingido
my given target is achieved 
Publicações relacionadas
Aviso legal
As informações e publicações não se destinam a ser, e não constituem, conselhos ou recomendações financeiras, de investimento, comerciais ou de outro tipo fornecidos ou endossados pela TradingView. Leia mais nos Termos de Uso.
Publicações relacionadas
Aviso legal
As informações e publicações não se destinam a ser, e não constituem, conselhos ou recomendações financeiras, de investimento, comerciais ou de outro tipo fornecidos ou endossados pela TradingView. Leia mais nos Termos de Uso.