
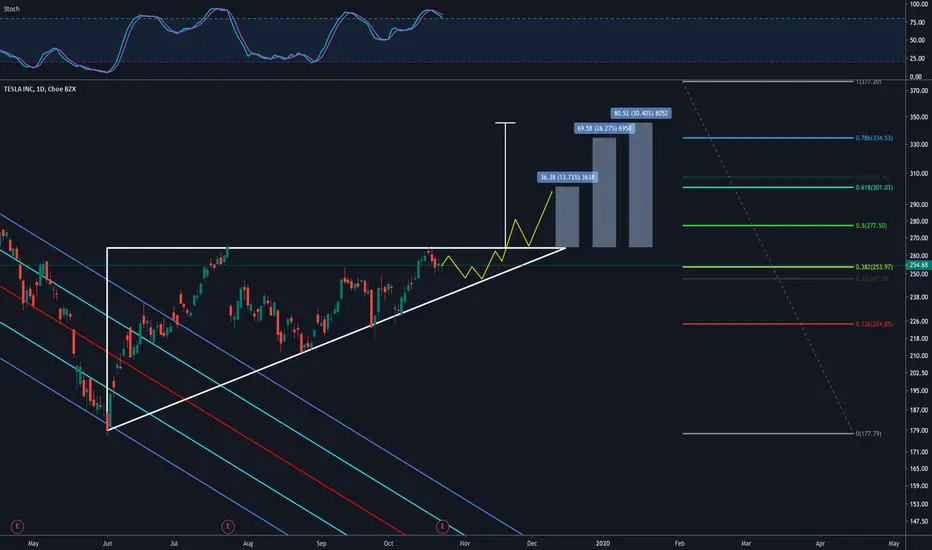
TSLA seems to have formed a very large ascending triangle after breaking out of the downsloping channel earlier this year in June.
There is a higher likelihood of it to break to the upside, especially after breaking from a long downtrend. There is a 75% chance of it being a continuation pattern, meaning, it is a lot more likely for this to break upwards.
Targets can be if it breaks upwards: - $300. -$335. - $345.
Obviously, if the bottom diagonal line breaks then this pattern is invalid.
Long term it looks more bullish than not.
What are your thoughts?
Trade ativo
Still active, but pull back might be near
Aviso legal
As informações e publicações não se destinam a ser, e não constituem, conselhos ou recomendações financeiras, de investimento, comerciais ou de outro tipo fornecidos ou endossados pela TradingView. Leia mais nos Termos de Uso.
Aviso legal
As informações e publicações não se destinam a ser, e não constituem, conselhos ou recomendações financeiras, de investimento, comerciais ou de outro tipo fornecidos ou endossados pela TradingView. Leia mais nos Termos de Uso.