Support Zone: 0.2750 ~ 0.2809
Hello, traders!
Follow us to get the latest information quickly.
Have a great day!
-------------------------------------
(TRXUSDT 1M Chart)
It looks like there's been a significant drop, but it's still in an uptrend.
To initiate a downtrend, the price must fall below and remain below the M-Signal indicator on the 1M chart.
Therefore, from the current price level, it must fall below 0.2548.
-
Support is crucial around the HA-High ~ DOM(60) range (0.2851 ~ 0.3410).
If the price continues
Breadth Indicators
Why Market Research Is The #1 Tool-Part 2I wish i could tell you
this strongly with shouts and shouts!!
Technical analysis is very important
don't get me wrong
it is! you need to understand
the technical tools
but you also need market research
The price shows you the footprints
but you need to see who is making them
them footprints
Remember you need to be patient
make sure your market research
aligns with
the technical analysis tools
This is where the confidence comes
from..
Am going to tell you how
i use market research
Why Market Research Is The #1 Tool In TradingAm looking at research data and now i see
the power of sentiment as well.
Its okay to master trading technical
but research plays a huge part in trading
Research is what gives you the
edge you need to trade like a pro
below am using the rate of change
2 days
as a reversal entry trigger
will this entry work?
am not not sure but
i want to document
this change in my mindset in order
so that i can
improve on my trading
ability
remember the promise we made to each
other?
DO
The key is whether it can rise above 0.11747 ~ 0.13127
Hello, fellow traders!
Follow us to get the latest information quickly.
Have a great day.
-------------------------------------
When interpreting charts, the key is the movement of the 1D chart.
However, the 1D chart has many volatile sections, which can make it difficult to interpret.
In such cases, looking at the 1W chart can help you more easily observe the movement.
-
Looking at the 1W chart, you can see that the price has risen sharply, rising above the Fibonacci level of 0.5 (0.15
How to interpret the current movement
Hello, fellow traders!
Follow us to get the latest information quickly.
Have a great day.
-------------------------------------
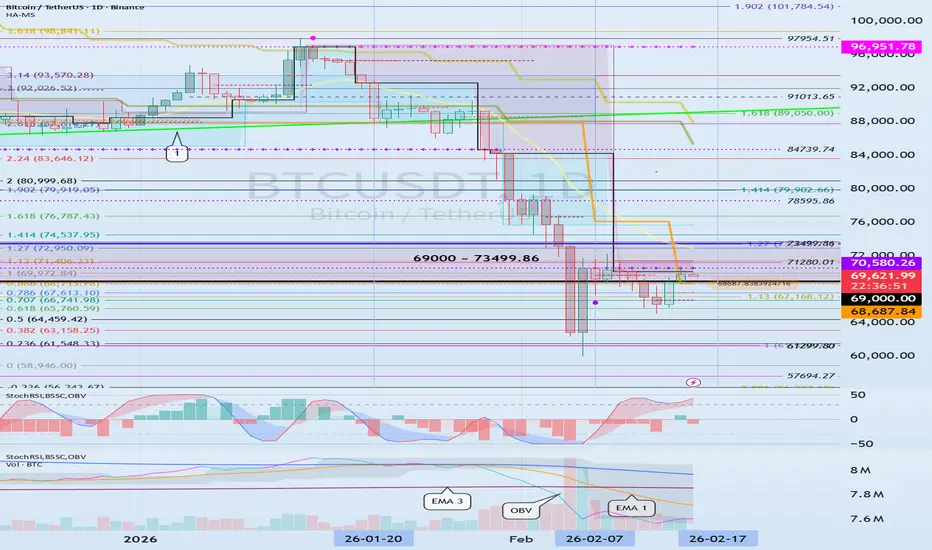
The key points to watch are the HA-Low indicator and the DOM (-60) indicator.
If the HA-Low and DOM (-60) indicators provide support, then that's a good time to buy.
Accordingly, the key question is whether the price can rise after finding support in the 68687.84 ~ 70580.26 range.
-
The StochRSI 20, 50, and 80 indicators are displayed on the chart because they p
This Volatility Period: February 6th - 8th
Hello, fellow traders!
Follow us to get the latest information quickly.
Have a great day!
-------------------------------------
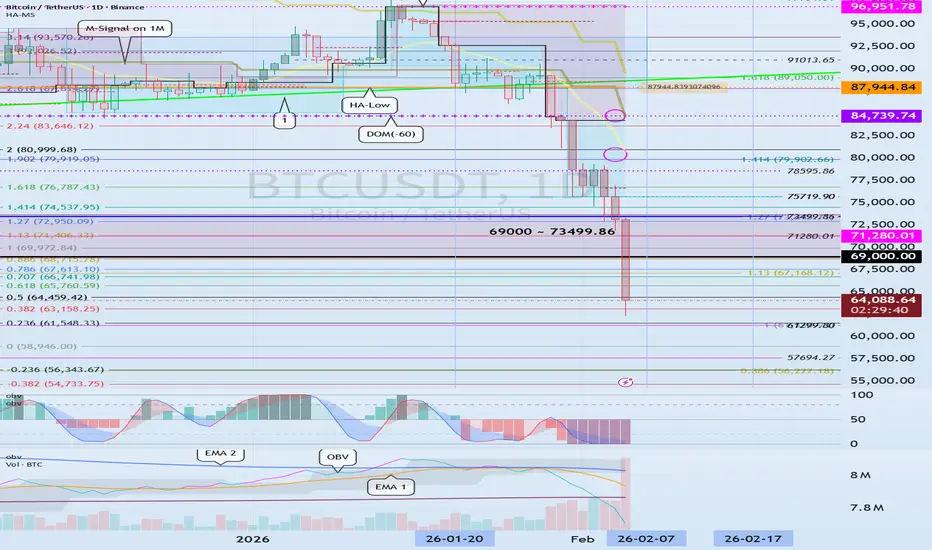
(BTCUSDT 1M Chart)
The price fell from the critical 69,000 - 73,499.86 range.
We need to see if it finds support near the previous high of 57694.27 to 61299.80.
I believe the price range it cannot return to is below the 42283.58 to 43823.59 range.
-
(1D chart)
This period of volatility is expected to last from February 6th to 8th.
Therefore, the key question i
2063.38 ~ 2261.70: Support zone forming
Hello, traders!
Follow us to get the latest information quickly.
Have a great day!
-------------------------------------
(ETHUSDT 1D chart)
The current position can be viewed from two perspectives.
First, we need to consider whether the price can rise after finding support in the 1597.76 ~ 1879.61 range.
This is because, as seen in the chart above (), if it declines, it will enter a range with no end in sight.
Therefore, to maintain the uptrend, the price must remain above the 1597.76 ~
The key is whether the USDT and USDC gap downtrend will stop
Hello, fellow traders!
Follow us to get the latest information quickly.
Have a great day.
-------------------------------------
(USDT 1D chart)
USDT is showing a gap downtrend, leading to a decline in the coin market.
A gap downtrend in USDT or USDC can be interpreted as a sign of capital outflow from the coin market.
The key question is whether this gap-up will lead to another upward trend.
(USDC 1D chart)
USDC is also showing a gap-up trend.
It's worth paying attention to the movemen
The key is whether it can rise above 79.9K ~ 80.9K
Hello, fellow traders!
Follow us to get the latest information quickly.
Have a great day.
-------------------------------------
#BTCUSDT
It's testing support near the left Fibonacci level of 1.618 (76787.43).
The key to this uptrend is whether it can break above the Fibonacci 1.902 (79902.66) level on the right and Fibonacci 2 (80999.68) levels on the left.
If it fails to rise, it could lead to further declines, so we need to consider countermeasures.
The maximum decline is expected to b
NQ1 - February Outlook 2026February is a pressure month for tech:
- CPI is the biggest macro swing
- NVDA is the biggest micro swing
- Payrolls sets the tone
- Geopolitics keeps volatility elevated
- Tech valuations remain stretched
Downward Catalysts:
1. Payrolls (This Week)
- Hot print → yields up → tech down
2. CPI (Feb 11)
- The single biggest macro event of February
- CPI > 0.4% MoM → Nasdaq could drop 3–5% in 48 hours
3. NVDA Earnings (Late Feb)
- The single biggest micro event of February
LOOK FOR:
- AI CapEx
Studying charts is all about checking for support
Hello, fellow traders.
If you "Follow," you'll always get the latest information quickly.
Have a great day.
-------------------------------------
It's important to see what the trend will be like after February 5th.
The next period of volatility is expected to be around March 2nd.
At this time, the key focus is on whether the price rises above 2887.66 or supports near the newly created HA-Low indicator.
To do this, we need to see if the price can rise above 2415.95, the StochRSI 50 indic
xauusd sell sl : tp 1:2 Gold Master is where precision meets profitability.
Our gold trading signals are built on a powerful, well-tested system designed to capture strong market moves with controlled risk.
In highly volatile gold markets, Gold Master delivers structured entries, clear targets, and a risk-to-reward approach that keeps traders protected while maximizing opportunities.
Every trade is based on logic, timing, and market behavior — not guesses or emotions.
Follow the results, track the performance, and expe
Check if support can be found in the 2419.83 ~ 2706.15 range
Hello, fellow traders!
Follow us to get the latest information quickly.
Have a great day.
-------------------------------------
(ETHUSDT 1D + 15m chart)
We need to see how the price moves after the volatile period from around January 28th to around February 4th.
The key question is whether the price can find support near the crucial 2419.83 - 2706.15 range and rise.
If not, it is expected to touch the final downtrend area of 1597.76 - 1861.57.
Looking at the 15m chart, the DOM (-60) in
When a step-down trend is occurring, you should trade more
Hello, fellow traders!
Follow me to get the latest information quickly.
Have a great day.
-------------------------------------
#BTCUSDT
The price is falling in the DOM(-60) ~ HA-Low range, increasing the likelihood of a step-down trend.
Therefore, the key question is whether it can rise above 84739.74.
If not,
1st: 79902.66 ~ 80999.68
2nd: 76787.43
You should check for support near the first and second levels above.
The most important range is 69000 ~ 73499.86. As the price approaches t
The key is whether it can rise above 17.07 ~ 32.06
Hello, fellow traders.
If you "Follow" me, you'll always get the latest information quickly.
Have a great day.
-------------------------------------
(Vale S.A. Sponsored ADR 1M Chart)
The key is whether the price can break above the Fibonacci level of 0.618 (17.07) on the left and 0.618 (32.06) on the right.
-
(1D Chart)
To do this, we need to see if the price can sustain above 15.40 and rise.
If it falls, we need to check for support around 12.72 to 14.0.
To break above a key point or
Check for support near 29.20
Hello, fellow traders!
Follow us to get the latest information quickly.
Have a great day!
-------------------------------------
(CMCSA 12M chart)
CMCSA is located near key support and resistance levels.
If it falls below 27.78, it could fall to around 12.90. Therefore, to sustain the uptrend, it must find support near 27.78.
-
(1D chart)
Since the price is below the M-Signal indicator on the 1M chart, the top priority is to see if it can rise above the M-Signal indicator and maintain its
Example of How to Check Support
Hello, fellow traders.
By "Following," you'll always get the latest information quickly.
Have a great day.
-------------------------------------
How can we confirm that the price is supported at support and resistance levels?
While support can be determined over time, it's not always easy to tell when support is being tested.
The indicators we focus on are the HA-Low and HA-High indicators.
Then, in combination with the DOM(-60) and DOM(60) indicators, we identify low and high ranges an
The key is whether the price can rise above the uptrend line
Hello, fellow traders.
By "Following," you can always get the latest information quickly. Have a great day today.
-------------------------------------
#ETHUSDT
We need to observe the price action from around January 28th to February 4th.
The key is whether it can find support around the 2.828.57 to 2.887.66 range and rise above the uptrend line.
If it fails to rise, we need to check for support around the 2.419.83 to 2.706.15 range.
If the decline continues, the maximum decline is expec
Next Volatility Period: Around February 7th
Hello, fellow traders!
Follow us to get the latest information quickly.
Have a great day!
-------------------------------------
I believe BTC is currently at a critical crossroads, where it's either going to continue its uptrend or turn into a downtrend.
(BTCUSDT 1M Chart)
Therefore, support near the M-Signal indicator on the 1M chart is crucial.
Looking at this month's candlestick chart, the StochRSI 20 indicator appears to have formed a new point, rising from 37,155.0 to 87,550.43.
The
Rostock24:BTC Sharply Loses Momentum After Updating Local HighsAt Rostock24, we analyze Bitcoin’s behavior across different timeframes daily and observe a recurring scenario: BTC confidently breaks a local high, rises 8–15% over several days, attracts media and community attention — then loses almost all the gained momentum within 1–5 days, falling into a 10–25% correction. Such episodes have become more frequent in 2025–2026 and spark heated debates: “the bulls gave up,” “this is already the top,” “the bears are back.”
In reality, sharp pullbacks after new
Roxtengraphs: Why “Reliable” Crypto Assets Became UnpredictableAt Roxtengraphs, we track the daily behavior of major crypto assets and consistently observe the same pattern: Bitcoin and Ethereum — once viewed as “digital gold” and “digital oil” — increasingly exhibit chaotic, expectation-breaking movements. In 2025–2026, the market has repeatedly shown: BTC surges 15–20% in a week with no clear catalyst, then corrects by the same amount in just 2–3 days; ETH follows a similar trajectory but with even greater amplitude. Long-term holders (HODLers) and instit
Downdraft in DoorDash?DoorDash hit a record high in late 2025, but now it may face downside.
The first pattern on today’s chart is the price action on October 16. The delivery stock hit a record high, but was rejected and closed under the previous session’s low. Prices remained below the outside day, confirming it as a bearish reversal pattern.
Second, DASH gapped lower on November 6 following quarterly results. It tried to rebound but was rejected six weeks later.
Next, the 50-day simple moving average (SMA) had
See if the price can hold above the M-Signal indicator on the 1D
Hello, fellow traders!
Follow us to get the latest information quickly.
Have a great day!
-------------------------------------
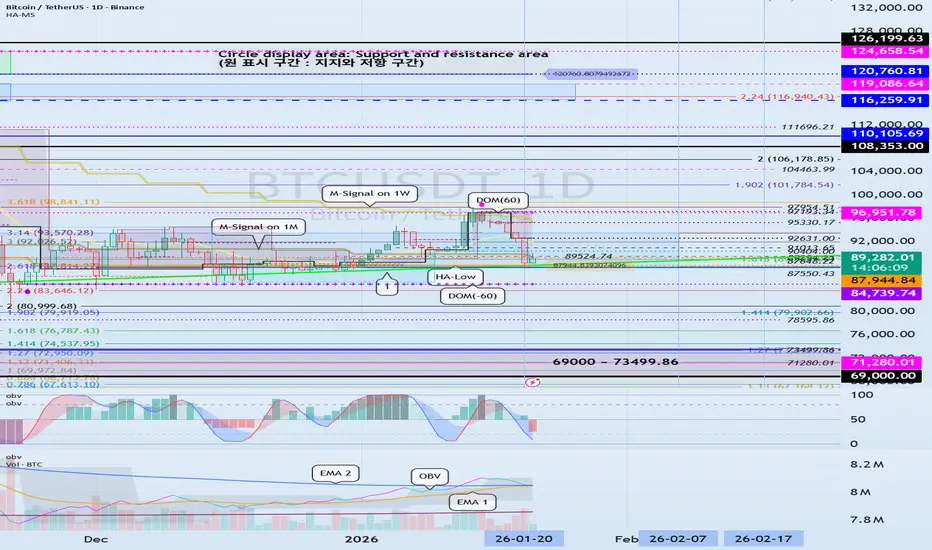
(BTCUSDT 1D chart)
This period of volatility is expected to last until January 21st.
The key question is whether the price can maintain its upward momentum by rising above the left Fibonacci level of 3.14 (93570.28) after this period of volatility.
To sustain the uptrend, the price must rise above the M-Siganl indicator on the 1W chart.
Therefore, the price must