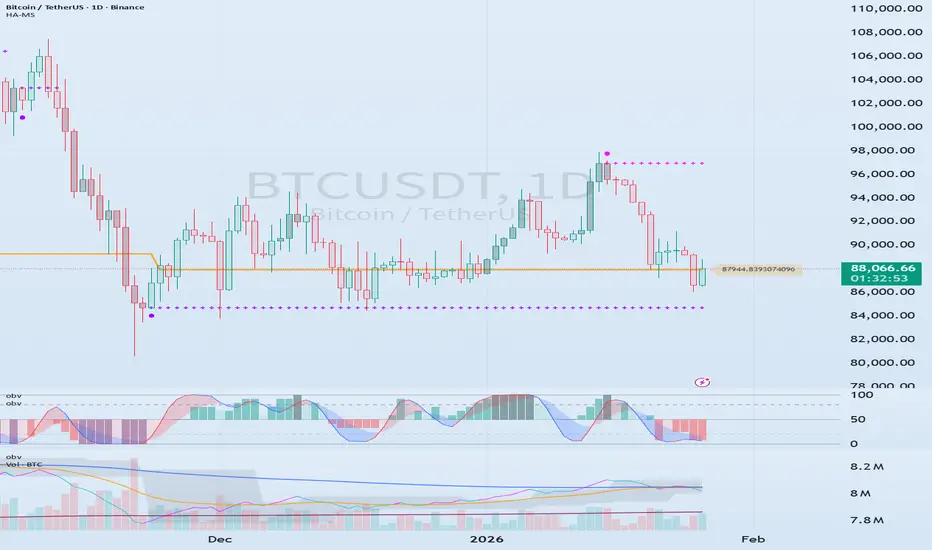
The key is whether the USDT and USDC gap downtrend will stop
Hello, fellow traders!
Follow us to get the latest information quickly.
Have a great day.
-------------------------------------
(USDT 1D chart)
USDT is showing a gap downtrend, leading to a decline in the coin market.
A gap downtrend in USDT or USDC can be interpreted as a sign of capital outflow from the coin market.
The key question is whether this gap-up will lead to another upward trend.
(USDC 1D chart)
USDC is also showing a gap-up trend.
It's worth paying attention to the movements of USDT, which has a significant impact on the coin market.
-
(USDT.D 1M chart)
USDT is showing a gap-down trend, leading to an increase in USDT dominance.
A rising USDT dominance is likely to lead to a downward trend in the coin market.
Therefore, it's beneficial to see a declining USDT dominance.
This means that funds are flowing into the coin market through USDT, and the inflow of USDT is used to purchase coins, causing USDT dominance to decline.
-
(BTC.D 1M chart)
As BTC dominance rises, I believe funds will flock to BTC, creating a BTC-led market.
Therefore, we expect an altcoin bull market to emerge when BTC dominance and USDT dominance coincide.
For this to occur, BTC dominance must fall below 55.01 and either remain stable or exhibit a downward trend.
-
Currently, USDT dominance is rising, while BTC dominance is falling.
I believe this movement is best interpreted as altcoins focusing on price defense.
The decline in BTC dominance indicates that funds are flocking to altcoins, while the rise in USDT dominance indicates a downward trend in the coin market.
-
Therefore,
we need to determine whether the upward trend of USDT and USDC can be sustained,
starting with the recent gap-up,
see whether the upward trend of USDT dominance has stalled,
and whether BTC dominance can support the price of BTC.
While the USDT, USDC, BTC.D, and USDT.D charts only provide a rough idea of the fund flow in the coin market, I believe this information alone is a valuable resource for individual investors who trade with limited information.
Therefore, I believe this is one of the reasons why the coin market is more transparent than any other investment market.
-
Thank you for reading to the end.
I wish you successful trading.
--------------------------------------------------
 Education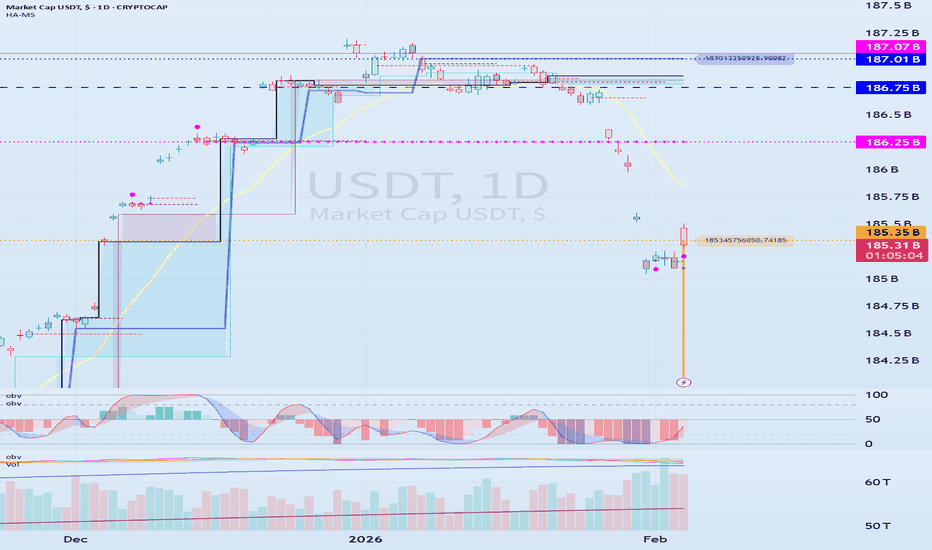
 Education

 Short
Short
Studying charts is all about checking for support
Hello, fellow traders.
If you "Follow," you'll always get the latest information quickly.
Have a great day.
-------------------------------------
It's important to see what the trend will be like after February 5th.
The next period of volatility is expected to be around March 2nd.
At this time, the key focus is on whether the price rises above 2887.66 or supports near the newly created HA-Low indicator.
To do this, we need to see if the price can rise above 2415.95, the StochRSI 50 indicator level, and maintain its position.
If the price fails to rise, we should check for support around 1597.76 to 1879.61, which is considered the maximum decline.
To break above a key point or range and maintain an uptrend, the StochRSI, BSSC, and OBV indicators must show upward trends.
In particular, the BSSC indicator should remain above zero, and the OBV indicator should rise above its High Line and remain there.
In this case, it's even better if the StochRSI indicator hasn't entered an overbought zone.
Considering these conditions, it's still too early to continue the uptrend.
-
Whether the price rises or falls, the most important thing is how to profit.
To profit, you can either buy at a lower price and hold a profit, or increase your holdings of coins (tokens) with an average purchase price of zero, ultimately increasing your profits.
Therefore, while buying when the price is rising will naturally lead to profits, buying when the price is falling will most likely result in losses. Therefore, increasing your holdings using conventional methods is not possible.
Even if you increase the number of coins (tokens) you hold, you would have purchased them with more investment capital.
Therefore, you should increase your holdings by selling your coins (tokens) before a decline and buying them again afterward.
It's not easy to know when the price will decline, but if you see resistance at the support and resistance points you've drawn on your chart, you can trade using the method above.
To do this, the key is how to draw support and resistance points.
Support and resistance points are usually marked by designating a volume profile based on the arrangement of candlesticks and then marking them accordingly.
However, since these markings are prone to subjective opinions, it's better to use objective information to mark support and resistance points.
Even if the indicated support and resistance points are drawn incorrectly, it's not a bad idea if there's a way to check whether support exists near them.
What we need to study isn't wave theory or harmonic theory.
What we need to learn is how to determine whether support and resistance levels are supportive.
And we need to practice developing trading strategies accordingly.
-
When I first started studying charts, I studied them through various books and online resources.
I also listened to the advice of broadcasters on internet channels, but ultimately, I found them ineffective.
Looking back, I realized that because I didn't have a basic trading strategy that suited me, no matter what I studied or what information I gathered, it didn't work in actual trading.
I use the grandiose term "basic trading strategy," but it's more accurate to think of it as determining where to buy and where to sell.
While determining where to buy is important, as I mentioned earlier, if you can identify support and resistance levels within the support and resistance levels you've drawn, you'll naturally know where to buy and sell.
To find specific pulse points, you need to understand where the volume profile is located, and this can be done using various indicators.
-
To achieve this, the basic trading strategy I'm suggesting is to buy in the DOM(-60) ~ HA-Low range and sell in the HA-High ~ DOM(60) range.
I've created this basic trading strategy as an indicator so everyone can easily see it, and I'm consistently publishing ideas to explain how to interpret and utilize it.
-
Thank you for reading to the end.
I wish you successful trading.
--------------------------------------------------
 Education
Check if support can be found in the 2419.83 ~ 2706.15 range
Hello, fellow traders!
Follow us to get the latest information quickly.
Have a great day.
-------------------------------------
(ETHUSDT 1D + 15m chart)
We need to see how the price moves after the volatile period from around January 28th to around February 4th.
The key question is whether the price can find support near the crucial 2419.83 - 2706.15 range and rise.
If not, it is expected to touch the final downtrend area of 1597.76 - 1861.57.
Looking at the 15m chart, the DOM (-60) indicator is forming at 2352.96 and showing an upward trend.
Consequently, the HA-Low indicator has formed at 2385.04.
Consequently, the key question is whether the price can find support near 2352.96 - 2385.04 and rise above 2419.83.
If the price falls below the 2352.96 - 2385.04 range, a continued stepwise downtrend is likely, so we need to consider a response plan.
-
The BSSC indicator has risen above the 0 level.
This indicates a strong buying trend.
However, on the 1D chart, the BSSC indicator is below 0, indicating a strong selling trend overall.
The StochRSI indicator on the 15m chart is showing signs of entering an overbought zone, suggesting a potential restraint on the upside.
Therefore, the key question is whether support will be found near 2419.83.
The OBV indicator has entered the Low Line to High Line range, indicating a sideways movement.
Currently, the Low Line to High Line range is forming a downward channel, indicating a downward sideways movement.
Therefore, to break above the critical 2419.83 level and continue the uptrend, the StochRSI, BSSC, and OBV indicators must show upward trends.
If possible,
1. The StochRSI indicator should not have entered the overbought zone.
2. The BSSC indicator should remain above zero.
3. The OBV indicator should remain above the High Line.
If the above conditions are met when checking for support near 2419.83, an upward trend is expected to occur, likely reaching 2706.15 or higher.
----------------------------------------------------------------------
The advantage of the coin market is the ability to trade in decimal units.
Trading in decimal units allows for easy adjustments to the number of coins (tokens) held.
For example, let's say you bought after seeing support at 2419.83, but then it pretended to rise and then fell to below 2338.79.
In this case, if you sold some of the amount you bought at 2419.83 when the price on the 15m chart showed signs of falling below the HA-Low indicator level of 2385.04, you would have incurred a loss.
However, if you bought back the same amount you sold around 2385.04 when the price fell and then found support again, your total coin (token) holdings would have increased.
Increasing your coin (token) holdings in this way will ultimately lead to a quick profit.
Also, let's assume you bought when the price fell and then found support, i.e., when it found support in the 2352.96 to 2385.04 range.
If you sell the amount you bought when resistance appears near the crucial point of 2419.83, you will still have the number of coins (tokens) you hold, which corresponds to your profit.
Regardless of how you trade, if you increase the number of coins (tokens) you hold, which corresponds to your profit, you have a very high chance of achieving significant profits in the long term.
In the stock market, trading is done on a weekly basis, so the only way to generate cash profits is to sell when the price rises.
The only way to increase your stock holdings was to invest your investment funds and buy them.
Because we are accustomed to this trading method, we fail to fully utilize the advantages of the coin market.
Therefore, even if you interpret stock and coin charts in the same way, there are significant differences in trading strategies, which is why you will incur higher losses when trading in the coin market for the first time.
The key to understanding charts is to identify tradable support and resistance levels.
Interpreting anything beyond this point is meaningless for a trader.
Therefore, if you've drawn support and resistance points through chart analysis, you need to consider how to trade based on whether support is present or not.
To develop a trading strategy, you need a basic trading strategy.
My current basic trading strategy is to buy when support is found in the DOM(-60) ~ HA-Low range and sell when resistance is found in the HA-High ~ DOM(60) range.
If the HA-High ~ DOM(60) range rises, a step-up trend is likely, while if the DOM(-60) ~ HA-Low range falls, a step-down trend is likely.
Therefore, you should use a split trading method.
Our goal is to maximize cash returns.
However, due to limited investment funds, simply buying and selling (trading in the traditional stock market) is unlikely to yield significant returns.
Therefore, what we need to focus on is somehow increasing the number of coins (tokens) we hold.
-
Thank you for reading to the end.
We wish you a successful transaction.
--------------------------------------------------
When a step-down trend is occurring, you should trade more
Hello, fellow traders!
Follow me to get the latest information quickly.
Have a great day.
-------------------------------------
#BTCUSDT
The price is falling in the DOM(-60) ~ HA-Low range, increasing the likelihood of a step-down trend.
Therefore, the key question is whether it can rise above 84739.74.
If not,
1st: 79902.66 ~ 80999.68
2nd: 76787.43
You should check for support near the first and second levels above.
The most important range is 69000 ~ 73499.86. As the price approaches this range, you should observe whether trading volume increases and a trend toward an upward turn is observed.
The advantage of the coin market is that you can trade in decimal units.
This allows for a less burdensome trading environment.
If you sell when the price drops to 84739.74, you can buy back the same amount you sold at any point before the price rises above 84739.74, thereby increasing your coin (token) count.
Since the stock market trades in one-week increments, even if the price falls significantly, the number of shares sold remains constant. Therefore, the transaction is completed with a sell.
The coin market also allows for the purchase of decimals, even for the most expensive coins (tokens), making it easy to purchase the desired coin (token).
Therefore, holding a large number of coins (tokens) is crucial in the coin market.
Regardless of whether the price is rising or falling, you should strive to increase your holdings by any means necessary.
If your goal is day trading, you can trade similarly to how you would in a traditional stock market.
If, on the other hand, you want to increase your holdings while also generating cash profits, you should retain the coins (tokens) corresponding to your cash profits to increase your holdings.
When a cascading downtrend is observed, it's wise to make bold trades to increase the number of coins (tokens) corresponding to your profits.
This is because a cascading downtrend always ends in an uptrend.
-
Thank you for reading to the end.
We wish you successful trading.
--------------------------------------------------
- Here's an explanation of the big picture.
(3-year bull market, 1-year bear market pattern)
I'll explain more in detail when the bear market begins.
------------------------------------------------------
Check for support near 29.20
Hello, fellow traders!
Follow us to get the latest information quickly.
Have a great day!
-------------------------------------
(CMCSA 12M chart)
CMCSA is located near key support and resistance levels.
If it falls below 27.78, it could fall to around 12.90. Therefore, to sustain the uptrend, it must find support near 27.78.
-
(1D chart)
Since the price is below the M-Signal indicator on the 1M chart, the top priority is to see if it can rise above the M-Signal indicator and maintain its upward momentum.
To achieve this, it must find support at three support and resistance levels and then rise.
The three support and resistance levels are:
29.20,
27.78 ~ 28.03, and
26.65.
Since a volume profile zone has formed at 26.65, the area around 26.65 is the most important support and resistance point among the three support and resistance levels.
However, if the price declines from 29.20 or 27.78 to 28.03, there's a high possibility of strong selling pressure, so caution is advised when trading.
A full-blown uptrend is likely to begin with an upward breakout above 35.09.
To ensure this, check for upward trends in the StochRSI, TC, and OBV indicators.
-
Thank you for reading to the end.
I wish you successful trading.
--------------------------------------------------
Example of How to Check Support
Hello, fellow traders.
By "Following," you'll always get the latest information quickly.
Have a great day.
-------------------------------------
How can we confirm that the price is supported at support and resistance levels?
While support can be determined over time, it's not always easy to tell when support is being tested.
The indicators we focus on are the HA-Low and HA-High indicators.
Then, in combination with the DOM(-60) and DOM(60) indicators, we identify low and high ranges and respond based on whether they are supported.
In other words, we can use the basic trading strategy of buying if support is found in the DOM(-60) to HA-Low range, and selling if resistance is found in the HA-High to DOM(60) range.
-
The current price is located near the DOM(-60) ~ HA-Low range.
The DOM(-60) indicator has been maintained since its creation.
Therefore, we can see that support is currently being tested near the DOM(-60) ~ HA-Low range.
So, how can we determine if support is found and an upward trend is possible?
This can be predicted by observing the movements of the OBV, StochRSI, and TC indicators.
Since the current price is located near the HA-Low indicator, for the HA-Low indicator to support the price and move upward, the StochRSI, TC, and OBV indicators must be trending upward.
If possible,
1. The StochRSI indicator should not have entered the overbought zone.
2. The TC indicator should remain above zero.
3. The OBV indicator should remain above the High Line.
Applying the above conditions, we can see that support is still present and the likelihood of an upward trend is low.
Even under these conditions, if the price remains near the DOM(-60) ~ HA-Low range, we can say that support is present.
-
To examine the situation in more detail, let's examine the movement on the 15m chart.
To determine whether support exists near the HA-Low indicator point on the 1D chart, I've marked the HA-Low indicator point on the 1D chart.
The DOM(-60) and HA-Low indicators are generated on the 15m chart, and the upward movement is testing support as it meets the DOM(60) indicator.
Therefore, even if the price declines from the HA-Low indicator point (87944.84) on the 1D chart, if it maintains around the DOM (-60) ~ HA-Low range on the 15m chart, it will likely attempt to rise again.
To achieve this, as mentioned earlier, we must monitor the movements of the StochRSI, TC, and OBV indicators.
If the StochRSI indicator enters the overbought zone, the upward movement may be limited.
Therefore, to sustain the uptrend, it is best to ensure the StochRSI indicator has not entered the overbought zone.
The TC indicator is a comprehensive evaluation of the OBV + PVT + StochRSI indicators. An increase above the zero point indicates that buying pressure is dominant, while a decrease indicates that selling pressure is dominant.
Therefore, even if the TC indicator shows an upward trend, the uptrend is likely to continue only if it rises above the zero point.
The OBV indicator should be divided into three sections:
1. Low Line ~ High Line
2. Above the High Line
3. Below the Low Line
1. Low Line ~ High Line
If the OBV indicator is within the Low Line ~ High Line range, it is best to assume that the price has entered a sideways trading range.
Whether this sideways trading range is bullish or bearish can be determined by examining the trend of the channel formed by the Low Line ~ High Line.
Since the channel formed by the Low Line ~ High Line is currently forming an upward channel, it should be interpreted as being within a bullish sideways trading range.
2. Above the High Line
For the price to break out of the sideways trading range and enter an uptrend, it must rise above the High Line.
3. Below the Low Line
For the price to break out of the sideways trading range and enter a downtrend, it must fall below the Low Line.
Therefore, based on the movements of the StochRSI, TC, and OBV indicators, we should consider the current price unlikely to continue its upward trend and develop a response strategy.
-
Support may require observing the price movement for 1 to 3 days.
However, the price has been held near the DOM (-60) ~ HA-Low range for over two months.
Therefore, it's correct to interpret the current price as being in an upward sideways range.
If the OBV indicator falls below the Low Line and then below the DOM (-60) indicator, it will break out of the sideways range and enter a downtrend.
This is the answer to the question of whether the current price is supported.
For the price to show an upward trend, it must rise above at least DOM(-60) to HA-Low.
To create a stepwise uptrend, or a full-blown uptrend, it must rise above HA-High to DOM(60).
Therefore, if the current price rises from the DOM(-60) to HA-Low range, the resistance zone will be the HA-High to DOM(60) range.
Since the HA-High and HA-Low indicators are the most important indicators, the price must rise above the HA-High indicator and remain there for a full-blown uptrend to occur.
-
Thank you for reading to the end.
I wish you successful trading.
--------------------------------------------------
Education 
The key is whether the price can rise above the uptrend line
Hello, fellow traders.
By "Following," you can always get the latest information quickly. Have a great day today.
-------------------------------------
#ETHUSDT
We need to observe the price action from around January 28th to February 4th.
The key is whether it can find support around the 2.828.57 to 2.887.66 range and rise above the uptrend line.
If it fails to rise, we need to check for support around the 2.419.83 to 2.706.15 range.
If the decline continues, the maximum decline is expected to be around the 1597.76 to 1861.57 range.
-
If it falls below the HA-Low indicator on the 1D chart, a stepwise downtrend is likely.
Since the downtrend ends with an uptrend, trading to increase the coins (tokens) corresponding to the profits is possible.
The basic trading strategy is to buy in the DOM(-60) ~ HA-Low range and sell in the HA-High ~ DOM(60) range.
The time to stop increasing the amount of coins (tokens) representing profits is when the price rises above the M-Signal indicator on the 1M chart and shows support.
This is because increasing the amount of coins (tokens) representing profits when the price is trending upward can actually decrease the number of coins (tokens).
To continue the uptrend by breaking above a key point or range, the StochRSI, TC, and OBV indicators must show upward trends.
If possible,
1. The StochRSI indicator should not have entered the overbought zone.
2. The TC indicator should remain above 0.
3. The OBV indicator should remain above the High Line.
If the above conditions are not met, caution is required when trading, as the price may only pretend to rise and then fall again.
-
Thank you for reading to the end.
I wish you successful trading.
--------------------------------------------------
Next Volatility Period: Around February 7th
Hello, fellow traders!
Follow us to get the latest information quickly.
Have a great day!
-------------------------------------
I believe BTC is currently at a critical crossroads, where it's either going to continue its uptrend or turn into a downtrend.
(BTCUSDT 1M Chart)
Therefore, support near the M-Signal indicator on the 1M chart is crucial.
Looking at this month's candlestick chart, the StochRSI 20 indicator appears to have formed a new point, rising from 37,155.0 to 87,550.43.
Therefore, caution is advised, as a decline below 87,550.43 could lead to a decline toward the next support and resistance level, near 73,499.86.
Even if the M-Signal indicator on the 1M chart rises above the OBV High indicator at 97,954.51, an uptrend is expected only if it rises above this level.
-
(1W chart)
The key is whether the price can rise along the rising trend line (1).
Furthermore, to maintain the price above the M-Signal indicator on the 1M chart, it is crucial to see if the price can rise above the 91013.65 level, which is the StochRSI 50 indicator point, to find support.
-
(1D chart)
The next volatility period is expected to begin around February 7th.
However, since the volatility period shown on the 1W chart is in April, the main volatility period is expected to occur in April.
As the next volatility period passes, the key point to watch is whether the price continues to rise along the rising trend line (1).
Therefore, the price must remain above 89524.74 at the very least.
Currently, the M-Signal on the 1W chart > M-Signal on the 1D chart > M-Signal on the 1M chart, so a complete reversal has not yet occurred.
Therefore, if support is found near the M-Signal indicator on the 1M chart this time, it is expected to move upwards above the M-Signal indicator on the 1W chart.
Considering these points,
1. Key areas to protect: Left Fibonacci ratio 2.618 (87814.27) ~ Left Fibonacci ratio 3.14 (93570.28)
To protect the first key area, support is needed around the 84739.74 ~ 87944.84 area.
To turn to an uptrend and continue the uptrend, the M-Signal indicator on the 1W chart must rise above this level. Based on the current position, this is expected to occur only if the price rises above 95330.17.
-
(15m chart)
For the Heikin-Ashi candlestick to turn bullish, it needs to rise near 92631.0. It's rising.
Based on the chart movement, I believe a rise above 92631.0 will signal a reversal.
Since the M-Signal indicator on the 1D chart is passing near 92631.0, we believe the price must ultimately rise above the M-Signal indicator to maintain its upward momentum.
My basic trading strategy is to buy in the DOM(-60) ~ HA-Low range and sell in the HA-High ~ DOM(60) range.
However, if the price rises from the HA-High to DOM(60) range, it could exhibit a step-like upward trend. If the price falls from the DOM(-60) to HA-Low range, it could exhibit a step-like downward trend.
Therefore, it's recommended to trade using a split trading method.
Looking at the current 15m chart, the DOM(-60) and HA-Low indicators were generated and then rose, but only slightly, generating the DOM(60) indicator.
Therefore, to sustain the upward trend, the DOM(60) indicator must break above the level.
Once you've identified a key point or range, you need to determine whether a break above that point or range can sustain the upward trend.
For this purpose, we use the StochRSI, TC, and OBV indicators.
The StochRSI, TC, and OBV indicators should all be showing upward trends.
If possible, the StochRSI indicator should not have entered an overbought zone. The TC indicator should remain at 0.
The OBV indicator should remain above the High Line.
If the above conditions hold when the DOM (60) indicator breaks above, an attempt to rise above 92631.0 is expected.
If not, a decline towards the HA-Low indicator is likely.
--------------------------------------------------
The final destination is likely to be near the 69K to 73499.86 range, as mentioned at the start of the decline.
However, as always, there is a possibility of a smaller decline and a subsequent rise. Therefore, we need to closely monitor the upward trend, especially when the price rises above the left Fibonacci 2.618 (87814.27) to left Fibonacci 3.14 (93570.28) range and sustains.
Every investor wants to buy at a lower price. However, caution is required, as buying when the price is in a downward trend can be extremely burdensome.
Currently, the price is near the HA-Low indicator on the 1D chart, so if the price falls, it is likely to experience a step-down trend.
This step-down trend ultimately signals a reversal to the upside, so aggressive buying is acceptable. However, investment allocation should be adjusted, as additional buying will be necessary when the HA-Low indicator is met again.
-
Thank you for reading to the end.
I wish you successful trading.
--------------------------------------------------
Rostock24:BTC Sharply Loses Momentum After Updating Local HighsAt Rostock24, we analyze Bitcoin’s behavior across different timeframes daily and observe a recurring scenario: BTC confidently breaks a local high, rises 8–15% over several days, attracts media and community attention — then loses almost all the gained momentum within 1–5 days, falling into a 10–25% correction. Such episodes have become more frequent in 2025–2026 and spark heated debates: “the bulls gave up,” “this is already the top,” “the bears are back.”
In reality, sharp pullbacks after new highs are not a sign of market weakness — they are a perfectly natural and even healthy reaction. Let’s break down the main reasons why Bitcoin so often “runs out of steam” at new peaks.
Profit-Taking by Large Players
Large holders (whales, early miners, corporate treasuries, funds) take profits precisely at levels where price updates historical or local highs. For them, this is logical: the price has reached a target level where large sell orders were previously placed (take-profit), or a favorable risk/reward ratio has simply been achieved.
When several large orders execute simultaneously on spot or via OTC — price receives a strong downward impulse. Trading volume in these moments often does not increase, and may even decline — this is the classic sign of “selling into strength” without panic.
Rostock24 observes: after every significant breakout (e.g., above $95k, $105k, $115k in 2025–2026), noticeable outflows from large wallets occur within the first 24–72 hours.
Liquidation Cascades on Futures
More than 70–80% of Bitcoin trading volume occurs on perpetual futures with high leverage. After a strong rally, open interest reaches local peaks, and most new positions are longs opened on FOMO.
As soon as price reverses down 2–4% — a cascade of long liquidations begins → automated selling → price falls further → new wave of liquidations. When liquidations exceed $800 million – $1.5 billion in just a few hours, the correction accelerates exponentially.
Rostock24 emphasizes: the deepest intraday and daily pullbacks after highs are almost always accompanied by peaks in long-side liquidations.
Weakening Buying Pressure
At new highs, buying pressure naturally weakens:
FOMO retail has already entered,
conservative investors wait for a pullback to buy,
algorithms and market makers stop aggressively supporting the upside.
When aggressive buyers decrease and sellers (profit-takers + liquidations) become active — the balance of power shifts downward. This does not necessarily mean the end of the trend — it is simply the market “digesting” the move.
Market Expectations and Revaluation of Growth
After a strong upward impulse, the market often overestimates the speed and strength of the rally: “if we reached $120k so quickly, $150k is already tomorrow.” When price fails to meet inflated expectations in the coming days/weeks — disappointment sets in and profit-taking follows.
This is classic psychology: participants who entered at $100k–$110k want to see at least +30–50% within a month. If growth slows — many close positions to lock in the profit they already have.
Crowd Psychology After New Highs
Updating highs triggers euphoria: social networks, chats, streams fill with “to the moon,” “this is just the beginning.” But the peak of euphoria most often coincides with the local top. As soon as the first pullback appears — euphoria turns to fear: “that’s it, fake breakout,” “we’re trapped again.”
This mood swing amplifies selling: people who just entered at the highs begin to panic-sell, creating additional downward pressure.
Rostock24 notes: the Fear & Greed Index almost always reaches the “Extreme Greed” zone right before sharp corrections following breakouts.
Conclusion
Corrections after rallies are a natural part of the market, not a sign of its weakness. Bitcoin is not required to grow in a straight line. After every strong impulse, the market needs a breather: profit-taking, liquidations, reduced buying pressure, revaluation of expectations, and psychological reset — all these are normal mechanisms of a healthy market.
At Rostock24 we help clients not fear such corrections, but use them:
identify probable profit-taking and liquidation-cascade zones in advance,
filter entries considering open interest, funding rates, and order-book depth,
avoid buying at the peak of euphoria,
treat pullbacks as accumulation opportunities.
The market has not become worse — it has become more mature and complex. The ability to survive corrections without panic and buy on dips is what separates survivors from those who constantly lose to emotions. Short 
Roxtengraphs: Why “Reliable” Crypto Assets Became UnpredictableAt Roxtengraphs, we track the daily behavior of major crypto assets and consistently observe the same pattern: Bitcoin and Ethereum — once viewed as “digital gold” and “digital oil” — increasingly exhibit chaotic, expectation-breaking movements. In 2025–2026, the market has repeatedly shown: BTC surges 15–20% in a week with no clear catalyst, then corrects by the same amount in just 2–3 days; ETH follows a similar trajectory but with even greater amplitude. Long-term holders (HODLers) and institutions expecting steady appreciation are now frequently caught in false breakouts and deep pullbacks.
Why has predictability disappeared even from top-tier assets? At Roxtengraphs, we identify five key structural shifts that have fundamentally altered market dynamics.
Rapid Capital Rotation
In the past, capital flowed into crypto for years — institutions accumulated BTC and ETH as long-term hedges. Today, rotation happens in weeks or even days. Funds quickly shift between BTC, ETH, SOL, memecoins, RWA tokens, and back to fiat/equities depending on the narrative of the moment.
In 2025–2026 we witnessed institutional inflows into Bitcoin ETFs followed by outflows during macro uncertainty, while ETH lost share due to competition from L2s and alternative L1s. This fast rotation amplifies volatility: there is no longer a “floor” created by multi-year holders — price reacts purely to short-term flows.
Roxtengraphs data shows: average holding time for BTC has shortened, and rotation velocity among top assets has increased 2–3× compared to 2021–2023.
Influence of Macro Expectations
Crypto now correlates more strongly than ever with macro factors: Fed rate expectations, inflation prints, geopolitics, corporate AI spending. When the market anticipates easing, crypto rallies as a high-beta asset. When tightening signals or recession fears emerge, it falls faster than equities.
In 2025 the Fed cut rates, but expectations about pace and depth shifted month to month — triggering sharp re-pricings. Bitcoin now often moves in lockstep with Nasdaq but with amplified beta, while Ethereum adds extra volatility through its DeFi ecosystem.
Roxtengraphs stresses: the old narrative of “BTC as an independent asset” is outdated. Macro now dominates on-chain metrics.
Growing Dominance of Derivatives
Over 70–80% of BTC and ETH trading volume occurs on perpetual futures with high leverage. Liquidation cascades dramatically exaggerate moves: a short squeeze pushes price 10–15% higher, then long liquidations drive an equal-or-greater drop. Funding rates and open interest create “price magnets” — the market frequently gravitates toward zones where large positions cluster.
At Roxtengraphs we observe: the sharpest reversals almost always occur exactly when price approaches major liquidation clusters, rather than fundamental events.
Liquidity Manipulation
Thin spot liquidity on many exchanges (especially outside the top 3) makes the market vulnerable to large orders. Algorithms, market makers, and whales can “sweep” the book, triggering cascading stops. During low-activity periods (Asian night, weekends) even $100–200 million can move price 5–10%.
This adds to the chaos: price stops reflecting genuine supply/demand and begins to follow order-flow and algorithmic logic.
Decline in Long-Term Holding (HODL Decay)
The share of long-term holders is shrinking: institutions rebalance more frequently, retail reacts to FOMO/FUD faster, corporate treasuries (e.g., MicroStrategy) occasionally take profits. Previously, HODLing created a natural price floor — that floor has largely disappeared.
Roxtengraphs on-chain metrics reveal: turnover has risen and average coin age has declined even among top assets.
Conclusion
Predictability has left the market — survival belongs to those who adapt, not those who try to predict. Major crypto assets are no longer “reliable” long-term holdings. They have become high-beta instruments, hypersensitive to macro flows, derivatives, liquidity sweeps, and algorithmic behavior.
At Roxtengraphs we help clients navigate exactly this reality:
real-time monitoring of liquidity levels and liquidation clusters,
filtering signals with macro context and funding-rate awareness,
employing conservative risk management to survive reversals without catastrophe,
focusing on adaptive strategies rather than “buy and hold forever.”
The market isn’t broken — it has evolved. Those who continue trading by 2020–2022 rules pay a high price. Those who understand the new mechanics gain the edge.  Short
Short
Downdraft in DoorDash?DoorDash hit a record high in late 2025, but now it may face downside.
The first pattern on today’s chart is the price action on October 16. The delivery stock hit a record high, but was rejected and closed under the previous session’s low. Prices remained below the outside day, confirming it as a bearish reversal pattern.
Second, DASH gapped lower on November 6 following quarterly results. It tried to rebound but was rejected six weeks later.
Next, the 50-day simple moving average (SMA) had a “death cross” below the 200-day SMA in late December. That may suggest its long-term direction has turned bearish.
Finally, MACD is falling and the 8-day exponential moving average (EMA) is below the 21-day EMA. Those signals may reflect a short-term downtrend.
TradeStation has, for decades, advanced the trading industry, providing access to stocks, options and futures. If you're born to trade, we could be for you. See our Overview for more.
Past performance, whether actual or indicated by historical tests of strategies, is no guarantee of future performance or success. There is a possibility that you may sustain a loss equal to or greater than your entire investment regardless of which asset class you trade (equities, options or futures); therefore, you should not invest or risk money that you cannot afford to lose. Online trading is not suitable for all investors. View the document titled Characteristics and Risks of Standardized Options at www.TradeStation.com . Before trading any asset class, customers must read the relevant risk disclosure statements on www.TradeStation.com . System access and trade placement and execution may be delayed or fail due to market volatility and volume, quote delays, system and software errors, Internet traffic, outages and other factors.
Securities and futures trading is offered to self-directed customers by TradeStation Securities, Inc., a broker-dealer registered with the Securities and Exchange Commission and a futures commission merchant licensed with the Commodity Futures Trading Commission). TradeStation Securities is a member of the Financial Industry Regulatory Authority, the National Futures Association, and a number of exchanges.
TradeStation Securities, Inc. and TradeStation Technologies, Inc. are each wholly owned subsidiaries of TradeStation Group, Inc., both operating, and providing products and services, under the TradeStation brand and trademark. When applying for, or purchasing, accounts, subscriptions, products and services, it is important that you know which company you will be dealing with. Visit www.TradeStation.com for further important information explaining what this means. See if the price can hold above the M-Signal indicator on the 1D
Hello, fellow traders!
Follow us to get the latest information quickly.
Have a great day!
-------------------------------------
(BTCUSDT 1D chart)
This period of volatility is expected to last until January 21st.
The key question is whether the price can maintain its upward momentum by rising above the left Fibonacci level of 3.14 (93570.28) after this period of volatility.
To sustain the uptrend, the price must rise above the M-Siganl indicator on the 1W chart.
Therefore, the price must ultimately rise above the StochRSI 80 level at 97193.34.
However, the most important indicators on the chart are the DOM (-60), HA-Low, DOM (60), and HA-High indicators.
Therefore, support must be found around the DOM (60) level at 96951.78 to sustain the uptrend.
-
If the price meets the HA-Low indicator and rises, then meets the HA-High indicator, the wave is considered reset and a new wave is determined.
Most often, a price meeting the HA-High indicator leads to a decline.
Currently, the price is showing a downward trend as it encounters the DOM (60) indicator.
Therefore, the wave cannot be considered reset.
Therefore, it may show an upward trend again after this period of volatility.
-
I use the StochRSI and On-Board Value (OBV) indicators as auxiliary indicators to help identify support and trends.
The strength of the trend can be predicted by observing the movements of the OBV indicator.
Currently, the OBV indicator has fallen below the High Line, indicating weakening upward momentum.
However, since it is still above EMA 1, the upward momentum is still dominant.
If the OBV indicator remains above EMA 2, it will rise above the High Line again, indicating a strengthening upward momentum.
There are several ways to interpret the OBV indicator.
Among these, the most important interpretation is the direction in which the OBV indicator is positioned relative to the zero point.
If it's above the zero point, it can be interpreted as a buying trend, while if it's below the zero point, it can be interpreted as a selling trend.
Another interpretation method I use is the one I use.
That is, it predicts the trend based on the direction in which the OBV indicator deviates from the Low Line to the High Line.
If the OBV indicator rises above the High Line, it can be interpreted as a bullish trend, while if it falls below the Low Line, it can be interpreted as a bearish trend.
Therefore, the current OBV indicator can be considered to have entered a sideways trading range, or a boxing range.
-
The OBV indicator is a leading indicator.
However, the StochRSI indicator can be considered a slower indicator than the OBV indicator.
However, it is not a completely lagging indicator.
I believe the StochRSI indicator signals a wave.
This is because it can predict price movements based on whether the 50 level is rising or falling.
Next, it determines whether the price is in an overbought or oversold zone.
The StochRSI 20, 50, and 80 indicators were created to visually represent this method of interpreting the StochRSI.
Each of these indicators acts as support and resistance.
The StochRSI 20 indicator can be interpreted as indicating a low, while the StochRSI 80 indicator can be interpreted as indicating a high.
Therefore, for a trend to form, the StochRSI must either fall below 20 or rise above 80.
Based on the movements of the OBV and StochRSI indicators above, the current price position suggests that it has re-entered the sideways or boxy range.
-
The tedious explanation above is actually unnecessary.
However, I explained it because it's important to understand why such indicators are displayed on the chart at least once.
The price is currently rising within the DOM(-60) ~ HA-Low range.
While it hasn't yet met the HA-High indicator, there's a possibility of further increase. However, since it has met the DOM(60) indicator, we can interpret this as a price correction.
Therefore, we can determine whether support is present by falling back to the DOM(-60) ~ HA-Low range.
It's important to note that the M-Signal indicator on the 1M chart is passing through the DOM(-60) ~ HA-Low range, and the current price is above it.
To sustain the uptrend, the price must remain above the M-Signal indicator on the 1M chart.
Therefore, we should consider buying based on whether there is support at:
1. the DOM(-60) ~ HA-Low range,
2. the StochRSI 20 indicator point,
3. the DOM(60) indicator point.
If the price rises above the DOM(60) indicator point of 96951.78, the next important support and resistance level is the 108353.0 ~ 110105.69 range.
-
Thank you for reading to the end.
I wish you successful trading.
--------------------------------------------------
- This is an explanation of the big picture.
(3-year bull market, 1-year bear market pattern)
I will explain in more detail when the bear market begins.
------------------------------------------------------
Support and Resistance Area: 140.88-146.69
Hello, traders!
Follow us to get the latest information quickly.
Have a great day!
-------------------------------------
(SOLUSDT 1D Chart)
SOLUSDT is entering a new phase with the emergence of the DOM(60) and HA-High indicators.
Accordingly, the key question is whether the price can rise while gaining support near the 140.88-146.69 level.
If not, it could fall below the 128.66-133.39 level and set a new low.
A decline below the M-Signal indicator on the 1M chart is highly likely to trigger a downtrend, so caution is advised when trading.
Therefore, we should set a buy point when the price rises above the M-Signal indicator on the 1M chart and maintains its level.
Since BTCUSDT's volatility period is around January 20th, we should monitor whether the price can rise above the M-Signal indicator on the 1M chart after this period.
-
To continue the uptrend by breaking above a key point or level, the StochRSI, TC, and OBV indicators must show upward trends.
If possible,
1. The StochRSI indicator should not have entered an overbought zone. 2. The TC indicator should remain above the 0 level.
3. The OBV indicator should remain above the High Line.
Looking at the current auxiliary indicators, we can see that the conditions for a sustained uptrend are not met.
Therefore, we should examine whether the conditions for a sustained uptrend can be met around the 140.88-146.69 range.
-
Thank you for reading to the end.
We wish you successful trading.
--------------------------------------------------
Next Volatility Period: Around January 20th
Hello, traders!
Follow us to get the latest information quickly.
Have a great day!
-------------------------------------
(BTCUSDT 1D chart)
This volatility period will last until January 11th.
The current price is above the M-Signal indicator on the 1M chart. To confirm this, we need to examine whether the price can rise to the left Fibonacci range of 3 (92026.52) - 3.14 (93570.28).
The StochRSI indicator has entered an oversold zone, and the On-Board Volume indicator is near the High Line.
Since the TC indicator is at 0, any movement is not surprising.
If the On-Board Volume indicator breaks above the High Line and the second EMA, and the price rises to the left Fibonacci range of 3 (92026.52) - 3.14 (93570.28), further upside is expected.
The next volatility period is around January 20th.
Therefore, as the next volatility period passes, we need to examine which of the circles on the chart it is near.
-
If the price falls below the 84739.74-87944.84 range, a step-down trend is likely, so you should consider a response plan.
The maximum decline is between 69K and 73K, but a potential uptrend near 78595.86 is also possible, so you should consider a response plan for this.
-
During an uptrend, you should monitor whether the price can sustain itself by breaking above the M-Signal indicator on the 1W chart.
If the upward breakout is successful, the key will be whether it can break above the 108353-11010569 range.
-
A lot of money has flowed into the coin market, but recently, it has been flowing out.
If this flow of funds changes, the coin market could experience another bull market.
For the coin market to experience a bull market, I believe both BTC and USDT dominance must decline.
USDT dominance must fall below 4.915 and either remain stable or show a downward trend.
BTC dominance must fall below 55.01 and either remain stable or show a downward trend.
If not, I believe it will be difficult for all coins (tokens) to experience a bull market.
2026 is likely to be the year of a major bear market, so it's a good idea to closely monitor capital movements.
USDT and USDC are showing gapping declines as a precursor to a bear market.
-
Thank you for reading to the end.
I wish you successful trading.
--------------------------------------------------
- Here's an explanation of the big picture.
(3-year bull market, 1-year bear market pattern)
I will provide more detailed information when the bear market begins.
------------------------------------------------------
Trading Methods to Increase Your Coin (Token) Holdings
Hello, fellow traders!
Follow us to get the latest information quickly.
Have a great day!
-------------------------------------
Increasing your coin (token) holdings by retaining coins (tokens) that represent profits is a useful method in investment markets where decimals are traded.
To use this method, familiarity with day trading is advantageous.
Familiarity with futures trading will also make it easier to understand the principles.
-
The trading principle is simple.
1. If a profit is generated based on the purchase price, sell the original purchase amount to retain the coin (token) corresponding to the profit.
2. If a profit is generated based on the purchase price, sell the existing coin (token) before the price begins to decline, and then sell the amount at the appropriate price to increase the number of coins (tokens) you currently hold.
-
(ETHUSDT 1D chart)
The basic trading method is to buy in the DOM(-60) ~ HA-Low range and sell in the HA-High ~ DOM(60) range.
Using this basic trading method, you can increase the number of coins (tokens) corresponding to the profit.
However, since trading based on 1D chart movements is difficult, it is recommended to trade on a lower timeframe chart (e.g., 15m, 30m).
-
(15m chart)
You can trade using the basic trading method on the 15m chart.
However, sell when the HA-High ~ DOM(60) range declines, and buy when the DOM(-60) and HA-Low indicators meet to increase your coin (token) holdings.
Therefore, understanding LONG and SHORT positions in futures trading is essential.
At first, it's best not to try to increase your coin (token) holdings drastically all at once.
This is because you may make unintended trades if you're not yet comfortable with trading.
-
When the price is rising, the StochRSI, TC, and OBV indicators will trend upward.
At this time, the StochRSI indicator should not enter the overbought zone.
The TC indicator should remain above 0.
The OBV indicator should remain above the High Line.
If this isn't the case, it's highly likely that the uptrend will be difficult to maintain, so caution is advised when trading.
-
Conversely, when the price is falling, the StochRSI, TC, and OBV indicators will show a downward trend.
In this case, the TC indicator should remain below 0.
The OBV indicator should remain below the Low Line.
The StochRSI indicator is only valid if the trend isn't upward.
-
When determining the timing of a trade, check the support levels of the indicators displayed in the price section, along with the movements of the auxiliary indicators during uptrends and downtrends.
In other words, the most important factor in trading is whether the indicators in the price section provide support near the horizontal line.
It's not a significant trading strategy if the profit increases by just 1 coin (token).
However, increasing the number of coins (tokens) representing profit through numerous transactions ultimately increases the number of coins (tokens) with a purchase principal of zero, reducing the burden of trading with existing investment funds.
Regardless of your investment amount, increasing the number of coins (tokens) representing profit is a method that can generate significant profits in the long term.
The basic trading method of buying and selling all of the profits to generate cash profits may be a better option.
However, since there's no guarantee of profit when starting a new transaction, the burden of new transactions is likely to increase.
However, increasing the number of coins (tokens) representing profit reduces this burden.
This is because trading is conducted through existing holdings (coins, tokens) rather than starting a new transaction.
-
There may be cases where you sell an existing coin (token) because you expect the price to fall, and then try to buy it back at a reasonable price, only to find that the price doesn't fall.
To reduce these risks, you should monitor the movements of auxiliary indicators on the 1D chart, such as StochRSI, TC, and OBV.
In other words, it's better to sell and then buy when the price is in a downward trend rather than when it's in an upward trend.
-
Thank you for reading.
I wish you successful trading.
--------------------------------------------------
Education 
Happy New Year!
Hello, traders!
If you "Follow" us, you'll always get the latest information quickly.
Have a great day.
-------------------------------------
(BTCUSDT 12M Chart)
The pattern of a 3-year uptrend and a 1-year downtrend appears to have undergone a slight change, with the 2025 bearish candlestick closing.
The key areas to consider are the 69K-73K range and the 42K-44K range.
Prices below the 42K-44K range are expected to be unseen again.
Therefore, as the price approaches these levels, it's a good time to buy from a long-term perspective.
If the price declines near the Fibonacci level of 1.618 (89050.0), it could touch the 69K-73K range.
However, just as it failed to reach the expected target level of 2.618 (133889.92), the decline could also fall short of the 69K-73K range.
Therefore, if the price declines from 1.618 (89050.0), we need to check for support near 1.414 (79902.66).
Considering the previous pattern of three-year upswings and one-year downswings, 2026 is expected to be a challenging year, so caution is advised when trading.
The Fibonacci ratios currently displayed on the chart are based on the second wave.
Therefore, the Fibonacci level 3.618 (178729.84), which appears to be the end of the second wave, is expected to be the target area for the next bullish trend.
-
(1M chart)
Since the HA-High indicator on the 1M chart formed at 110105.69, a decline is likely until it meets the DOM (-60) or HA-Low indicators.
Currently, the price is positioned near the StochRSI 50 indicator and the M-Signal indicator on the 1M chart, and the StochRSI 20 indicator is showing signs of forming a new line.
Therefore, support near the Fibonacci level 1.618 (89050.0) is crucial.
If the price declines, the DOM (-60) indicator and the HA-Low indicator are expected to form a low soon. Therefore, we need to check for support near the previously mentioned levels:
1st: Fibonacci 1.414 (79902.66),
2nd: 69K ~ 73499.86.
For the price to rise at a key point or range and continue the uptrend, the StochRSI, TC, and OBV indicators must show upward trends.
Currently, the StochRSI indicator is showing signs of entering an oversold zone,
the TC indicator is showing a downward trend below 0,
and the OBV indicator is showing a downward trend between the Low Line and High Line.
-
(1W Chart)
Since this is currently a volatile week, we need to monitor the movements below this week.
The next volatile week is expected to occur around the week of January 26th.
Therefore, the key is whether the price can rise along the uptrend line and remain above the M-Signal indicator on the 1M chart.
If it fails to do so and falls, a downward trend is expected, as mentioned earlier.
My basic trading strategy is to buy in the DOM(-60) ~ HA-Low range and sell in the HA-High ~ DOM(60) range.
Therefore, a decline in the HA-High ~ DOM(60) range can be considered a normal decline, and it is difficult to determine a buy point at this time.
Therefore, I recommend waiting until the DOM(-60) or HA-Low indicators are met.
-
(1D Chart)
The HA-Low indicator on the 1D chart is forming at 87944.84, so the key question is whether it can find support near this level and rise.
However, since the M-Signal indicator on the 1M chart is passing, it's crucial to see if the price can rise above it and maintain its upward momentum.
Including these factors, a rise in the 84739.74 ~ 93.5K range is highly likely to trigger an uptrend.
The next period of volatility is expected to be around January 10th, so we should monitor whether the price rises along the rising trendline (1) after this period.
We should also monitor whether the price can break above the rising trendline (2).
The TC indicator is above zero,
and the OBV indicator is rising above the High Line to see if it can be sustained.
The StochRSI indicator is falling in the overbought zone.
Therefore, I believe that for the uptrend to continue, the StochRSI, TC, and OBV indicators must show upward trends.
If the price finds support in the 84739.74 to 87944.84 range (DOM(-60) to HA-Low range on the 1D chart) and rises, and the StochRSI, TC, and OBV indicators show upward trends, the uptrend is expected to continue.
As mentioned in the 12M chart explanation, this year is expected to be a difficult year. Therefore, when trading spot, it's important to increase the number of coins (tokens) corresponding to profits. When trading futures, it's important to minimize losses by trading short positions. This will prevent you from missing opportunities due to insufficient funds when the trend turns upward.
It's best to increase the number of coins (tokens) representing profit during a stepwise downtrend.
This is because a stepwise downtrend usually ends in an uptrend.
A stepwise downtrend occurs when the price falls between DOM (-60) and HA-Low.
However, because it's difficult to predict the end of a downtrend, you must carefully distribute your purchase amounts.
Furthermore, when profit is generated by each purchase price, you should sell the amount equal to the purchase price, leaving the coins (tokens) representing profit.
This will quickly convert to profit when the price rises.
-
Thank you for reading to the end.
We wish you successful trading.
--------------------------------------------------
How to interpret charts and trade...
Hello, fellow traders!
If you "Follow" me, you'll always get the latest information quickly.
Have a great day.
-------------------------------------
The Trend Check (TC) indicator is a comprehensive evaluation of the PVT, OBV, and StochRSI indicators.
Therefore, a breakout above the zero level indicates strong buying pressure and a high probability of a price increase.
The StochRSI indicator is a coincident indicator that can be used as a trading signal by quickly detecting overbought and oversold levels in a stock price.
The OBV indicator is a volume indicator that measures buying and selling pressure by adding the trading volume on days when the price is rising and subtracting the trading volume on days when the price is falling. It was developed based on the assumption that trading volume precedes the price.
The PVT indicator is a technical analysis tool that analyzes buying and selling pressure and trends in the market by reflecting both stock price movements and trading volume. It combines accumulated trading volume with price volatility to sensitively reflect market supply and demand and trends.
By comprehensively evaluating these indicators, it can be used to determine trading timing.
However, since the trend may fluctuate depending on whether the StochRSI indicator is in the overbought or oversold zone, the StochRSI indicator has been displayed accordingly.
If the StochRSI indicator enters the overbought zone, upside is likely to be constrained, and if it enters the oversold zone, downside is likely to be constrained.
Therefore, it is recommended to check the StochRSI indicator's fluctuations along with the TC indicator.
If the On-Bottom Volume (OBV) indicator is between the Low Line and High Line, the price is likely to move sideways.
Furthermore, if it rises above the High Line, it is likely to be bullish, and if it falls below the Low Line, it is likely to be bearish.
To confirm this, the On-Bottom Volume (OBV) indicator has been added separately.
In summary, if the TC indicator shows an upward trend or remains above 0, the price is likely to rise.
However, the movements of the StochRSI and OBV indicators are checked to determine whether the upward trend can be maintained or whether a downtrend will occur.
Therefore, for the price to continue its upward trend,
1. the TC indicator must show an upward trend above 0,
2. the StochRSI indicator must show an upward trend without entering an overbought zone, and
3. the OBV indicator must remain above its High Line or show an upward trend.
For the price to continue its downward trend, this is the opposite of the above conditions for a sustained upward trend.
If the StochRSI or OBV indicators show a different trend than the TC indicator, the price is likely to move sideways, so be mindful of this when trading.
-
Since most indicators are based on 1D charts, it's important to first check the movements of the 1D chart.
Next, it's best to trade by reflecting the movements of the 1D chart with the movements of the timeframe chart you're trading.
In other words, if the 1D chart shows an upward trend, you should trade based on the expectation that the price will rise on the timeframe chart you're trading.
Therefore, when prices are falling, it's best to trade with a smaller investment amount and a shorter investment period to react quickly (with a short stop-loss point). When prices are rising, it's best to trade with a larger investment amount and a longer investment period (with a more generous stop-loss point).
-
Auxiliary indicators should be considered as supplementary indicators, as their name suggests, in interpreting charts.
The key is to identify support and resistance points or ranges for the price and the movements of the M-Signal indicator on the 1M, 1W, and 1D charts.
To determine the overall chart movement, check the movements of the M-Signal indicator on the 1M, 1W, and 1D charts.
For the price to continue its upward trend, it must remain above the M-Signal indicator on the 1M chart.
If it fails to do so, a downward trend is highly likely, so you should consider a strategy to counter a bearish market.
If the price is below the M-Signal indicator on the 1M chart, it is recommended to shorten the investment period.
Consequently, it is also recommended to set a shorter stop-loss point.
For this purpose, the HA-MS indicator includes indicators designed to indicate support and resistance points.
The most representative indicators are the HA-Low and HA-High indicators.
The HA-Low and HA-High indicators are designed for trading using the Heikin-Ashi chart.
The HA-Low indicator indicates the low range, so if it encounters support, it's a buy signal.
The HA-High indicator indicates the high range, so if it encounters resistance, it's a sell signal.
To make this more clear, the DOM(60) and DOM(-60) indicators have been added.
The DOM(-60) indicator, like the HA-Low indicator, indicates the low range.
The DOM(60) indicator, like the HA-High indicator, indicates the high range.
Therefore, if support is found within the established DOM(-60) ~ HA-Low or HA-Low ~ DOM(-60) range, it's a buy signal.
If resistance is found within the established HA-High ~ DOM(60) or DOM(60) ~ HA-High range, it's a sell signal.
-
When assessing support at these points or intervals, adding the interpretation of the auxiliary indicators mentioned above will be a significant aid in determining support.
In other words, if price movements indicate support, but the auxiliary indicators do not support it, the price is likely to decline.
-
If you trade based on indicator movements, you may suddenly find yourself trading against them.
This happens because you prejudge the indicators' movements based on your own thinking and then trade accordingly.
To prevent this problem, it's important to ensure that all auxiliary indicators are moving in the same direction.
Also, while you can buy to some extent in spot trading, you should never initiate a trade based on price movements when trading short positions in futures.
This is because price volatility is higher when prices are falling.
Therefore, when starting a short position, it's best to initiate the trade at support and resistance levels.
-
We begin trading based on indicator movements or chart analysis, but we lose something.
That's our trading strategy.
When actually trading, we must first determine:
1. How long will the trading period be?
2. How much capital will we invest?
3. How will we conduct the trade?
If we simply analyze the indicator movements and charts without deciding on these factors, we are likely to trade in a state of constant anxiety.
This is because maintaining a stable mental state is more important than profit when trading.
A stable mental state during a trade increases the likelihood of a successful trade.
This is because it allows us to respond more effectively.
Therefore, establishing a basic trading strategy that suits your investment style is paramount.
By considering the investment period for the stock or coin you're considering, you can determine your investment amount accordingly and choose a detailed trading method.
Therefore,
1. Investment Period
2. Investment Size
3. Trading Method
When conducting a trade, consider the three factors above.
When investing for a medium- to long-term or longer, it's important to carefully manage your purchases to lower your purchase price.
If your average purchase price is high, it can be psychologically burdensome to trade with a medium- to long-term investment horizon.
Therefore, in this case, you should trade for shorter periods of time, generating cash profits while lowering your average purchase price.
Lowering your average purchase price isn't easy in the stock market.
This is because trading is done on a weekly basis.
However, the coin market allows for decimal trading, so you can lower your average purchase price by increasing the number of coins corresponding to your profit.
For coins corresponding to profit, you trade by purchase price. When profits are generated for each purchase price, you sell the amount equivalent to the purchase price (including transaction fees) for each purchase price, thereby retaining the remaining coins.
Since the purchase price of these remaining coins is 0, as the number of these coins increases, the average purchase price will decrease.
-
Investment size is crucial, as it determines how you allocate your total investment capital to conduct your trading.
If your investment is misallocated, even with high returns, actual profits may be small, and even with low loss rates, actual losses may be large.
Furthermore, the most important aspect of investment size is always maintaining a reserve fund.
The amount of reserve fund you should keep will vary depending on your individual investment style.
I recommend approximately 20% of your total investment capital.
This reserve fund is used for emergencies. If you start trading with this reserve fund, you must sell it quickly to secure the reserve fund.
Failure to do so can lead to extreme anxiety and the inadvertent execution of unintended trades.
Depending on your investment size, you should consider how many stocks (coins) you will trade at a time.
Investing in too many stocks (coins) can lead to a small purchase amount or simultaneous trading, which can hinder your ability to execute your trades effectively.
Therefore, you should always consider the number of stocks (coins) you can manage simultaneously.
Typically, the number of stocks (coins) you can manage simultaneously is 1-3.
Long-term investments, even if managed concurrently, often require time to respond, so they don't need to be included in the number of concurrent investments.
However, it's recommended to include mid-term and shorter investments in your concurrent management count.
-
Once you've chosen a stock (coin) based on your investment horizon and investment size, you can then proceed to detailed trading based on chart analysis and indicator movements.
Therefore, it's best to keep chart analysis as short as possible.
This is because prolonged chart analysis increases the likelihood of your subjective opinions incorporating them into your analysis, which can result in inaccurate chart analysis.
Furthermore, prior to chart analysis, if you first review non-chart-related issues (such as company news, politics, or the economy) and then analyze the chart based on those, you may end up basing your analysis on your own subjective opinions. Therefore, it's important to be mindful of this.
It's important to remember that over-information can actually be detrimental to your trading.
-
When developing a detailed trading strategy, I outlined the basic trading strategy of buying in the DOM(-60) ~ HA-Low range and selling in the HA-High ~ DOM(60) range.
By adhering to this principle, even if you don't achieve significant returns, I believe you'll be able to ensure consistent profits.
Looking at the basic trading strategy broadly, it follows a trading pattern within a box range.
However, the length of that box range is unknown.
To achieve significant profits, it is necessary to break beyond the box range.
Therefore, if the price rises within the HA-High ~ DOM(60) range, a stepwise upward trend is likely, transitioning into a trend trade.
Conversely, if the price falls within the DOM(-60) ~ HA-Low range, a stepwise downward trend is likely, transitioning into a trend trade.
However, it's important to note that a stepwise upward trend ends in a decline, while a stepwise downward trend ends in a rise.
In other words, while a stepwise upward trend is likely to lead to a significant upward trend, it also means a significant downward trend.
Therefore, when entering a trade during a stepwise upward trend, it's important to respond quickly to minimize losses.
Failure to do so could result in a significant decline, resulting in losses that are difficult to recover from.
Conversely, a continuous step-down trend is more likely to lead to a significant decline, but it also carries the potential for a significant rise.
Therefore, we must consider how to implement tranche purchases during a step-down trend to lower the average purchase price or secure more stocks (coins).
Therefore, we should execute more trades during a step-down trend.
However, in the stock market, tranche purchases during an actual downtrend can lead to a loss of purchases, so caution is advised.
In the coin market, transactions are processed in decimals, reducing the burden of trading.
This means that trades can be organized by purchase price and executed at each purchase price.
Therefore, in a step-down trend, it's important to execute trades at each purchase price to retain a profit-making number of coins (tokens). This can lower the average purchase price or increase the number of coins (tokens).
There are two ways to retain a profit-making number of coins (tokens): buying and then selling, or selling and then selling.
Any method is fine, but if possible, it's best to trade using a buy-then-sell method.
This is because a cascading downtrend ends in an uptrend.
Therefore, in a cascading downtrend, you should trade less aggressively and execute more trades.
Downtrends are more likely to exhibit volatility than uptrends, so buying and then selling may actually feel easier.
However, you should avoid being greedy.
The root cause of all losses stems from greed.
-
If you can consistently generate profits, regardless of the trading method, then that's the best trading method.
We invest a lot of time and money in finding this, and remain in the investment market.
Charts ultimately represent the movement of money.
Therefore, charts should always be the top priority.
The main problem with the stock market is that issues outside of the charts dominate the market.
This problem prevents investors from seeing the movement of money, and they are constantly being misled by things outside of the charts.
As the coin market is being incorporated into the stock market, I believe that many people are dragging the main problems of the stock market into the coin market, leading to a rise in new losses.
The biggest difference between the stock and coin markets is that coins are relatively unusable in real life.
Therefore, I don't think analyzing them like the stock market is appropriate.
In the stock market, too, capital movements are often reflected in charts, so it's best not to check news outside of the charts first.
Such news can be toxic to individual investors who lack the ability to gather and analyze information.
-
Thank you for reading.
I wish you successful trading.
--------------------------------------------------
Education 
Next Volatility Period: Around January 10, 2026
Hello, fellow traders!
Follow us to get the latest updates quickly.
Have a great day!
-------------------------------------
#BTCUSDT
This volatility period will end on December 29th.
The key question is whether the price can maintain support near 87944.84 and rise above the M-Signal indicator on the 1M chart.
Therefore, we should examine whether the price can rise above and find support near 90588.23.
If the price does not fall below the rising trend line (1), an uptrend is expected.
To determine this, we should examine how the price moves after the next period of volatility, around January 10th.
-
Based on the current price position, the rising trend line (1) is a key trend line.
If the price moves along the rising trend line (1), it will rise above the 87944.84 level around January 20th.
Therefore, our focus is on whether the price can find support near 90588.23.
If the M-Signal indicator on the 1W chart breaks above, we believe a sharp rise is highly likely.
-
If the price falls below the uptrend line (1), it should check for support around 79K-81K.
If it fails to find support, it could fall to the crucial 69,000-73,499.86 level.
If it falls below 69,000-73,499.86, it's likely to take a long time to rise.
It could gradually approach the 42K-43K level, a level it will likely never touch again.
However, there's a possibility of an upward turnaround around 56,204.13.
-
The 56K-65K range corresponds to the peak of the first wave, which began a sharp upward trend.
Therefore, even if it declines this time, it is likely to rise around the 56K-65K range.
For a description of the big picture, please refer to the section below.
However, due to price fluctuations, I believe a major bear market is likely to begin in the first quarter of 2026.
It would be interesting to see if this year's candlesticks can close as bullish candles to create a three-year bull market and one-year bear market pattern.
-
Thank you for reading to the end.
I wish you successful trading.
--------------------------------------------------
- This is a description of the big picture.
(3-year bull market, 1-year bear market pattern)
I will explain in more detail when the bear market begins.
------------------------------------------------------