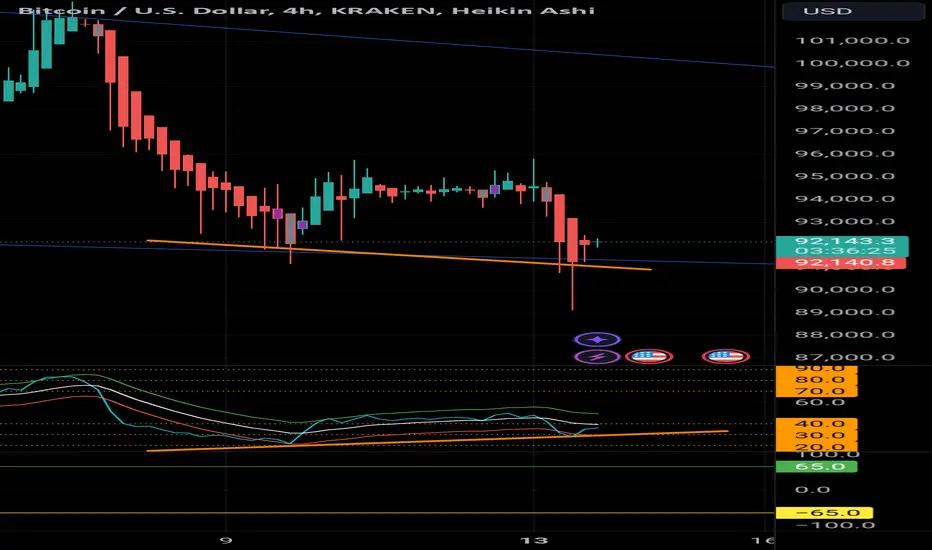
BTC | W-BOTTOM Pattern Continuation - UPDATEA quick continuation on yesterday's BTC update, with regards to the bullish W bottom pattern that likely takes us into the new ATH.
There are a few conditions that need to be met in order to "secure" the W pattern, but we're currently not seeing these conditions met. The good news, is that it's beginning to look more like a cup an handle pattern, also a bullish pattern.
This daily lose and especially the weekly close is going to be a KEY candle close to watch.
___________________
BINANCE:BT
Bullish Divergence
Bullish divergence and False Break on JKHY on DailyStrong upwick bar, bouncing with fb from 170 support, bullish div on many indicators, expecting rise up to 1 ATR
TP 177,49
E 172,37
SL 169,07
Good bullish div, one remark: 4H TF is still in downtrend, 13EFI is still not showing much strength.
Also, the impuls on weekly is still red, but Factor 3 is blue , so I'm okay with that, also because the movements are close to the flat EMA's on the weekly.
Furthermore, the bullish div is showing a false break.
Trade #00011
Results so far:
6 fro
Mastering the Bullish Engulfing PatternHello, Traders! 👋
Finding powerful reversal signals in a downtrend can be challenging, but what if a pattern was so visually striking that it's almost impossible to miss? Enter the bullish engulfing pattern – one of technical analysis's most reliable reversal signals. Today, we'll explore everything you need to know about the bullish, engulfing candlestick pattern and how to trade it effectively.
What Is a Bullish Engulfing Candle? 🔍
The bullish, engulfing candlestick tells a compelling st
2250: LONG AFTER HAMMER CANDLE FORMATION2250: SAUDI INDUSTRIAL INVESTMENT
has historically appreciated, on a weekly timeframe, once a hammer candle had been formed at an 'area of interest' or below it
The 'area of interest' is the price range of 18.10 - 18.30. There are 2 cases of hammer candle formation: 1) at the area of interest 2) below the area of interest. Both cases are marked in the chart.
Case 1: Hammer candle formed at area of interest
Enter a long position with TP: 25% (min) ; SL: below hammer candle's lower wick
Case 2:
SWING IDEA - DEEPAK NITRITE LTDDeepak Nitrite , a leading chemical company known for its diverse product portfolio, is showing a promising setup for swing trading.
Reasons are listed below :
2500 Support Zone : The price is resting on a well-tested support level around 2500, adding to the reliability of a potential bounce.
Hammer Candle on Weekly Timeframe : The appearance of a hammer candle suggests a reversal could be on the horizon as buyers regain control.
Golden Fibonacci Support : The current price aligns with a k
SWING IDEA - JIO FINANCIAL SERVICESJio Financial Services , an emerging force in the financial sector, exhibits signs of a potential upward move, presenting a swing trading opportunity.
Reasons are listed below :
Strong Support Zone at 300 : This level has proven to be a strong support, enhancing the likelihood of a bounce.
Bullish Hammer on Weekly Timeframe : A bullish hammer candlestick pattern indicates potential reversal and buyer interest at lower levels.
0.5 Fibonacci Support : The price is aligned with the 0.5 Fibona
NQ Power Range Report with FIB Ext - 1/15/2025 SessionCME_MINI:NQH2025
- PR High: 20977.00
- PR Low: 20938.50
- NZ Spread: 86.0
Key scheduled economic events:
08:30 | CPI (Core|YoY|MoM)
10:30 | Crude Oil Inventories
Previous session printed volatile swings raising emotional value of participants
- Holding auction inside 21000 range
- Daily print advertising to indecision narrative
- Another AMP temp margin increase for expected economic news event vol spike
Session Open Stats (As of 12:35 AM 1/15)
- Weekend Gap: N/A
- Gap 10/30/23 +0.47%
-
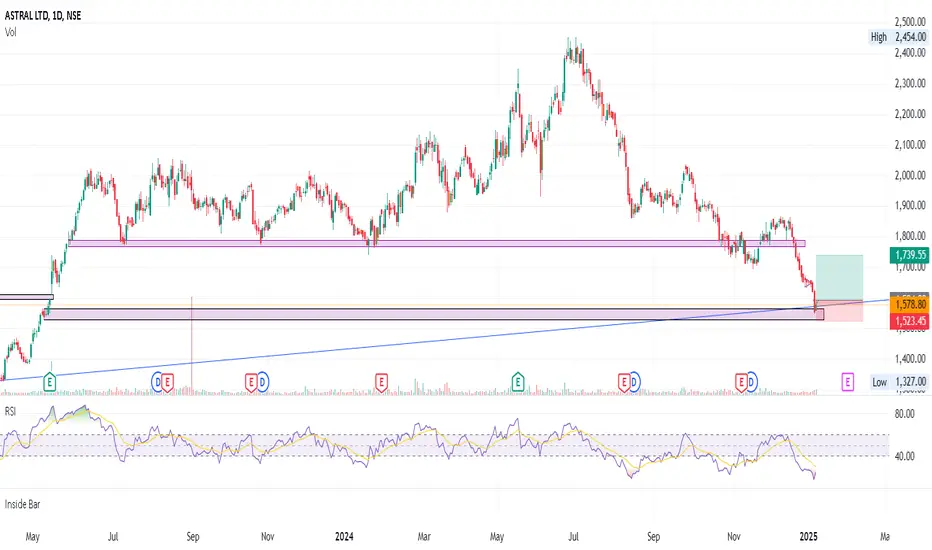
ASTRAL swing reversal stock is forming inside bar candle stick pattern at the support & the RSI is below 30
likely good R:R
For a successful entry, we should ideally see a strong 1day candle on our chart—it’s crucial to use that timeframe.
Following the breakout candle of inside bar, the ideal entry point would be after a consecutive candle that breaks above the previous candle
As always, remember to do your own research before making any investment decisions!
How to easily place pending orders in GOLD #XAUUSDThis is an easy way to determine where to place a buy or sell order. Place the buy or sell order in the boxed area created by the signal, as in the example. For SL TP, it can be in a 1:1 ratio or placed at the previous strong Support and Resistance. Always pay attention to the LOT placed. Adjust to the capital and do not place too many positions during the transaction. Be disciplined and stay relaxed when trading. God Bless.
FOREXCOM:XAUUSD
Strategy 2025. BTC Airless Scenario Below $100'000 Choking PointThe crypto market is flashing a worrying outlook for 2025, since a disappointing Santa Claus rally this year could deepen issues.
This is especially important if BTC will not be able to finish the year 2024 firmly above $100'000 per coin.
The financial market has had a tough week, but it might also be in store for a tough year in 2025.
The market is on track for its worst weeks over years after the Federal Reserve gave a hawkish forecast for interest rate cuts in 2025. But looking at the mark
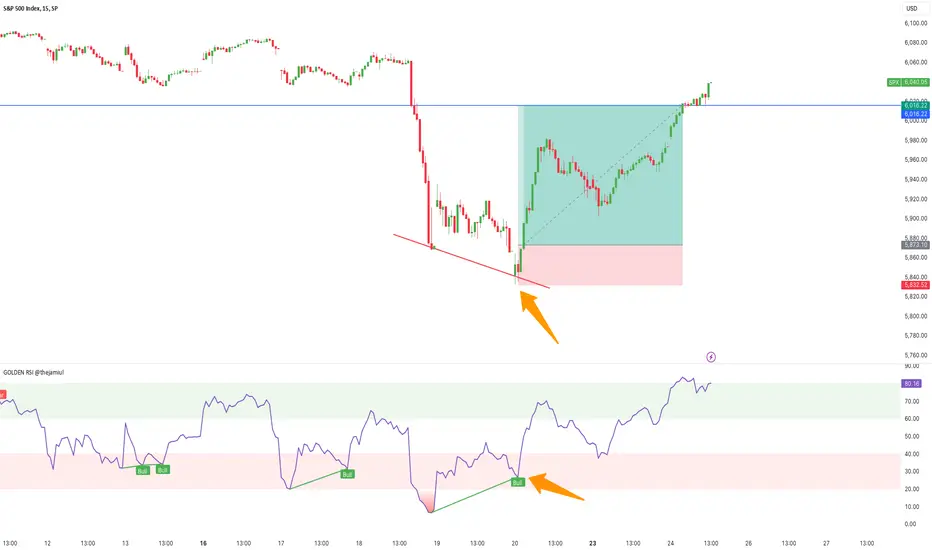
Reversal Trading Strategy Using GOLDEN RSI Divergence Indicator Overview
Reversal trading strategies capitalize on identifying turning points in the market where a potential reversal from a downtrend to an uptrend, or vice versa, occurs. In this post, I will introduce a strategy based on divergence patterns spotted with a custom RSI (Relative Strength Index) indicator.
This method enhances traditional RSI analysis by making divergence detection clearer and actionable. By combining it with a strong understanding of price action, traders can gain an edge in
AES Corporation - Short term view with strong supportSo first of all both price and indicators are confirming the downtrend.
Today NYSE:AES opened with a gap succeeding yesterday's equilibrium in price with doji candles.
The price is still in the middle of the regression line and in the next few days the price don't seems to be close to upper 2 SD.
In the print above the yellow line shows the support at $11.43. The image's time horizon starts at the end of 2006.
Furthermore looking at short ratio available online the value is about 2,7 from
4 TRADE LEVELS XAUUSD - PRECISE PRICE LEVEL THEORY After a successful sell in our community at 2719-2726 , today we are presented with a tough perspective due to the fact that now the current market price is entangled between the Supply and Demand Levels of H4 & Daily indicating a market cool off scenario entering a passive sideways.
So best strategy for today is to let the eruption of the market happen first and attempt on a reversal trade rather than seeking for a continuation trend trade.
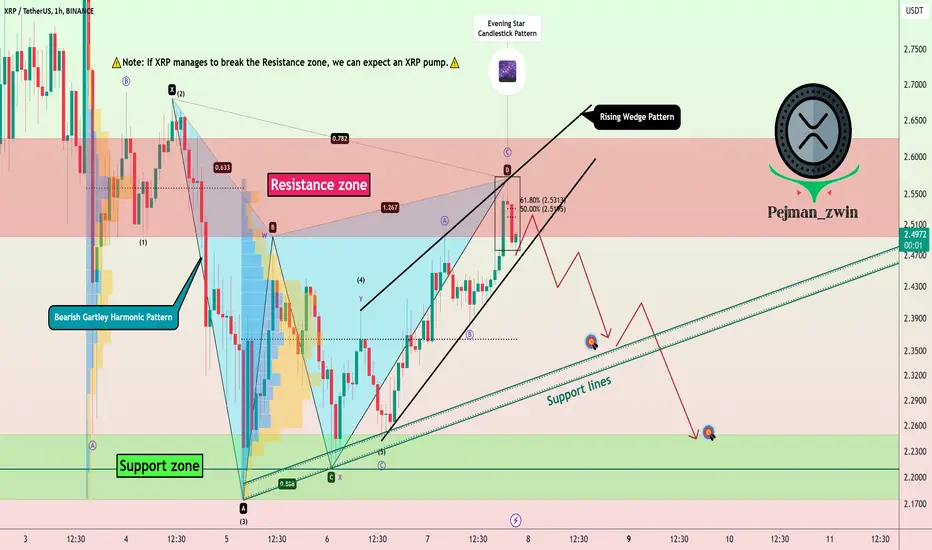
XRP Analysis==>>Correction Signs!!!XRP ( BINANCE:XRPUSDT ) is moving in the Resistance zone($2.63-$2.50) .
In this post, I want to show you some signs that XRP may still need to be corrected in a one-hour time frame :
1 -Regarding Classical Technical Analysis , XRP seems to have succeeded in forming the Rising Wedge Pattern .
2 -The formation of the Evening Star Candlestick Pattern in the Resistance zone can signify the reverse of XRP .
3 -The formation of the Bearish Gartley Harmonic Pattern can also be a
Short term trading : Be carreful of this candlestick config !!!You can acknowledge with me the absolutely astonishing XRP perf but when it's too nice to be true, a pull back does occur at some point. Please consider this not as a financial advice but educational content
Take care _
Do sport _
Take profit _
Bullish on PEPEPEPE is experiencing a price correction following a significant pump on November 13th. I've identified a bullish wedge pattern that has formed since that date, and PEPE appears to be following this wedge with the potential for a break toward resistance. Despite the recent price decline over the last few days, the On-Balance-Volume (OBV) indicator shows bullish divergence, suggesting upward momentum may be on the horizon.
From a fundamental perspective, I believe PEPE spiked on November 13th, pr