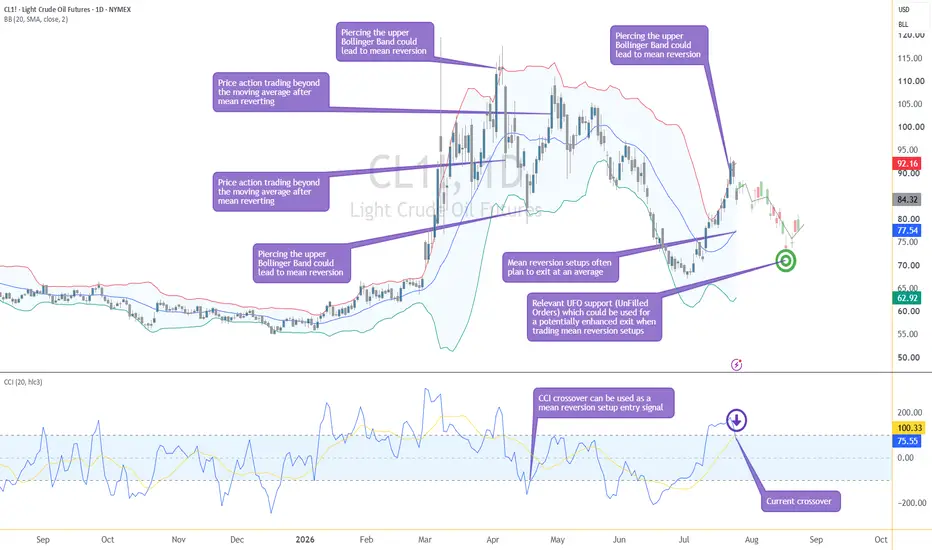
Why the Best Mean Reversion Exit May Not Be the MeanMean reversion has fascinated traders for decades because it is built on a simple observation: markets rarely move in straight lines forever. Periods of unusually strong buying or selling are often followed by a move back toward a more balanced price level. That concept has inspired countless trading strategies across futures, equities, currencies, and commodities.
Among the many tools used to identify these statistical extremes, Bollinger Bands® remain one of the most recognized. They expand a
Commodity Channel Index (CCI)
(UPD) NNE: Are the bears ready for a short squeeze? NASDAQ:NNE
Greetings, colleagues! I‘m updating the technical picture for NANO Nuclear Energy Inc. on the weekly timeframe as a follow-up to my previous publication.
An extremely interesting entry setup is developing: after a prolonged decline from the all-time high of $60.87, price is trapped inside a descending wedge and is approaching its apex, which historically precedes a powerful impulsive breakout.
The current drop has brought us into the key medium-term support zone of $15.00–$15.60
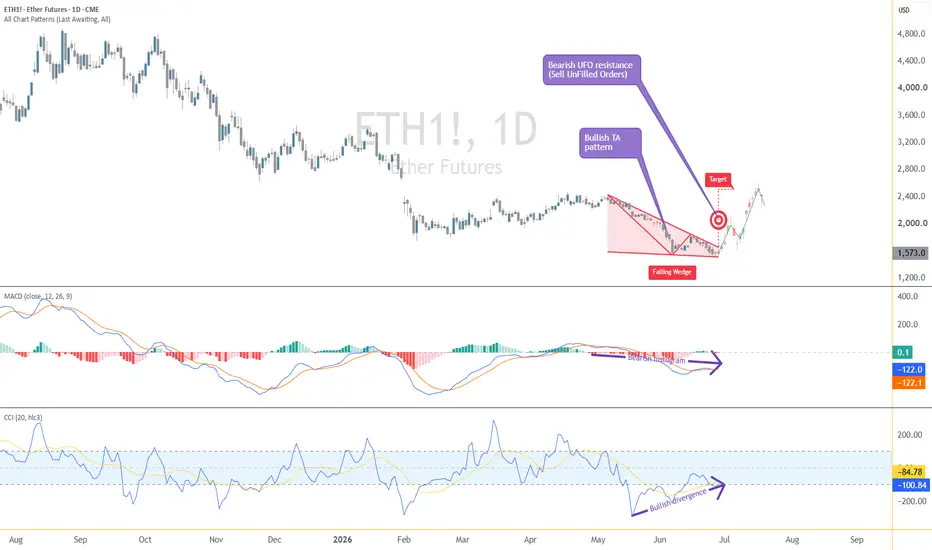
Turning Conflicting Signals into Structured DecisionsOne of the biggest misconceptions in trading is the belief that every good opportunity should look obvious. Many traders wait for every indicator, every chart pattern, and every momentum signal to point in the same direction before considering a position. While this sounds logical, markets rarely offer such perfect alignment.
Instead, they often present conflicting information. A chart may display a bullish pattern while momentum remains weak. A trend may appear constructive while resistance si
Double Top/Head & Shoulders Forming (Expect -16% Statistically)A head and shoulders (H&S) occurs when the price peaks on three separate occasions, with two peaks forming the “shoulders” and the central peak forming the head.
The head-and-shoulders pattern is considered one of the most reliable bearish reversal signals in technical analysis. According to the Encyclopedia of Chart Patterns and confirmed by my own research, this formation indicates an 81% chance of a downside move and an average price decline of about 16%.
Additionally, there are notable
JOBY: when the market doubts - smart money positionsJoby Aviation is currently at a point where fundamentals are moving ahead of price. While the market is still focused on losses, the company is already transitioning into real operations. A recent flight over San Francisco wasn’t a test — it was proof of execution in one of the most complex urban environments in the U.S. At the same time, participation in the eIPP program opens the path to early commercial operations across 10 states in 2026.This is no longer R&D - this is pre-revenue infrastru
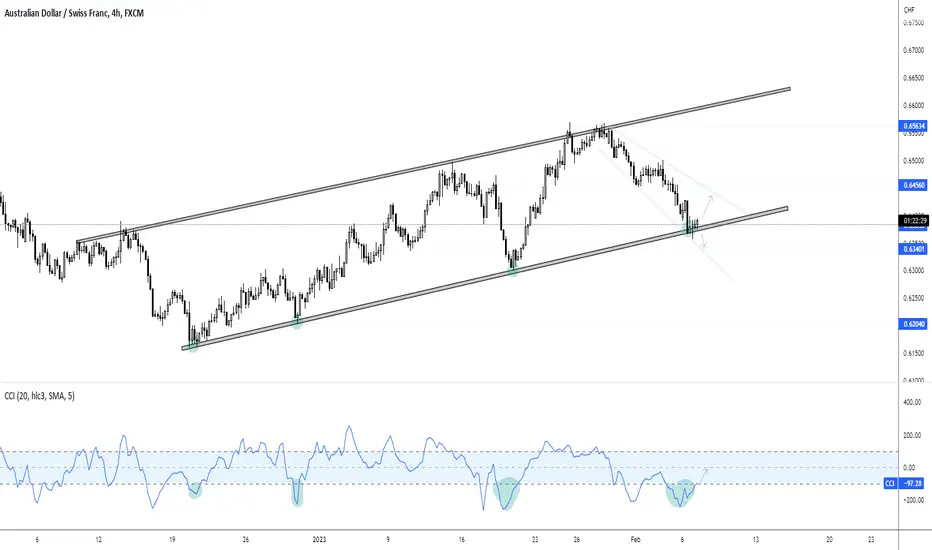
When Oversold Meets Support: A Timeless Market StrategyWhen Markets Stretch Too Far
Financial markets rarely move in straight lines. Instead, price tends to oscillate between phases of expansion and exhaustion as buyers and sellers continuously compete for control. During periods of strong directional momentum, price can move rapidly away from equilibrium, creating conditions where the market may become temporarily stretched.
Technical indicators are often used to measure these moments of imbalance. One widely used momentum indicator is the Commo
AAPL CCI system read: daily scaleBulls keep winning in the CCI system challenges. I am focusing on the upper 260s-low 270s area for entry. Target into mid-upper 300s currently.
Will play it with out of money calls due to the structure I need to maintain to stay inside my trading discipline. I use a 5% stop but the stop area (250 zone) does not fit that profile so I'll use out of money calls here with the potential downside being 5% of the lot size value I'd use if I bought the stock. That said, if the anticipated pullba
PLTR: looking for 110Review of current state of PLTR within the structure of the CCI system. I'm not much of a shorter of high flying securities so this effort will be to track for another entry point to get long. Currently looking at 110 area with a key date (CCI trendline cross) of Feb 19 in the near term.
Crown Castle Inc. (CCI) 1WTechnical Analysis
- The weekly chart of Crown Castle Inc. (CCI) shows a potential reversal after a prolonged downtrend.
- A breakout above the descending trendline and consolidation above $110.85 (0.786 Fibonacci) could signal the start of an upward movement.
- Key Resistance Levels: $132.06 – $146.95 – $161.85 – $180.28 – $210.07.
- Key Support Zone: $83.83 - $90.
- CCI and RSI indicators confirm improving sentiment.
A sustained breakout above $110-112 could lead to mid-term growth.
Fund
Leap Ahead with a Bearish Divergence on Gold FuturesThe Leap Trading Competition: A Chance to Trade Gold Futures
TradingView’s "The Leap" Trading Competition is an opportunity for traders to test their futures trading skills. Participants can trade select CME Group futures contracts, including Gold Futures (GC) and Micro Gold Futures (MGC).
Register and participate here: TradingView Competition Registration .
This article presents a structured short trade setup based on a bearish divergence identified using the Commodity Channel Index (CCI)
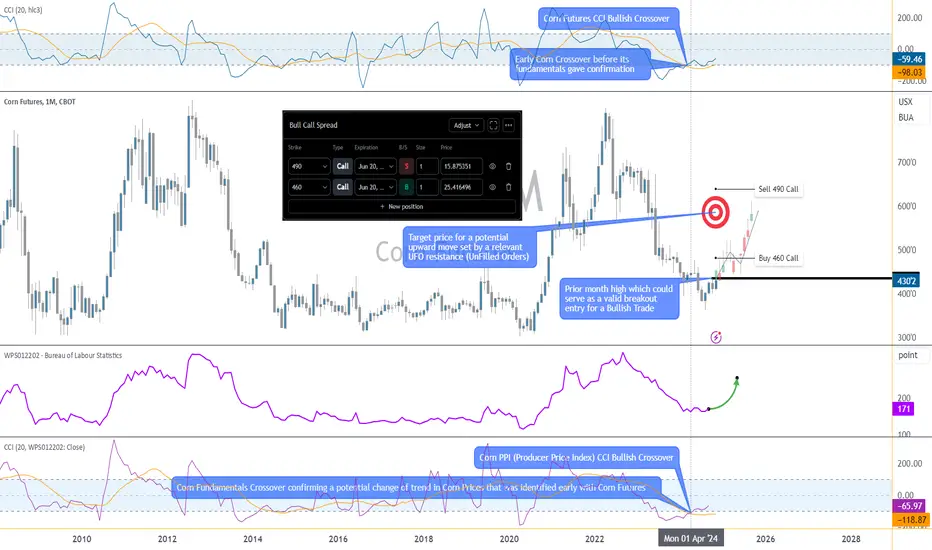
Options Blueprint Series [Basic]: Corn Futures and PPI InsightsIntroduction to Corn Futures Market Sentiment
Corn Futures are capturing the interest of traders as technical indicators and economic fundamentals align in a potential bullish setup. Currently, the Corn Producer Price Index (PPI) shows a Commodity Channel Index (CCI) bullish crossover, indicating a possible uptrend in prices. Corn Futures have followed suit with an earlier CCI bullish crossover, adding strength to the view that Corn prices could see upward momentum in the coming months.
As Co
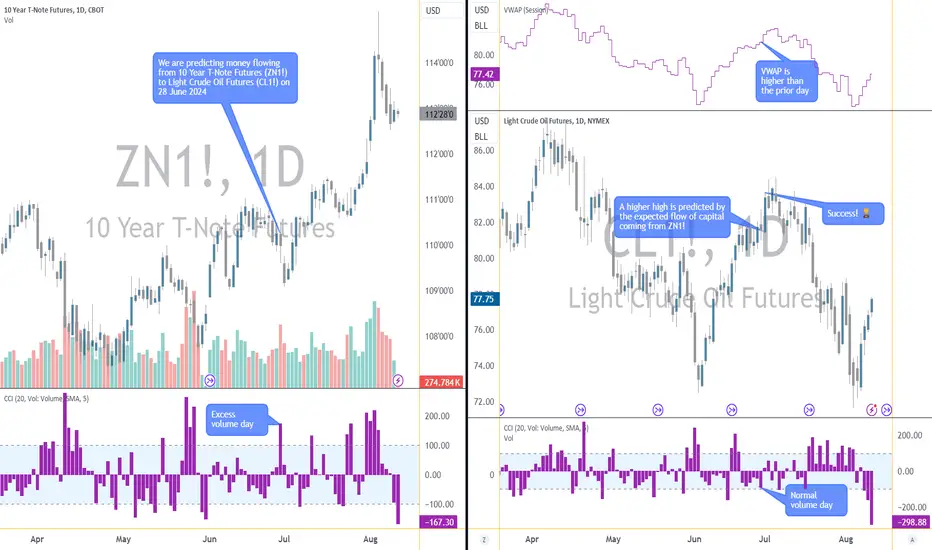
Decoding Money Flow within Markets to Anticipate Price DirectionI. Introduction
In the intricate world of financial markets, understanding the flow of capital between different assets is paramount for traders and investors aiming to anticipate price movements. Money doesn't move haphazardly; it often follows patterns and trends influenced by a myriad of factors, including economic indicators, geopolitical events, and inter-market relationships.
This article delves into the concept of money flow between markets, specifically analyzing how volume movements
Finding a section to start tradingHello, traders.
If you "Follow", you can always get new information quickly.
Please also click "Boost".
Have a nice day today.
-------------------------------------
The BW indicator included in the TS - BW indicator is an indicator expressed by synthesizing the MACD, StochRSI, CCI, PVT, and superTrend indicators.
When the BW indicator
- records a high point, it is time to sell, and
- When it records a low point, it is time to buy.
The BW indicator in the price candle section is the same
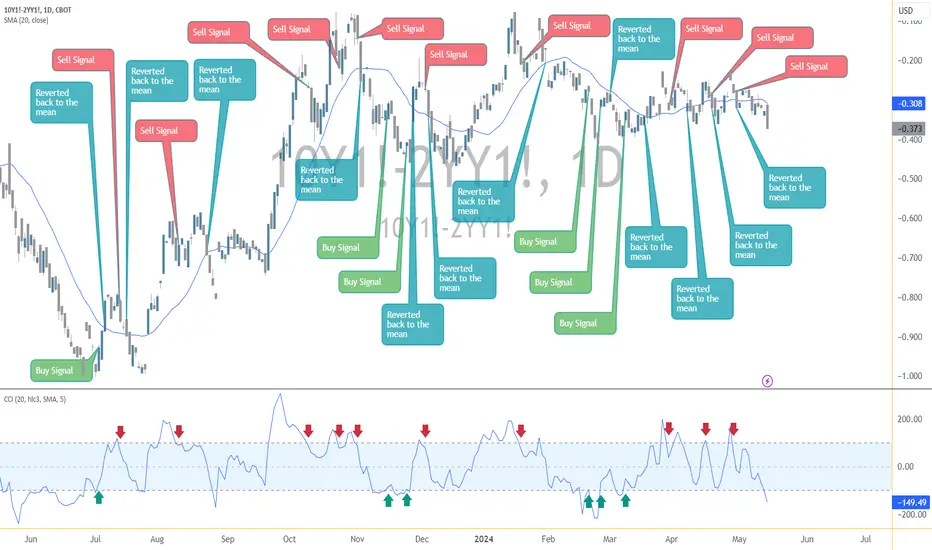
Navigating Interest Rates with Micro Yield Futures Pair TradingIntroduction to Yield Futures
In the complex world of financial markets, Treasury Yield Futures offer investors a pathway to be exposed to changes in U.S. treasury yields. Among these instruments, the Micro 10-Year and Micro 2-Year Yield Futures stand out due to their granularity and accessibility. These futures contracts reflect the market's expectations for the yields of U.S. Treasury securities with corresponding maturities.
Micro 10-Year Yield Futures allow traders to express views on the
Introducing another way to display volume profile sectionsHello traders!
If you "Follow" us, you can always get new information quickly.
Please also click “Boost”.
Have a good day.
-------------------------------------
The indicators activated in the settings are those created by trading volume.
Therefore, this indicator represents the volume profile section.
The indicator that the arrow points to is the indicator I mentioned earlier.
By looking at this indicator together with volume candles, you can more clearly identify the volume profile
UUUU entry - sub $6Energy Fuels (UUUU) is a Uranium and Vanadium mining company that is domestically sourced low carbon renewable energy fuel (U( and steel strengthener (V2O5).
* Improving earnings - nearing profitability
* Domestic contract growth
* By-product Vanadium is also in demand - steel recycling
* Energy market can not rely on oil and LNG alone
* MFI crossing 50% and consolidation and buying will increase scarcity
* CCI momentum hitting bottom
Entry this week after dropping below $6 with limit buys and
Key Interpretation Methods of CCI IndicatorsHello?
Traders, welcome.
If you "Follow", you can always get new information quickly.
Please also click "Boost".
Have a good day.
-------------------------------------
The CCI indicator, which is included in the 'Strength' indicator, now displays only the oversold or overbought zones.
Accordingly, it seems that there will be difficulties in understanding the indicators, so we took the time to give reinforcement explanations.
The CCI setting I use is 150.
Accordingly, it is utilized to see
Introducing the Trendicator (by Stock Justice)In this comprehensive tutorial, we dive deep into the world of the Trendicator, a powerful and innovative trading tool made by @StockJustice that enables traders to identify trends, spot reversals, detect bullish and bearish divergences, and perform multi-timeframe analysis. We delve into the inner workings of this never-before-seen indicator, demystifying its complex algorithms and showing you how to harness its full potential. From understanding the unique features of the Trendicator such as i
Bitcoin holds breakout and retakes 30KBitcoin is back above 30K in today's session extending yesterday's breakout.
Hard to look past Bitcoin today as buyers hit 30K, a price level not seen since June 2022. The move started yesterday as Bitcoin buyers broke above 28,600 resistance, and the move was held at the close, which is a great sign as it's the first set in confirming the move.
Today buyers jumped back into gear, breaking yesterday's high and moving back into the 30K Handel. In under two days, just over 7% of value has been
How to interpret charts from indicators (trading strategy)Hello?
Traders, welcome.
If you "Follow", you can always get new information quickly.
Please also click "Boost".
Have a good day.
-------------------------------------
Please understand that the 'Vol & Trend' and 'Strength' sub-indicators are a synthesis of existing indicators, and cannot be disclosed because they have been judged to be unsuitable for publishing as public scripts.
----------------------------------------
It is not easy to see and interpret all the indicators displayed on th