Unlocking The Power Of Correlation In Forex Trading.What Is Correlation In Forex Trading?
Understanding the role of correlation is of paramount importance in the world of forex trading as it offers valuable insights into the intricate relationships between currency pairs. By delving into the depths of correlations, traders gain the ability to make well-informed decisions and effectively manage their risk. This comprehensive article aims to delve into the concept of correlation within forex trading, shedding light on crucial aspects such as the
Correlation Coefficient (CC)
Understanding Forex Correlation 📈📉Hello Traders! 😃 In this education idea, we are going to cover Forex Correlation and how you can use this information to help you make wise decisions in the market. Let's get started on this important topic...
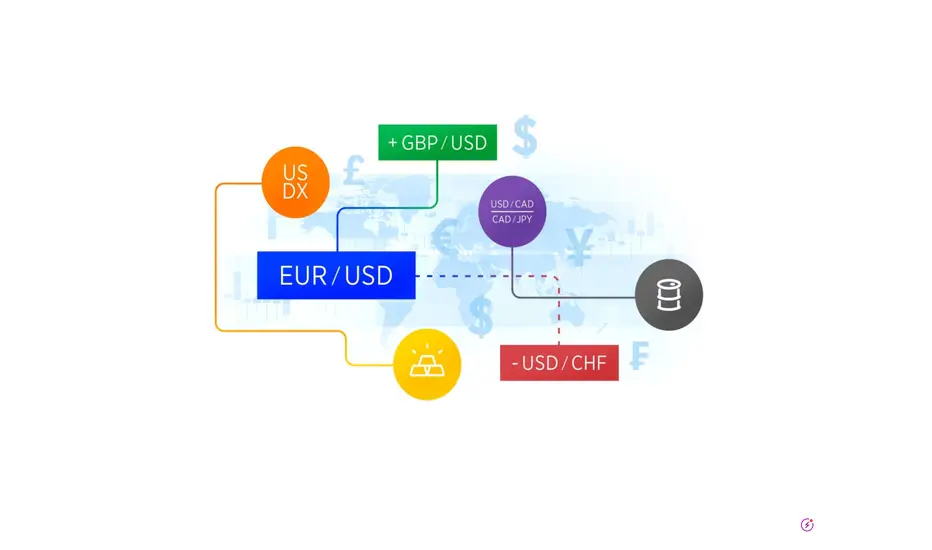
What is Currency Correlation?
A currency correlation in forex is a positive or negative relationship between two separate currency pairs. A positive correlation means that two currency pairs move in tandem, and a negative correlation means that they move in opposite directions. Correla
Forex Trading IdeologyIn Forex trading, understanding price movements is essential for success.
This article presenteds a conceptual ideology that metaphorically interprets price movements in Forex.
We explored range trading as breakfast and conversation, where traders analyze overbought and oversold levels on a RSI 4 for potential breakouts.
Trends were attributed to buyers and sellers, with uptrends indicating bullish sentiment and downtrends reflecting bearish sentiment.
Breakouts were seen as pivo
CORRELATION IN TRADINGHave you ever noticed a time when a certain product went up and another similar product went down at around the same time? Or when that product went down and another product also went down at the same time? If the answer is yes, then what you noticed was 'product correlation' in action.
What exactly is product correlation? In the financial markets, correlation is a statistical measure of how two products move in relation to each other. Product correlation tells us whether two products tend to m
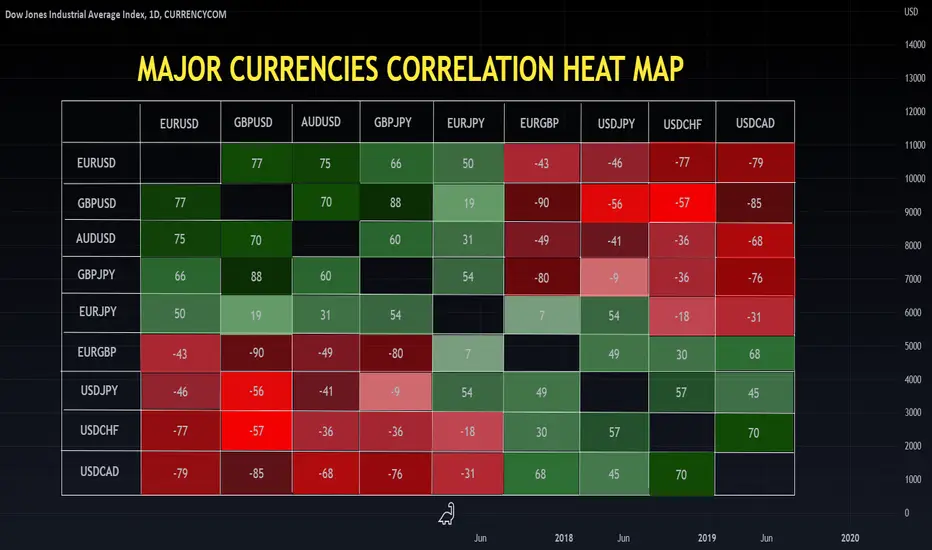
CURRENCY CORRELATION HEAT MAPCurrency correlation is important to understand in forex trading because it could impact your trading results often without you even knowing it.
In this post, I will share some information about correlations in forex trading and how you are able to use it to your advantage to avoid unnecessary losses. Throughout my journey as a beginner trader, I have bought or sold 2 different currency pairs many times without knowing they are negatively correlated just to let the gains be offset by
the other
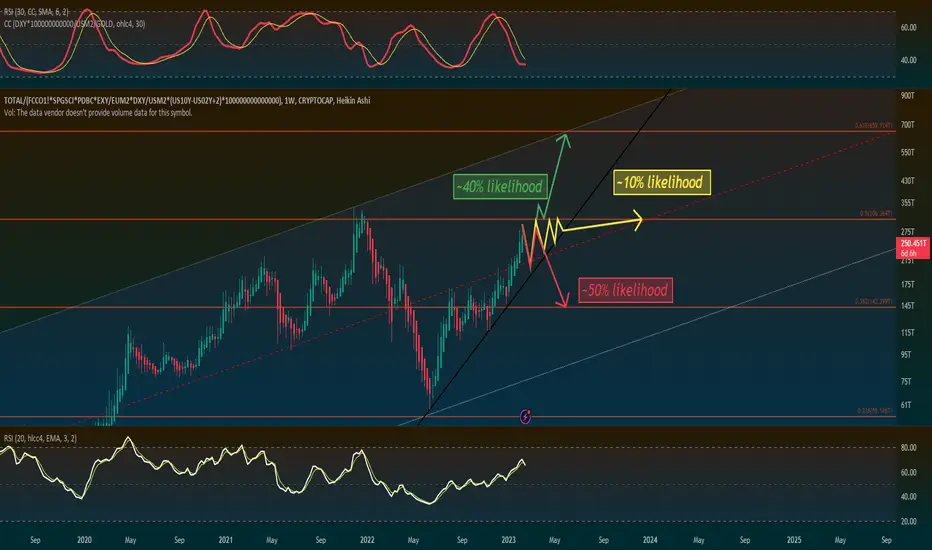
Clear Path for Crypto AssetsI've laid out the likely paths for the total crypto market. For each spread graph analysis, I recommend zooming out and potentially comprehending the flows of capital from crypto to other markets. The correlation coefficient (top pane) shows the correlation of dollar/gold with the intrinsic relative value of BTC. If you are unsure how these spread graph indicators are used, check out previous posts fully explaining their application.
Feel free to drop a comment with your questions or op
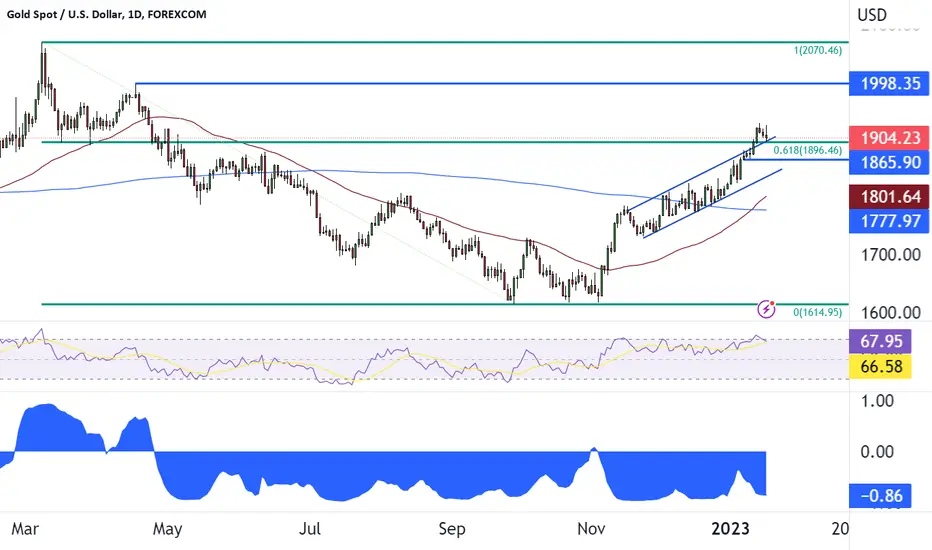
Gold could be setting up for a big moveGold has been moving steadily higher in an upward sloping channel since late November 2022, when price was near 1732. On January 12th, the yellow metal broke above the top trendline of the channel near 1890. The next day, XAU/USD broke above horizontal resistance and the 61.8% Fibonacci retracement level from the highs of March 8th, 2022 to the triple bottom lows (near 1617), at 1896.5. The top trendline of the channel, horizontal support (formerly resistance) and the 61.8% Fibonacci retraceme
BTC Analysis I'll cover fibonacci, volume range, general trend, macro correlation coefficient and MA analyses.
This spread graph pins BTC against safe heaven assets, which include: Commodities (SP:SPGSCI), the U.S dollar (DXY/M2SL) and U.S Bonds (1/(TVC:US03Y+TVC:US02Y+TVC:US05Y+TVC:US10Y+TVC:US30Y)+1). Given representation of BTC's price accounts for various allocations of investors' capital to evaluate it's true intrinsic value. This favors accurate measurements.
Fib Analysis
The significant
Gold could gather steam to the upsideThe selloff in USD/JPY has pulled the US Dollar Index lower with it. Could this be the year-end trade? Selling US Dollars? Notice in the bottom panel of the chart that the correlation coefficient between Gold and the US Dollar Index. The current reading is -0.92. Readings below -0.80 indicate a strong negative correlation between 2 assets. Therefore, if the strong correlation holds on the daily timeframe, when the DXY moves in one direction, Gold should move in the opposite direction.
If
BTC: What to Watch Going into US FOMC Presser This WeekThe US Federal Reserve Open Committee (FOMC) meets Tuesday and Wednesday this week. The hawkish monetary policy that has been fostered by the FOMC has put pressure on risk assets for much of this year. The Federal Reserve, along with other central banks around the globe, have been attempting to tackle sticky inflation that has been running at high levels not seen in decades. Though some argue that inflation may have peaked, it remains sticky and well above central banks' targets, which in the US
SECRETS the USDT.D chart can reveal - Crypto Bullish or Bearish?Hi Traders, Investors and Speculators 📈📉
Ev here. Been trading crypto since 2017 and later got into stocks. I have 3 board exams on financial markets and studied economics from a top tier university for a year. Daytime job - Math Teacher. 👩🏫
In today's video analysis, I share with you the SECRET of the USDT.D chart, that otherwise seems irrelevant in predicting the ENTIRE crypto market direction... right? Watch this video to find out what the USDT chart can reveal about the general trend of
FXI / Nasdaq Relative Strength & Correlation China's Large Cap ETF (FXI) is showing notable bullish Relative Strength (RS) compared to the Nasdaq (0.26 on the Daily RS, using a 50 period timeframe). The typical RS between these two fluctuates between -0.15 - 0.10. FXI also tends to have quite a strong correlation coefficient vs. NDX, but we're finally seeing that break down (0.24 on the Daily w/ a 50 length and trending down). Conservative swing traders want to see a breakout above ~$34 for longs, which would clear the downward sloping tre
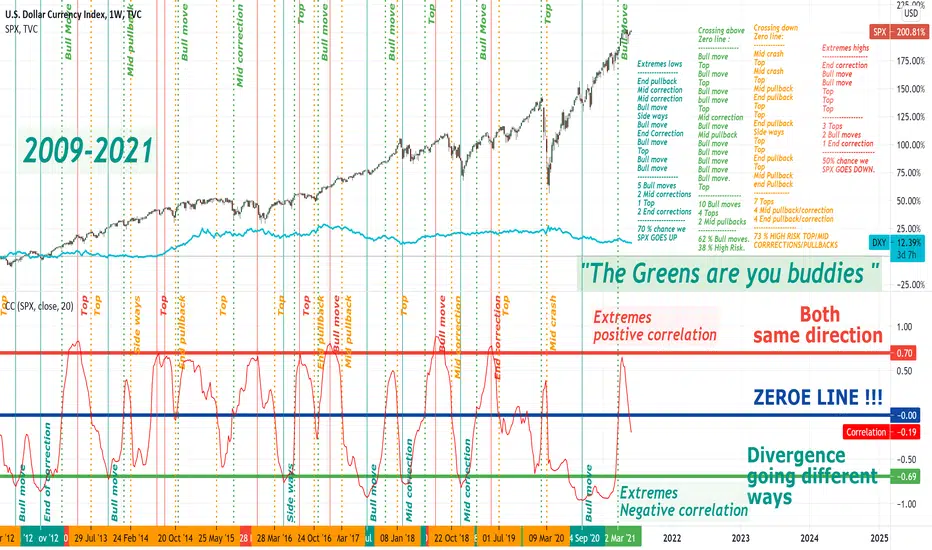
SPX & DXY " The 2 Beasts " Decoding the correlation coefficient.How U.S. Stock Prices Correlate to the Value of the U.S. Dollar 2009-2021
1/ Only about 35% to 40% of the stock indexes' movements are associated with the movement of the U.S. dollar.
2/ Scenario # 1. Your portfolio is made up of shares that rely heavily on imported raw materials, energy or commodities to make money. A substantial portion of the manufacturing sector of the U.S. economy depends on imported raw materials to create finished goods. If the purchasing power of the U.S. dollar decli
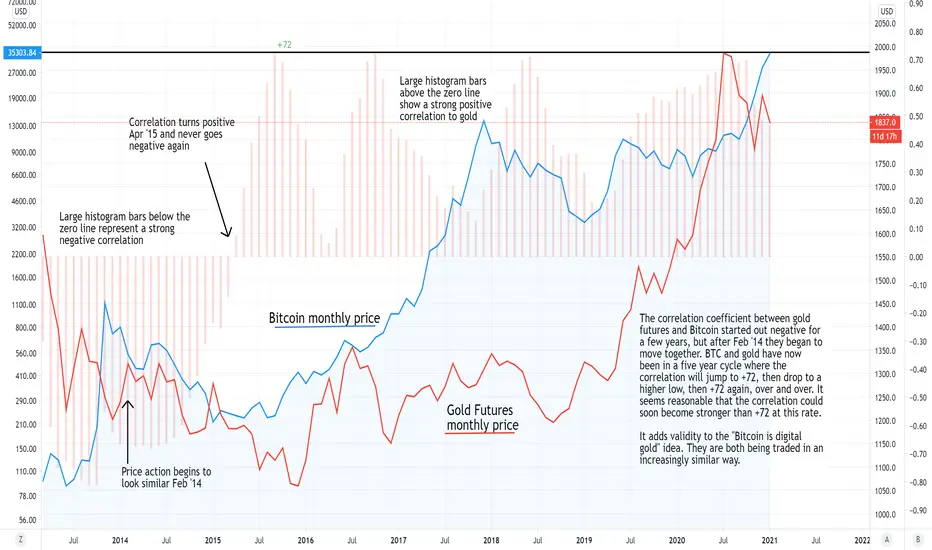
BTC: Digital gold trades like goldThe correlation coefficient between gold futures and Bitcoin started out negative for a few years, but after Feb '14 they began to move together. BTC and gold have now been in a five year cycle where the correlation will jump to +72, then drop to a higher low, then up to +72 again, over and over. It seems reasonable that the correlation could soon become stronger than +72 at this rate.
It adds validity to the "Bitcoin is digital gold" idea. They are both being traded in an increasingly similar
VIX DAILY USING BALIPOUR'S HVP AND CORRELATION COEFFICIENTAs you can see in the chart, the historical volatility percentile of the vix is crushed and when it expands with positive correlation (which is the bottom indicator), vix tends to go up. Who says volatility cant be used to trade direction. It absolutely can, thanks to balipour. no RSI no Stochastics needed here. TVC:VIX
BITCOIN and CORRELATION, alternative trading strategies (CC)What Is the Correlation Coefficient / CC ?
The correlation coefficient is a statistical measure of the strength of the relationship between the relative movements of two variables. The values range between -1.0 and 1.0. A calculated number greater than 1.0 or less than -1.0 means that there was an error in the correlation measurement. A correlation of -1.0 shows a perfect negative correlation, while a correlation of 1.0 shows a perfect positive correlation. A correlation of 0.0 shows no linear
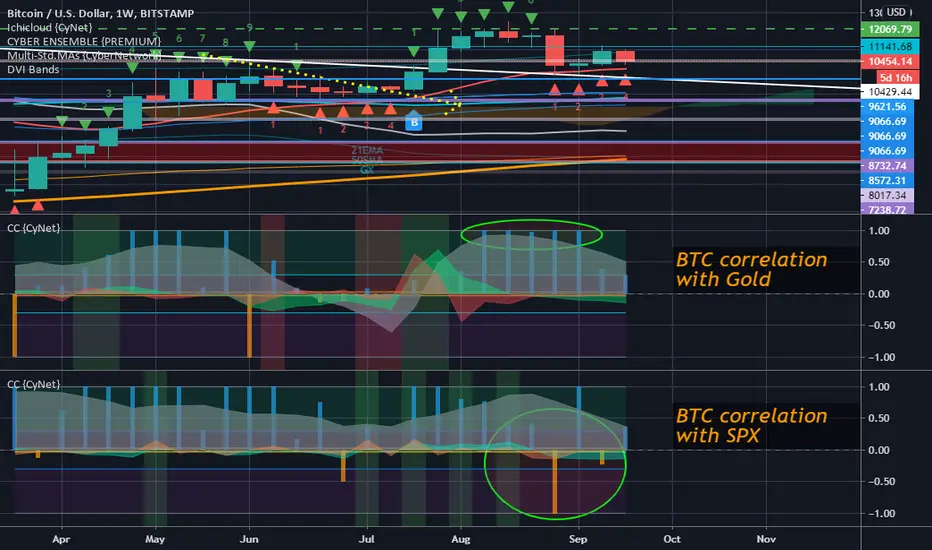
BTC been correlating with Gold more than SPX over past weeks!Just a quick thing to note.
Presently the treat of government shutdown in the US and the looming election is creating uncertainty in the market, leading to mass liquidation back into USD -- as irrational as that may be considering the present debasement of the USD (and of other currencies around the world, including the Yuan, and the Pound, etc).
See previous BTC analysis which considered the bearish case in an update just before the dump:
Key thing to note, as posted in an update of the a
Update on GoldNot much has changed, If you missed the last decent entries on the 50/61% levels of the Fibonacci, I would suggest to be patient and wait.The current positions are only good for scalping in my honest opinion.
As we know this formation can be broken either way, and its overdue for a decent pullback for OANDA:XAUUSD . We got as low as 1860s.
That was an extremely important entry position for those trying to get a long position. Following the fundamentals closely as we approach election time,
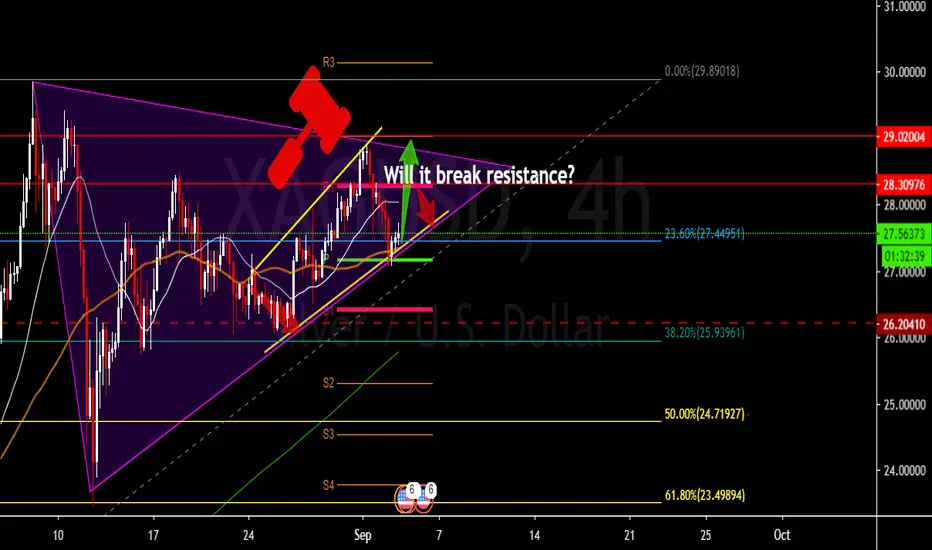
Update on Silver Will it break resistance? We are inside the the trendline channel (yellow line) we can see strong resistance and price rejection from previous attempts of breaking.
I won't be surprised if we break downwards again at this resistance marked with red line and Pivot Standard. Last decent entries here once again were at 50/61% levels of the Fibonacci at around 23-24.
My suggestion would be to wait for a better pullback position, as we are approaching elections and based on price correlation with
USDCHF Inverted Cup&Handle check my previous ideasHi friends hit the like/follow button to motivate me to continue. Check my previous ideas to keep up to date.
We went over USDJPY and EURUSD that have move similar, now USDCHF is the pair they’re opposite trend. Now this is not always 100% due to volatility and Fundamentals impact.
We can observe the inverted cup and handle was respected, also we can see how the trend was opposite from EURUSD and USDJPY.
We can expect further downtrend to support area. But before the handle in this case sinc
ETHUSD Update 50 pips profitHi friends, hit that like/follow to motivate me.
My confirmations: Successful triangle break, Fibonacci levels, support and resistance, pivot standards, and confluence zones.
With fundamentals driving crypto this week definitely pushed Ethereum to these highs.
But for how much longer? Lets watch and be ready for either scenario with confirmations.
Check my correlation coefficient study and follow along.