EURUSD: Grand Supercycle Perspective & Structural OutlookOverview:
Analyzing the EURUSD on a monthly timeframe requires a macro-structural approach. The key focus remains on the interpretation of the price action post-2008 (the cycle peak), whether it defines an Impulsive decline or a complex Corrective structure.
Scenario 1: The Aggressive View (Impulsive Count)
Structure: This count interprets the decline from the 2008 peak as an Impulsive move (5-wave structure).
Current Phase: The market has completed the first three sub-waves. We are currently
Economic Cycles
THE COMPLETE STORY OF BITCOIN CRASHESTo understand Bitcoin, you cannot only look at today’s price. You have to look at the entire story. This is not a nostalgia thread. This is a media psychology archive.
What did mainstream media write during every major Bitcoin crash?
What did people believe?
What did Bitcoin critics say?
What fear did the crowd surrender to?
And where did the courageous decision appear?
Because bottoms are not built only by price. Bottoms are built by fear. And nobody sells fear better than mainstream media.
EURUSD: Post-Liquidity Sweep Structural Alignment (PDL to EQ)The Macro Thesis: Context & Target
This execution model interfaces with a high-horizon liquidity cycle on the EURUSD 4-Hour and 1-Hour horizons. To ensure absolute objectivity, the campaign is broken down into verified structural phases rather than speculative bias.
1. Price expanded into a deep higher-timeframe matrix, sweeping past the Previous Daily Low (PDL) and piercing the 1D-Support floor
2. The Draw on Price (Target): Immediate structural targets are mapped to the 1H/4H Equilibrium vec
XAGUSD: Detailed Technical AnalysisScenario 1: Aggressive (Turquoise Count)
Core Hypothesis: The price action indicates the completion of Wave A as a Leading Diagonal. This implies that the subsequent market behavior should unfold as a corrective structure.
Current Stage: The analysis suggests that the market is presently engaged in the formation of Wave B, which represents the initial corrective leg following the diagonal impulse. This phase is characterized by its corrective nature, typically unfolding in a three-wave pattern
Textbook Diagonals: Converging Leading Diagonals or Extended StrTextbook Diagonals: Converging Leading Diagonals or Extended Structures?
In today’s technical breakdown of XAUUSD, we are observing textbook Diagonals that are dictating the current market structure. We are evaluating two critical paths:
The Aggressive Scenario (Cyan - Converging Leading Diagonal): This Leading Diagonal formation signals that the market has entered a corrective phase. We are treating this as the initiator of a Zigzag correction, which could manifest as either a simple or a com
BTC 1H: Two Windows of OpportunityThe chart shows one of the mirror patterns I use.
Currently, the model projects two windows of opportunity:
🟨 Window 1
June 9, 2026
7:48 AM – 10:12 PM
🟨 Window 2
June 10, 2026
12:00 PM – 9:00 PM (approx.)
As always, the time window alone does not indicate direction. The interesting thing is to observe how the price reacts if it reaches any of the pivot price levels during those time intervals.
Resistance/Upper Levels
• 68,000 – 67,400
• 67,000 – 66,300
• 64,400
• 63,100 – 62,900 ⭐️ (especia
Key Timings and levels for BTC (Short-term!)In addition to June hosting a notable concentration of cyclical activity, the cycle clusters suggest that this week may act as an important inflection point for the market.
Within the week, two dates stand out due to their elevated concentration of cycles and, therefore, their potential to create trading opportunities:
17/06/2026
20/06/2026
⏰ Key timing windows for June 17
05:00 UTC-4
13:00 UTC-4
17:00 UTC-4
These hours may coincide with changes in direction, momentum shifts, breakouts, or i
Sell Bitcoin and Altcoins during 2025 and don't look back!Hello Everyone,
This is my first public post since the last one, which I published on Sep 28, 2022, and you can see that here:
My cycle analysis (TA) proved spot-on the last time I accurately predicted Bitcoin’s behavior. To avoid overcomplicating things, I’ll keep this brief.
As the yearly chart indicates, we’ve seen a consistent pattern: a three-year bull market followed by a one-year bear market. History appears poised to repeat itself, and we’re now entering the final phase of the curren
BSBusdt Reclaims Strength After Successful Base FormationBSB appears to have completed a corrective decline into a strong base zone and is now showing signs of re-accumulation. The recent rebound from the lows suggests buyers are stepping back in, while the current structure points toward the beginning of a new impulsive advance. As long as price remains above the highlighted re-accumulation zone, the bullish outlook remains intact.
The projected wave structure indicates a potential five-wave expansion, with the first major objective targeting the su
SpaceX IPO: Why Chasing The First Rally Can Be DangerousSpaceX has finally gone public and, as expected, there is a lot of excitement around the stock. We are already seeing strong buying interest, with prices pushing higher shortly after the listing. This is quite normal. Most IPOs attract aggressive demand in the early stages as traders rush to gain exposure.
However, traders should be careful not to let FOMO drive decisions. Early investors who received shares before the public listing will eventually look to take profits, especially if the stock
XRP’S REAL MOVE HAS NOT STARTED.XRP’S REAL MOVE HAS NOT STARTED.
Everyone hates this chart. Good.
That is exactly why almost nobody will win if it finally breaks.
Most people are watching XRP/USD and arguing like tourists.
I am watching XRP/NVDA. The relative chart has been bleeding against one of the strongest assets on earth for years.
2018 CYCLE TOP
2021 rejection.
2025 rejection.
Still under the same macro line.
This is not just about XRP going up in dollars. That is the shallow read. real question is whether XRP is a
BTC. Walking around...a long-term key area of support/resistance levels around which to build an investment/trading position.. many, many, and if not everyone, are waiting for fifty thousand, but it's obvious, and if price reaches that level, you'll only need to buy and then wait to sel - Is it really that obvious to everyone?
and now, an unpopular opinion: the bottom is forming now, and $59,000 is the low point of the current bear market
US30: High-Probability SMT DivergenceAnalysis Explanation:
The correlation matrices between major indices reveal a phenomenal institutional accumulation footprint, setting up an explosive bullish continuation cycle.
Intermarket SMT Divergence Matrix: A massive Smart Money Technique (SMT) divergence has locked in between NASDAQ and US30. While NASDAQ forcefully swept through its historical cyclical lows, creating a deeper structural purge, US30 significantly failed to take out its corresponding lows. This critical divergence hig
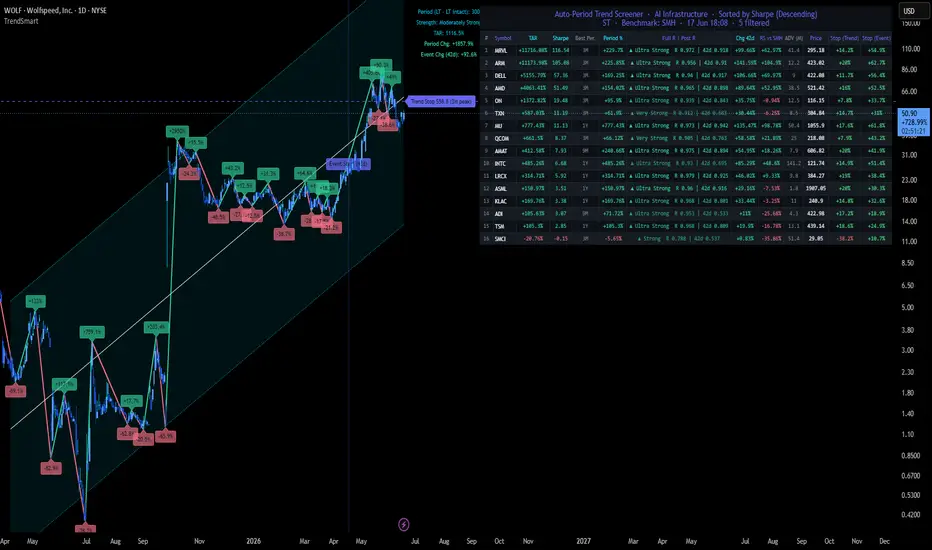
$WOLF — 1898% run, Trend Stop just broke at $58.80. NYSE:WOLF — 1898% run, Trend Stop just broke at $58.80.
Wolfspeed climbed from sub-$1 in mid-2025 to roughly $80 at peak this week.
The screener's auto-period engine selected 3 months as the cleanest TAR window for this name. Annualised return over that window: 1137%.
Last 42 trading days: +96.6%.
This week's pullback: –38.6% from peak to $51.76.
---
Two methodologies on the chart, two different reads:
- Regression channel — auto-fit across 19 candidate lookbacks. Price still inside the n
#NifyFinance - 2300 Points Move on Cards?Date: 07-05-2026
Nifty Finance is indicating 2300 points move from the current levels.
This looks like a last up move for a distribution before major correction below 2nd April 2026.
This move can be any direction so watch out for the levels marked on the chart.
#Tradingview
My thoughts on Bitcoins next move - Short in short term -> LongI ended up somehow getting the price for last cycles high correct-ish (within a box I drew). I was able to sell into it as well. I do think we have hit a high for the current 2025 cycle, unless they are expanding as one could expect. I do think we will hit a low of 80% from the top (around 38k). I do not think we will see a bounce from the current price action of 66k. This has more to do with historical cycles than anything.
I was able to accurately predict the 2017, and 2021 lows due to
OVERSOLD ! Bitcoin 2010-2026 THIS IS NOT WHERE BITCOIN TOPS.
Bitcoin cycle tops are built in comfort, leverage, euphoria, and everyone believing the story is obvious.
This chart shows the opposite: monthly RSI back in the same reset zone that marked previous bottoms fear, fatigue, and broken confidence before the market proves the crowd wrong again. Bitcoin cycle tops do not usually form when monthly RSI is sitting near the same reset zone that marked previous bottoms.
2011.
2015.
2018.
Covid.
2022.
Every major reset loo
UKOIL – The Market Is Approaching a Structural DecisionThe current structure in UKOIL suggests that the market is approaching the final stage of a larger corrective sequence. The dominant interpretation at the moment points to wave C unfolding as an Extended Flat, a structure that often ends with an aggressive terminal push before reversing direction.
Two scenarios are currently active.
Aggressive Scenario (Bull Market Confirmation)
In the aggressive interpretation, the decline we are observing represents the final impulsive leg of wave (5) withi
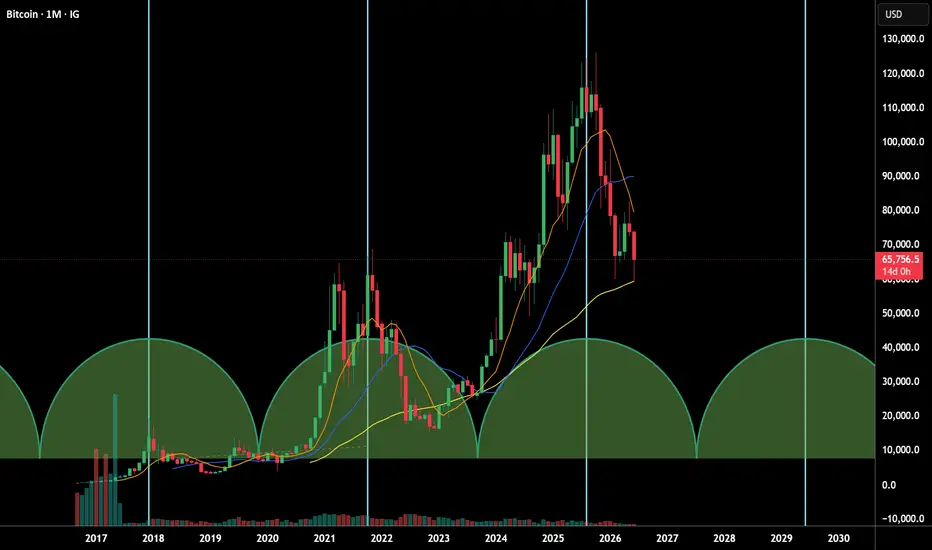
Bitcoin’s Four-Year Rhythm: A Long-Term ViewBitcoin’s price history seems to be very rhythmic. Almost organic cycles of boom and correction. The monthly chart above captures this phenomenon with striking clarity. By plotting equidistant vertical lines and overlaying time cycles, we can see that Bitcoin’s market behavior appears to follow a four-year cadence — a pattern that aligns closely with its halving events and broader macro sentiment shifts.
The Four-Year Cycle Pattern
Each green semicircle on the chart represents a full cycle,
Elliott Wave Scenarios into 2040 Strategic Analysis of UKOILUKOIL at a Structural Inflection Point: Elliott Wave Scenarios into 2040
Strategic Analysis of UKOIL (Brent Crude)
A Cyclical, Temporal, and Behavioral Wave Perspective
“The Wave Principle conforms to the realities of life.”
It is worth opening this analysis with Hamilton Bolton’s well-known observation. Bolton emphasized that Elliott Wave Theory is not merely a charting technique; rather, it reflects collective human behavior unfolding under real-world conditions. Whether during economic reces