UKOIL Bullish Breakout – Flag Pattern Targets $91.66**\
UKOIL has broken out of a falling channel after forming a bullish flag pattern, signaling a potential continuation of the uptrend. The breakout is supported by strong bullish momentum, and price is now consolidating above the breakout zone around **84.35**.
As long as price holds above the recen
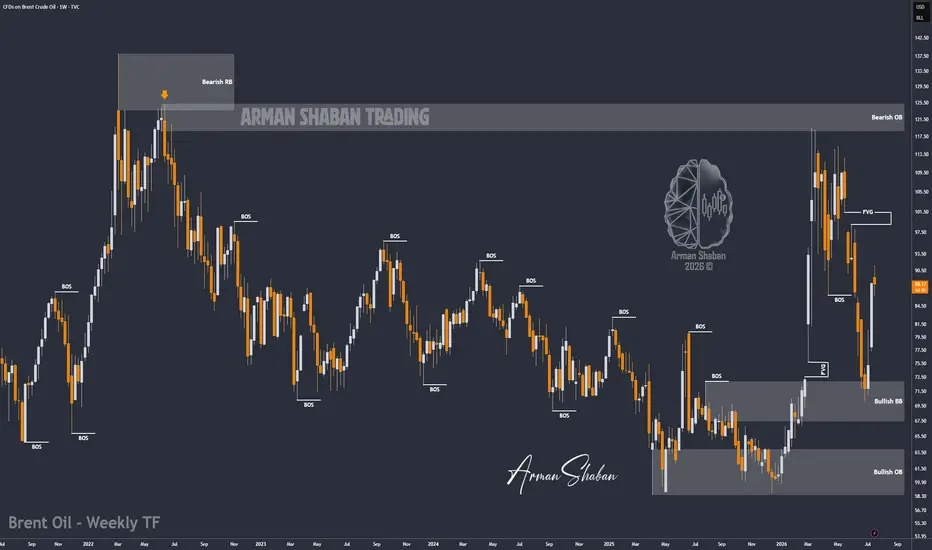
UKOIL | Brent Oil Breaks $90, Are Triple Digits Next?By analyzing the #BrentOil chart on the weekly timeframe, we can see that price continued to follow the expected bullish scenario and finally broke above the psychological $90 level, reaching as high as $91.5.
Currently, Brent Oil is trading around $88 after a minor correction. In my view, this pul
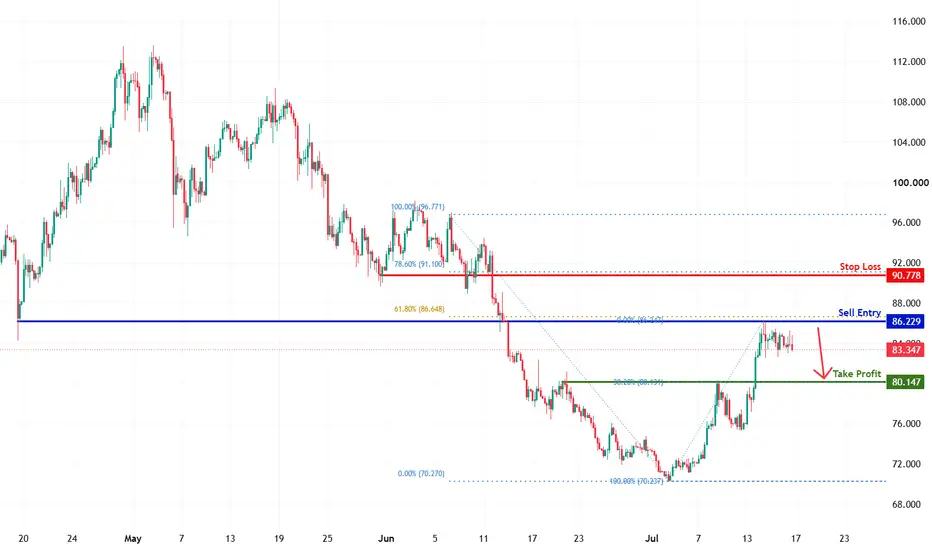
UKOILSPOT H4 | 61.8% Fibonacci Resistance HoldsBased on the H4 chart analysis, we can see that the price has rejected our sell entry level at 86.22, which acts as a pullback resistance that aligns with the 61.8% Fibonacci retracement.
Our stop loss is set at 90.77, which is a pullback resistance that aligns with the 78.6% Fibonacci retracement.
UKOIL | Brent Oil Hits $87.5 As Hormuz Tensions Keep Rising!By analyzing the #BrentOil chart on the weekly timeframe, we can see that price continued to follow the expected bullish scenario and successfully reached the projected targets, rallying as high as $87.5.
Currently, Brent Oil is trading around $85. With tensions around the Strait of Hormuz increasi
Oil Above $80 — Is the Next Stop $90?After tensions between Iran and the United States escalated again in the Middle East, crude oil ( FX_IDC:USDBRO ) rallied from around $70 and has successfully established itself above $80. So far, oil has gained more than +20%, reflecting the market’s reaction to the renewed geopolitical tensions.
Weekly overview: XAUUSD, #SP500, #BRENT | 24 July 2026XAUUSD: SELL 4015.00, SL 4050.00, TP 3927.50
Gold begins the week near $4,015 per ounce, remaining under pressure as rising oil prices lead markets to reassess Federal Reserve interest rate expectations. Higher energy costs are increasing inflation risks, supporting US Treasury yields, and raising
UKOIL | Higher targets!By analyzing the Weekly chart of Brent Oil we can see that after the announcement of ceasefire being over and the Strait of Hormuz being closed, Oil surged, going from 75.22 all the way to 87.55! It went through the Volume Imbalance and then dropped a bit, currently being traded at around 86.50.
Wi
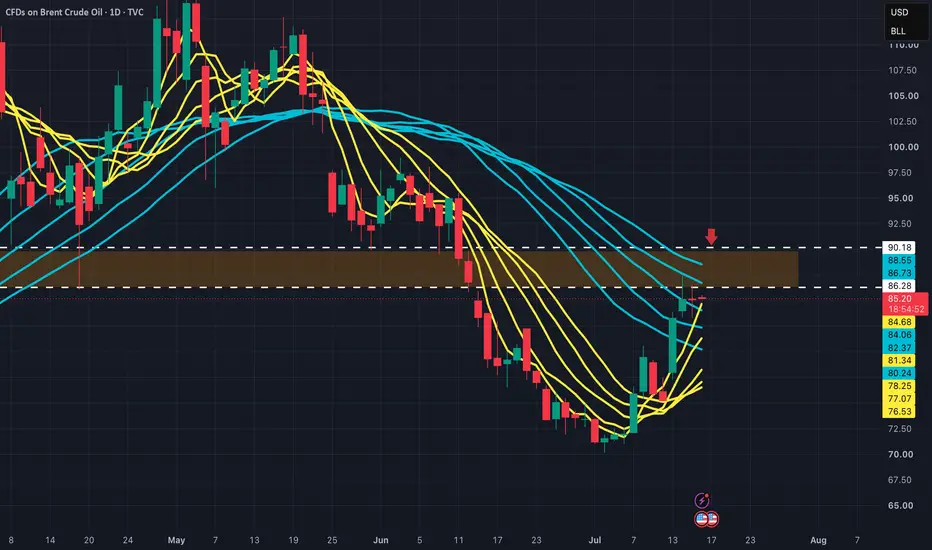
BRENT Crude: Geopolitical Squeeze Meets Major Resistance!This week, the global financial markets are heavily focused on the rapidly escalating geopolitical conflict in the Middle East. With the US-Iran relations hitting a freezing point, the previously established "ceasefire" has officially collapsed, and the US has issued a stern ultimatum to Iran. This
OILHello Traders! 👋
What are your thoughts on Oil?
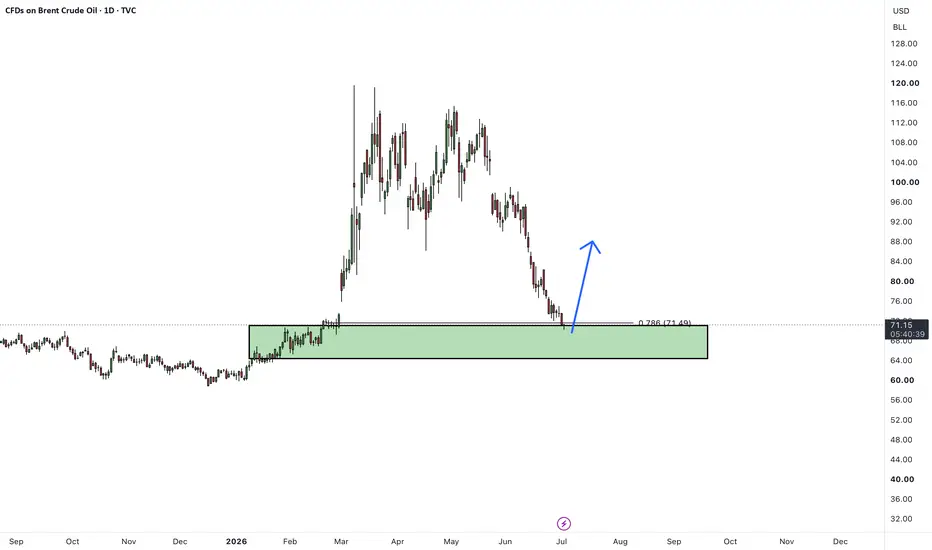
On the daily chart of Brent Crude Oil, we are witnessing the completion of a large corrective cycle and a return to one of the most critical demand areas.
After hitting highs around $119, Brent entered a sharp downtrend. With an approximate 40% drop
Will Brent hit 92 again?Will Brent hit 92 again?
Brent oil dropped from 113 to 76. It bounced off the 76 bottom on Trump's comments. Will Brent reach 92 again? I'll try to answer that with 3 data points.
Momentum is up. RSI is at 57, above its SMA14. So price is picking up speed. There's still solid room before we can ca
See all ideas
Displays a symbol's price movements over previous years to identify recurring trends.