Fibonacci Confluence
PAX GOLD BEARISH SETUP: IS ANOTHER DROP TOWARD THE LOWS COMING?Yello Paradisers! are #PAX Gold bulls about to get trapped before another strong move to the downside? Price action is currently showing a high-probability bearish setup, supported by both market structure and Dow Theory.
💎#PAX Gold first formed a clear Double Top pattern, followed by a decisive break of market structure. After that breakdown, price created another Lower Low, confirming that sellers remain in control and that the broader short-term structure is still bearish.
💎Right now, price
XAUUSD Bullish trade Setup.Price has been retracing since past 3 trading sessions after reclaiming the level of 4697, currently consolidating in a sideways direction at support zone of 4571-4563 formed a double bottom formation with the neckline or immediate resistance of 4619.
If price gives breakout above 4619 then we might witness some good up moves which would have the potential to make newer high than 4697 as over all trend is still bullish and the decline we saw was just a correction for few days.
Breakout setup i
BTCUSDT: Monthly Close Above the Line Would Confirm an SFPWorth flagging what this month's close actually does structurally, since it's not just a big green candle, it's sitting right at a level with real implications either way.
Price tagged 81,499.90 intramonth, comfortably above the orange line, then pulled back to close at 79,612.80, currently just below it. If the month finishes above that line rather than fading back under, that's a monthly SFP pointing up: a sweep of the level followed by a close that holds above it rather than rejecting back t
CRK - 50 SMA Cross and Double Bottom Setup💡 Swing setup idea
Resistance retest / double bottom breakout
🔎 Analysis summary:
After trading below the moving average, the stock finally crossed back above the 50 SMA and is approaching resistance. We can also see the completion of a double bottom pattern, with the upside potential projected by the depth of the bottom from the breakout point.
👀 Levels to watch:
Entry trigger: Break above $15.20
Target: $17.90
Stop: Under the support level
💬 Will the price break through resistance th
SELL STOP / BREAKOUT SIGNAL: XAU/USD (Gold Spot)A decisive breakdown below the key 4,608.00 support level will confirm a high-probability bearish continuation, aligned with higher-timeframe resistance, a top reversal pattern, and structural market shifts.
Execution & Order Details
Order Type: Sell Stop / Breakdown Entry
Entry Trigger: 4,608.00 (Triggered on a strong 15-minute candle close below support)
Stop Loss (SL): 4,628.00 (Placed above the broken horizontal support/flip zone; risk ~200 pips)
Take Profit 1 (TP1): 4,563.50 (Primary d
FIG - 50 SMA Cross and Double Bottom Reversal Setup💡 Swing setup idea
Trend reversal / double bottom breakout
🔎 Analysis summary:
After a sustained decline, the stock finally crossed back above the 50 SMA and started consolidating . We can also see the completion of a double bottom pattern, with the upside potential projected by the depth of the bottom from the breakout point .
👀 Levels to watch:
Entry trigger: Break above $28.15
Target: $39.30
Stop: Under the breakout level
💬 Will the reversal break through this time? Let me know in t
Ladun Investment (9535) : HH-HL Required for BreakoutTADAWUL:9535
🚀 Double Bottom Reversal in Play — 3 SAR Is the Key Breakout Level 🇸🇦
The stock has completed a major decline from the double-top zone around 7.17 SAR to a potential double-bottom around 1.98 SAR.
Now, the focus shifts from downside continuation to a possible trend reversal.
📈 Reversal Confirmation Needed
The current setup is promising, but the bulls still need to prove themselves.
A healthy Higher Low (HL) → Higher High (HH) structure is required to confirm that the trend i
LIGHTER - Trading Setup Case Study and Price TargetsHey, everybody. This is Brett. We're going to do a case study here on Lighter.
Lighter has had quite a run here, coming back since May, down here around a dollar all the way up to $3 there. So if we put the date and price range up, it's about 275% up, which is pretty good.
A couple of things here we're going to kind of unpack at the same time.
Originally, we were watching this and watching a bull flag pattern, and so the bull flag is where you have a flag pole, is the terminology, and then
Eth finally validates double bottom breakout and hits targetEthusd’s price action had been retesting the neckline as support forever. It wasn’t until the 50ma golden crossed above the 100 that we finally had liftoff but as soon as we did we hit the target very soon after and then some.*not financial advice*
$LINK – Shared Before the 15% Move, Still See More UpsideThis chart was shared in the LCA Community before the recent 15% explosion.
Despite the strong move already seen, there still appears to be some remaining upside.
A clean 3-5% unleveraged continuation is still possible from current levels.
However, traders should stay cautious of a potential liquidity sweep below before continuation.
Main target:
Completion of the double bottom pattern.
If price manages to flip the structure on the daily timeframe, the move can extend even higher.
Will continue
$WLD – Double Bottom Fulfilled, Testing ABCD + Golden Ratio ZoneEURONEXT:WLD has fulfilled a double bottom pattern and is currently testing a key confluence zone.
This area includes:
ABCD pattern
Golden Ratio
Gann Box line
There are enough confluences here to consider a short attempt.
Alternative scenario:
If this zone gets flipped, the bias shifts long toward the next liquidity sweep or even the $0.54 area.
Higher timeframe context:
Overall structure remains bearish.
However, Ethereum is currently showing more strength than Bitcoin, whi
UKNatgas:Profit target hit,Winter is coming and 182 is next!This is the update video for the UK NBP Natural Gas trade idea which was posted by me on 11th August 2026. That’s when I found the formation of a W pattern i.e. double bottom pattern where troughs were at 128 GBp level, neckline at 155 GBp level and MACD histogram at −0.64 contracting towards zero as the completion signal. The main target of 155 GBp has already been attained at 155.18 GBp. Prolonged heat in the northwest Europe has kept storage injection slower, Germany stocks lower than 5-year
SPCX: Bearish Sequence Unfolding Toward Downside Target CFollowing the completion of the prior bullish sequence into the overhead target zone near 150.00, NASDAQ:SPCX has shifted market structure to begin a corrective phase. Price action has formed a clear bearish sequence from the highs, defining an initial impulse into Point A followed by a corrective bounce to Point B.
The aggressive breakdown from the upper consolidation confirms active continuation toward the bearish Point C target. This projected target box sits between 125.50 and 129.00, rep
ZS - Trend Continuation and Double Bottom Setup💡 Swing setup idea
Trend continuation / double bottom breakout
🔎 Analysis summary:
The stock is continuing its move and closing an even bigger double bottom structure, making this setup look very interesting for continuation.
👀 Levels to watch:
Entry trigger: Break above $191.25
Target: $263.00
Stop: Under the breakout level
💬 Will the price break out and reach the target? Let me know in the comments! 👇
Good luck!
⚠️ Note: This is for educational purposes only and is not financial
GBPUSD bounce back heading towards the breakout!After retracement bounced back taking the support of 1.3479 level, had already broken above the neckline at 1.3513 not we are expecting continuation in the upper direction.
Level of 1.35446 is going to be out 1st target for this setup, if breached then we can aim for 1.3559 as it's 4 month's highest level, if price gives breakout above it sentiment would be very bullish and then price may retest its year long resistance of 1.3661(the top most level).
as of now sentiment is bullish, most likely
UKNatgas:Winter is coming, the Strait of Hormuz is still closedIt can be argued that UKNatural Gas is one of the best fundamental-backed commodities in Europe's energy markets today and the daily chart is finally showing it through technical analysis that needs to be taken into consideration. The price is 75.67% higher on an annual basis, and the fundamentals behind this performance are just the same as they were yesterday. Tehran and Muscat have failed to reach any agreement on the Strait of Hormuz after the weekend meeting broke down again – Tehran made a
ZS - Resistance Retest and Double Bottom Setup💡 Swing setup idea
Resistance retest / double bottom breakout
🔎 Analysis summary:
The price broke above the 50 SMA and has now reached resistance again. We can also see a beautiful double bottom pattern closing, with buyers volume starting to rise as well.
👀 Levels to watch:
Entry trigger: Break above $177.70
Target: $235.70
Stop: Under the breakout level
💬 Will the price break through this area this time? Let me know in the comments! 👇
Good luck!
⚠️ Note: This is for educational
When the Target Becomes the Entry: Flipping TA on Its HeadMost technical-analysis textbooks teach pattern targets as destinations. A breakout occurs, the pattern provides a measured objective, and the trader watches price travel toward it.
But what if reaching the destination creates the next setup?
That is the counterintuitive idea explored in this case study. Gold Futures (GC) have produced a recognizable double-bottom structure on the daily chart. After price broke through the pattern's neckline, the subsequent advance brought GC toward the double
JIO FINANCIAL SERVICES (NSE: JIOFIN)Technical Confluence & Pattern Exhaustion
Textbook Downside Symmetry Completed:
Pattern 1 (2024): Head & Shoulders top near ₹394 broke the ₹310 neckline, cleanly hitting the projected linear target near ~₹226 (sweeping liquidity at the opening candle wick near ₹198).
Pattern 2 (2025–2026): Replica Head & Shoulders top near ₹340 broke the ₹290 neckline, hitting the linear target near ~₹240 with exact mathematical precision.
Full Liquidity Absorption & Double Bottom Base:
Downside targets from
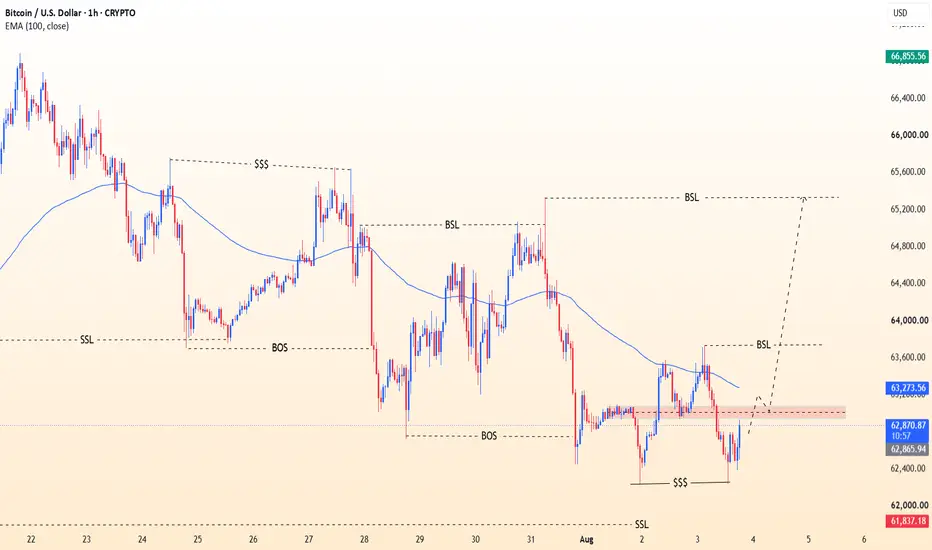
BTC/USD Update: Liquidity Swept & Bullish Reversal Loading!Bitcoin just delivered a classic Smart Money Concepts (SMC) setup on the 1-Hour chart!
Price took out the equal lows ($$$) to sweep sell-side liquidity (SSL) below $62,400 and is now building momentum toward the upside, forming a solid Double Bottom structure inside a key support zone.
We are eyeing a breakout above the local resistance zone around $63,600 (BSL) to confirm the shift in momentum toward upper Buy-Side Liquidity targets! 🎯
🟢 TRADE SIGNAL SETUP: BTC/USD (Spot / Futures)
Entry Zon
NVDA - Resistance Retest and Double Bottom Setup💡 Swing setup idea
Resistance retest / double bottom breakout
🔎 Analysis summary:
The price is back near resistance again, but this time the setup looks stronger. We can see a double bottom closing, a cross above the 50 SMA, and buyers volume starting to step in.
👀 Levels to watch:
Entry trigger: Break above $213.80
Target: $236.54
Stop: Under the breakout level
💬 Will the price break resistance this time? Let me know in the comments! 👇
Good luck!
⚠️ Note: This is for educational
KKR - 50 SMA Reclaim and Double Bottom💡 Swing setup idea
50 SMA reclaim
🔎 Analysis summary:
The price moved above the 50 SMA, came back to test it, and then continued higher into resistance while closing a double bottom pattern. That gives the chart a constructive look if price can confirm above the trigger.
👀 Levels to watch:
Entry trigger: Break above $108.40
Target: $133.20
Stop: Under the breakout level
💬 What do you think about this setup? Let me know in the comments! 👇
Good luck!
⚠️ Note: This is for educational


