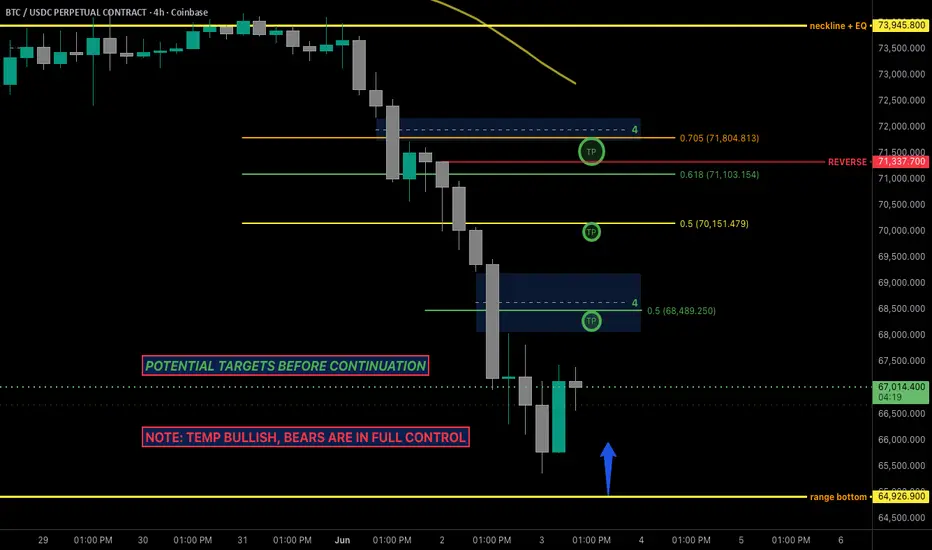
BTCUSD Weekly Analysis – Bearish Structure Targets Lower LevelsBTCUSD remains under bearish pressure on the weekly timeframe after completing a major liquidity sweep near the highs and subsequently breaking market structure to the downside. Since then, price has continued to form a series of lower highs and lower lows, confirming that sellers remain in control of the broader trend.
The recent recovery failed to establish a meaningful bullish continuation and was met with selling pressure near the Fair Value Gap (FVG) resistance zone. This rejection suggests that market participants are still using rallies as opportunities to distribute positions rather than accumulate for a sustained move higher.
From a structural perspective, BTCUSD appears to be seeking deeper inefficiencies below current price levels. The next major downside targets are located around 53,700 and 50,400, where unfilled higher-timeframe imbalances remain. These levels represent significant draw-on-liquidity areas and could attract price if bearish momentum continues to dominate.
Bearish Scenario:
As long as price remains below the recent FVG resistance and continues to respect the lower-high structure, BTCUSD is likely to continue its decline toward 53,700. A decisive move below this level could extend the correction toward 50,400, completing a deeper retracement and filling the remaining weekly imbalance.
Bullish Scenario:
If buyers manage to defend the current support area and generate a strong bullish displacement that breaks the most recent lower high, the market could enter a larger corrective rally. In this case, BTCUSD may revisit the nearby FVG resistance zones before deciding its next directional move. However, this scenario requires a clear shift in market structure and sustained buying momentum.
For now, the weekly chart continues to favor the bearish outlook, with 53,700 and 50,400 remaining the primary downside objectives before a larger bullish reaction becomes more likely.  Short
Short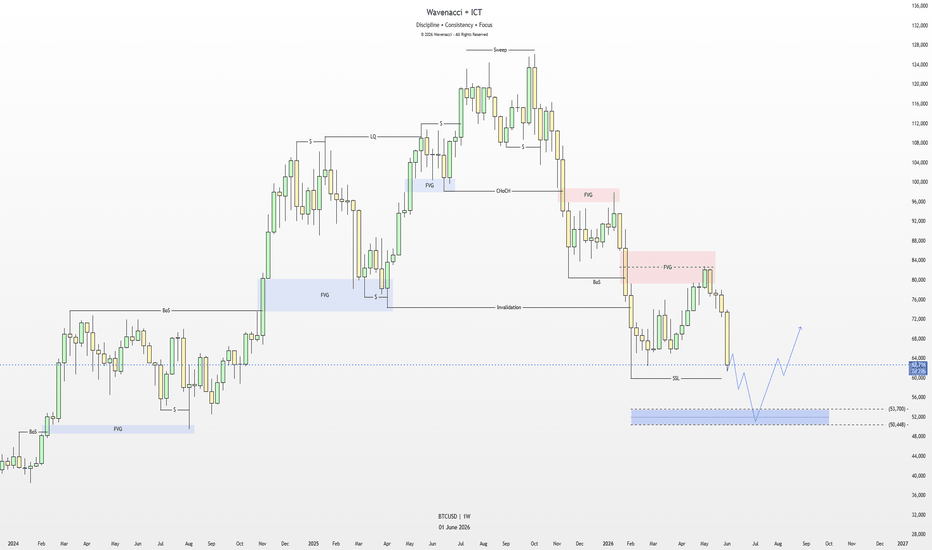
Long 
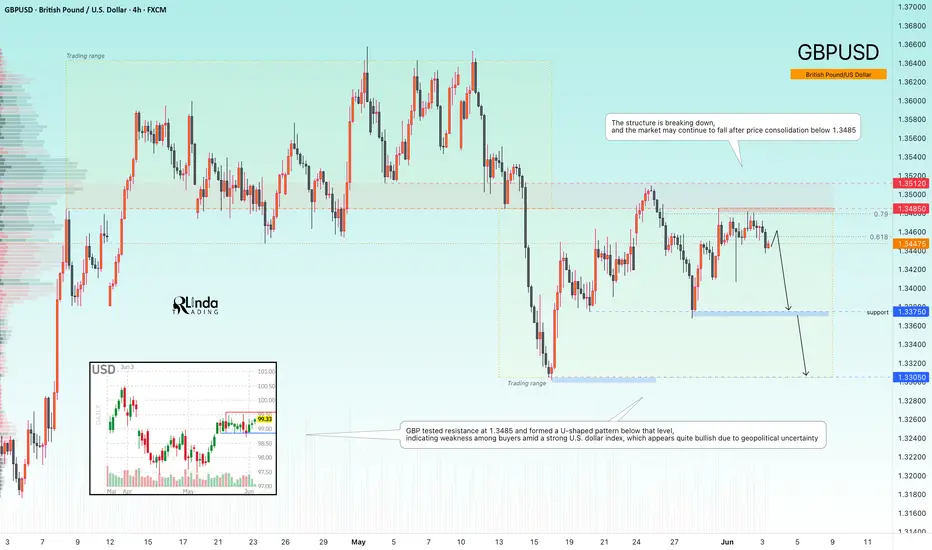
GBPUSD - bearish U-pattern relative to resistance FX:GBPUSD remains in a corrective phase, but after encountering resistance at 1.3485, the pair is breaking its local structure and preparing for a potential decline
Based on market positioning data, large players continue to maintain a bearish bias. At the same time, the growing concentration of short positions created the conditions for the short squeezes seen in late May and early June. Technically, a strong U.S. dollar, which is attempting an upward distribution move amid geopolitical tensions, is weighing on the pound. Meanwhile, GBPUSD continues to consolidate below key resistance, opening the door for a move toward support zones
Resistance levels: 1.3485, 1.3412
Support levels: 1.3375, 1.3305
GBPUSD tested the 1.3485 resistance level and formed a U-shaped pattern below it, signaling buyer weakness against the backdrop of a strong U.S. Dollar Index. The structure is breaking down, and the market may continue lower following consolidation below 1.3485. The primary areas of interest remain 1.3375–1.3305.
Best regards, R. Linda GOLD - The hunt for liquidity ahead of the fall ICMARKETS:XAUUSD remains trapped within the 4450–4590 trading range. A long squeeze from support is triggering a rebound toward the liquidity zone or the range resistance. The primary trend remains bearish...
The U.S. dollar remains bullish due to geopolitical uncertainty. The index is consolidating above 99.0 and is positioned to move higher if tensions escalate. Oil also continues to show strength, which collectively creates pressure on the gold market, as gold remains in both a local and global bearish trend. Gold is stuck inside a range. The nearest catalysts are Middle East developments, today's JOLTS job openings data, and Friday’s Non-Farm Payrolls (NFP) report.
Drivers:
Upward: Progress in U.S.–Iran negotiations, de-escalation in Lebanon, a weaker dollar, weak U.S. labor market data.
Downward: Breakdown of negotiations, escalation, rising oil prices, hawkish Fed rhetoric, a stronger dollar
Resistance levels: 4540–4546, 4589
Support levels: 4510, 4462, 4450
Gold is approaching the liquidity zone quite aggressively. Technically, this may represent a liquidity grab before a further decline. Against the backdrop of both the local and global bearish trend, short positions remain the preferred bias. A short squeeze at 4540 (4546) could trigger a move down toward 4450. However, it cannot be ruled out that the market may test the current range resistance due to liquidity resting above 4589 before resuming its decline.
Best regards, R. Linda  Short
Short
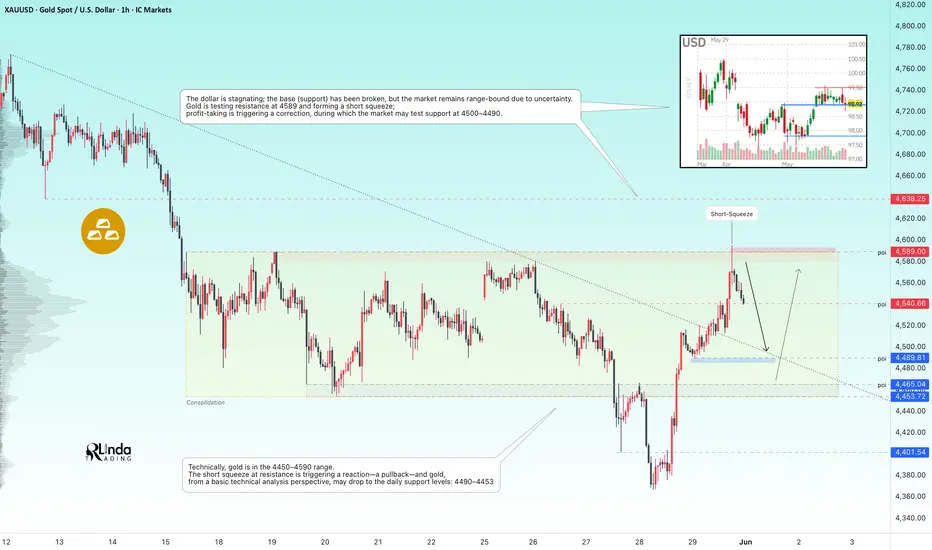
GOLD - A short-squeeze triggers a correctionICMARKETS:XAUUSD volatility continues to increase due to geopolitical factors. A ceasefire framework has reportedly been agreed upon, but it has not yet been officially signed, leaving the market trapped within its current trading range
The U.S. dollar remains in stagnation. While its underlying support structure has been broken, the market continues to hold within a range due to ongoing uncertainty. Gold is also trading within a range after retesting the 4589 resistance level. A short squeeze has formed, and profit-taking is now driving a corrective move that could lead to a retest of the 4500–4490 support zone.
As of May 31, the agreement has not been officially signed. Reports suggest that the deal is still awaiting approval from Trump and Tehran, while negotiations over the final wording continue. Should the agreement be formally approved, the geopolitical risk premium is likely to decline further. However, any breakdown in negotiations could immediately revive demand for safe-haven assets and push both oil and gold higher
Resistance levels: 4589, 4638
Support levels: 4540, 4489, 4453
From a technical perspective, the market previously broke local downtrend resistance. However, after testing 4589, price formed a false breakout, triggering a corrective phase. The current move may be aimed at retesting support before another attempt higher. Nevertheless, the broader trend remains bearish.
Best regards, R. Linda Short 
BITCOIN - Bearish trend. Short squeeze before the drop... BINANCE:BTCUSDT.P continues to develop a bearish trend that aligns with the broader global downtrend. Within the current distribution phase, the market has printed a new low at 72,500 and has since moved into consolidation
As of May 29, U.S. spot Bitcoin ETFs recorded their tenth consecutive day of net outflows, while large holders continue transferring BTC to exchanges. Capital managers remain net long, but positioning has been reduced from the peaks seen in April. Large speculators (hedge funds) are also maintaining a moderate net-long exposure, although there has been no meaningful increase in bullish positioning.
The market remains highly sensitive to geopolitical developments. Despite ongoing rumors of a potential agreement, volatility and uncertainty are likely to persist over the medium term.
From a D1–W1 perspective, Bitcoin reversed its local trend after a false breakout above the 80K–82K zone and is now accelerating to the downside. The market is heading toward the daily correction support area, with the primary zone of interest located at 71,500–70,500. I expect price could reach this target following a retest of the liquidity zones at 74,200, 74,750, and 75,300
Resistance levels: 74,200, 75,300, 76,000
Support levels: 72,500, 70,670
At this stage, there is no compelling case for new long positions or medium-term buying. Market structure remains weak, and any upward movement should be viewed as a potential opportunity to look for short entries.
The key area of interest, where a retest could trigger a reversal and renewed downside pressure, remains 74,200–75,300. A short squeeze could provide an attractive setup for such a move.
Best regards, R. Linda Short 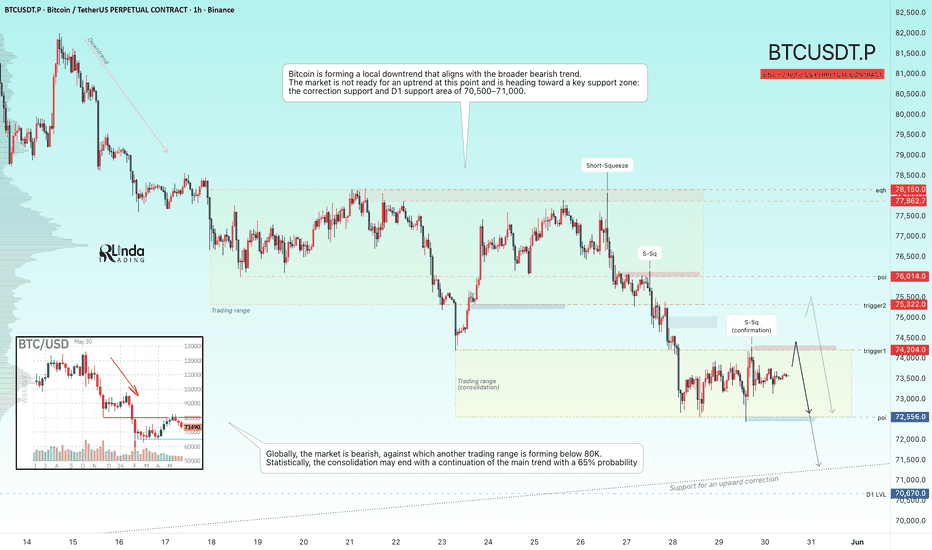
Short 
 Long
Long
Long 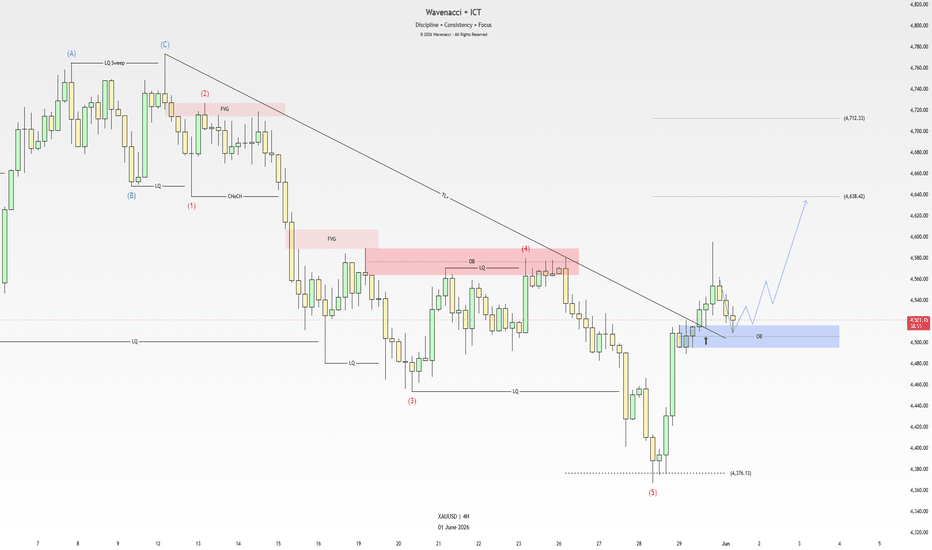
Bitcoin major Fib supports are near 72K$ zoneBitcoin is currently testing the major Fibonacci support zone between 70,000 and 72,500 USD, which includes the critical 0.5 and 0.618 retracement levels. A bullish reversal from this area could trigger a recovery toward 80,000 USD initially, with potential to reach 85,000–86,500 USD in the medium term. However, daily price action, shows BTC slipping under 75,000 USD with the 0.382 Fibonacci level at 75,041 USD already lost, increasing the importance of watching how price reacts at the 0.5 and 0.618 levels.
so as first step price should recover back and above 75K$ ASAP.
MMBT — your eyes on the markets. If this helped, hit like and follow. 💬✅ Long 
 Short
Short
 Long
Long
GOLD - Correction toward the resistance of the range ICMARKETS:XAUUSD continues to react to the geopolitical backdrop, while still remaining under pressure from both the global and local bearish trend. Meanwhile, the U.S. dollar remains in stagnation, forming a trigger around the 99.0 area
Optimism surrounding a potential peace deal has started to fade amid ongoing hostilities. The dollar remains range-bound, but at the same time continues to receive support from geopolitical tensions and hawkish rate expectations. Further movement in gold will largely depend on developments around the ceasefire narrative and oil market dynamics.
Key catalyst:
- Official confirmation by Trump of the proposed 60-day ceasefire with Iran (or a breakdown of negotiations).
Drivers:
- Bearish — Failed negotiations, escalation, hawkish Fed rhetoric, a stronger dollar, rising oil prices
- Bullish — Official ceasefire confirmation, de-escalation, dovish Fed signals, declining oil prices
Resistance levels: 4540, 4580, 4600
Support levels: 4488, 4465, 4450
Technically, gold has returned back into the trading range. A retest of the 4540 liquidity zone could trigger a corrective move toward support (a manipulative move) before a potential continuation higher toward the upper boundary of the range.
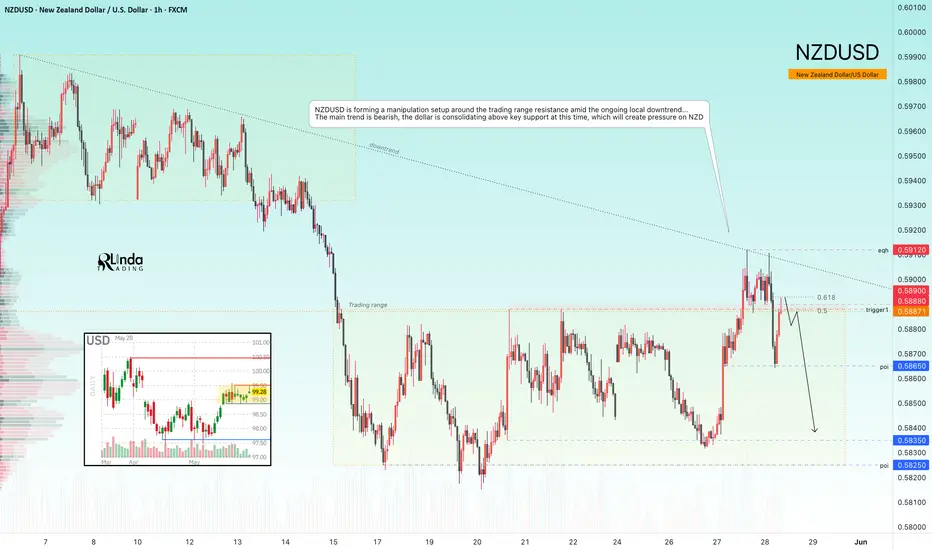
Best regards, R. Linda NZDUSD - A false breakout of resistance amid a bearish trendFX:NZDUSD is forming a manipulation setup around the trading range resistance amid the ongoing local downtrend...
NZDUSD remains trapped in a difficult position: the RBNZ is being forced to tighten policy against a weakening economy due to external shocks. The market has already priced in two more rate hikes before year-end, providing downside support around the 0.5800 area. Positioning data from major market participants continues to reflect a consolidated bearish bias on NZD. This underlying structure has not changed even after the RBNZ’s hawkish signal — medium-term players still do not believe in the sustainability of NZD strength amid deteriorating economic conditions.
From a technical perspective, a false breakout is developing around the D1–W1 resistance zone...
Resistance levels: 0.5890, 0.5912
Support levels: 0.5865, 0.5835, 0.5825
Locally, the market is bouncing from 0.5865 amid a rebound in the DXY index, but the broader structure remains intact. The pair is currently testing an imbalance zone, and a local short squeeze could trigger a decline toward the lower boundary of the range, with potential continuation toward medium-term lows.
Best regards, R. Linda BITCOIN - The hunt for liquidity ahead of the fall BINANCE:BTCUSDT is forming a downtrend both globally and locally. The focus is on the key support and resistance levels of 75,300–78,100; within the intraday price action, following a sharp decline, the price has entered a phase of liquidity hunting.
Large companies continue to transfer bitcoins to exchanges; U.S. spot bitcoin ETFs have seen outflows for the sixth consecutive day; asset managers and dealers are in a net long position, but leveraged speculators are holding a significant short position, which is creating pressure.
On May 14, the CLARITY bill passed the Senate Banking Committee by a vote of 15–9 and is awaiting a full vote. The market has already reacted to rumors, and going forward, it may already price in the news. At this point, it is worth focusing on the technical context—a downtrend, short squeezes, and new lows.
Resistance levels: 76,000, 76,650, 78,100
Support levels: 75,300, 74,200, 73,700
A correction is forming, during which the market may test areas of interest and liquidity before falling. Focus on 76K – 76,600 and 77,800. A short squeeze could trigger a sell-off. Consolidation below 76K – 75,300 will intensify pressure from the bears.
Best regards, R. Linda! Short 
Short 
GOLD - Flat, pressure from bearsICMARKETS:XAUUSD is giving up all of Monday’s gains and may test the 4,500 level again. The immediate direction will be determined by developments surrounding the negotiations and the fragile ceasefire, as well as oil price movements. As long as risk aversion and the dollar remain dominant, gold will stay under pressure
The positive sentiment surrounding the ceasefire that emerged over the weekend quickly turned negative. The dollar is currently stagnating but is consolidating above key support, which is putting pressure on gold. The resumption of oil price growth is fueling inflation fears, bringing “hawkish” expectations regarding the Fed rate back to the forefront. The market estimates the probability of a rate hike by the end of the year at just over 50%
Drivers:
Downside: Escalation, breakdown of negotiations, rising oil and dollar, hawkish signals from the Fed.
Upside: Progress in negotiations, de-escalation, falling oil, weakening dollar
Resistance levels: 4540, 4580, 4589
Support levels: 4500, 4488, 4465
Technically, consolidation below 4540 could lead to a decline to 4488 (liquidity zone). However, a primary retest of support and a long squeeze could trigger a minor pullback to 4540 before the decline continues to 4450–4420
Best Regards, R. Linda! Short 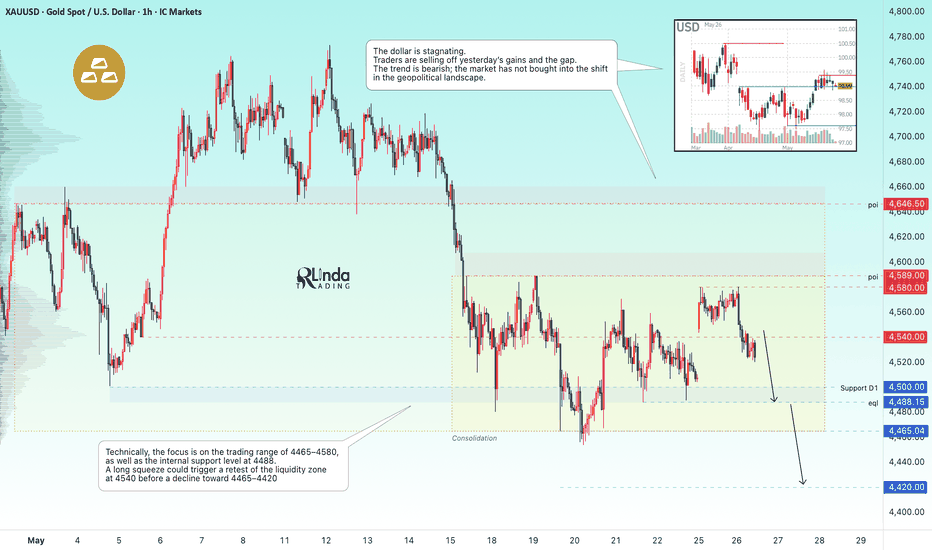
XAG/USD Silver — Bearish Retest or Bullish Reclaim?Silver is sitting at a major decision point right now.
After the recent U.S.–Iran escalation, I’m shifting my focus from neutral-to-bullish to cautiously bearish until bulls prove they can reclaim the key resistance zone.
The level I’m watching closely is:
$77.00–$77.36
This area is important because it lines up with several technical factors:
• 0.50–0.62 Fibonacci retracement zone
• Overhead FVG / imbalance resistance
• Moving average pressure
• Prior structure retest area
• RSI still needing stronger confirmation
Right now, price is trading below this zone, which makes this look more like a potential bearish retest than a confirmed bullish continuation.
Geopolitical tension can sometimes support metals, but the current environment is more complex. If escalation pushes oil higher and inflation concerns rise, that can increase pressure from yields, the dollar, and rate expectations. That type of environment can weigh on silver if buyers fail to show strength.
Bearish Scenario
The bearish setup becomes stronger if price rejects from the $77.00–$77.36 zone.
The first major confirmation would be an H1 close below:
$76.20
A stronger bearish breakdown would come below:
$75.49
If sellers take control, my downside targets are:
Target 1: $74.68
Target 2: $73.63
Target 3: Lower liquidity / FVG zones
A rejection from this current zone would suggest buyers failed to reclaim control and that silver may need a deeper correction before finding stronger support.
Bullish Invalidation
For the bearish idea to weaken, bulls need to reclaim:
$77.36
A clean H1 close above $77.36, followed by a successful retest, would make the bullish continuation case more attractive.
If that happens, upside targets would return toward:
$77.87 → $78.50 → $78.80–$79.10
Until then, I’m not interested in forcing a long into resistance.
My Current Bias:
Bias: Cautiously bearish below $77.36
Bearish confirmation: H1 close below $76.20
Stronger confirmation: Breakdown below $75.49
Bullish invalidation: Clean reclaim above $77.36
This is one of those areas where traders need patience. The market is sitting between a potential reclaim and a potential rejection. Guessing here is dangerous.
At Wright Way Investments, we don’t force the bias.
We wait for price to show us the Wright Way.
Confirmation over prediction. Structure over emotion. Risk management over ego.
 Short
Short