GBPUSD Liquidity Grab Complete | Massive Bullish Move Next?Price has tapped into a key bullish order block around 1.3330 and is showing signs of accumulation after sweeping weak lows. Market structure remains favorable for a continuation higher if buyers defend this zone.
🔹 Bullish Order Block: 1.3330 – 1.3340
🔹 Liquidity sweep below weak lows completed
🔹 Targeting internal liquidity and strong highs near 1.3500
🔹 Extended target at BSL around 1.3637
As long as the order block holds, I expect a retracement followed by an impulsive move toward buy-side
Fractal
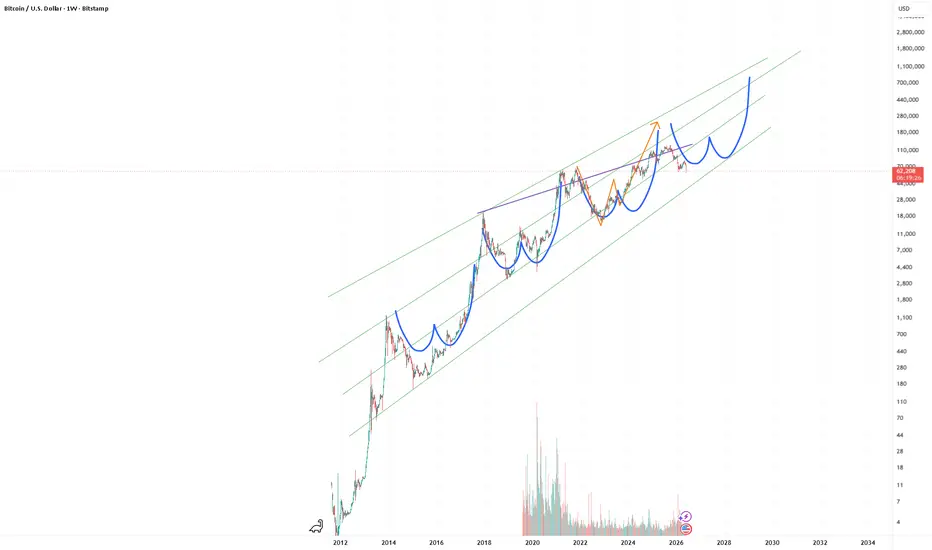
BTC Fractal (2015 Bottom - 2018 Top)Don't take this too seriously. Let's have some fun while our favorite orange coin slides..
This feels like an unlikely bottom, but we're sitting around '21 double top price levels. We've also consolidated here for the majority of '24 before the push to 100K. Sentiment is about as negative as it can get. Bears are getting greedy for lower prices and even bulls want lower prices to buy.
Let's call this the double bottom and use the 2015 - 2018 fractal as our map. How about a run to 400K by 2028?
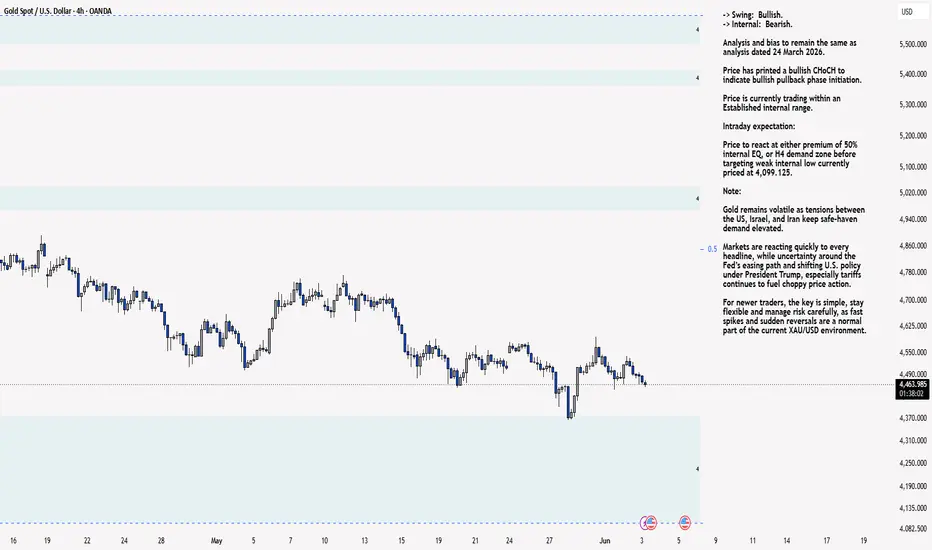
XAU/USD 08 June 2026 Intraday AnalysisH4 Analysis:
-> Swing: Bullish.
-> Internal: Bearish.
Analysis and bias to remain the same as analysis dated 24 March 2026.
Price has printed a bullish CHoCH to indicate bullish pullback phase initiation.
Price is currently trading within an Established internal range.
Intraday expectation:
Price to react at either premium of 50% internal EQ, or H4 demand zone before targeting weak internal low currently priced at 4,099.125.
Note:
Gold remains volatile as tensions between the US,
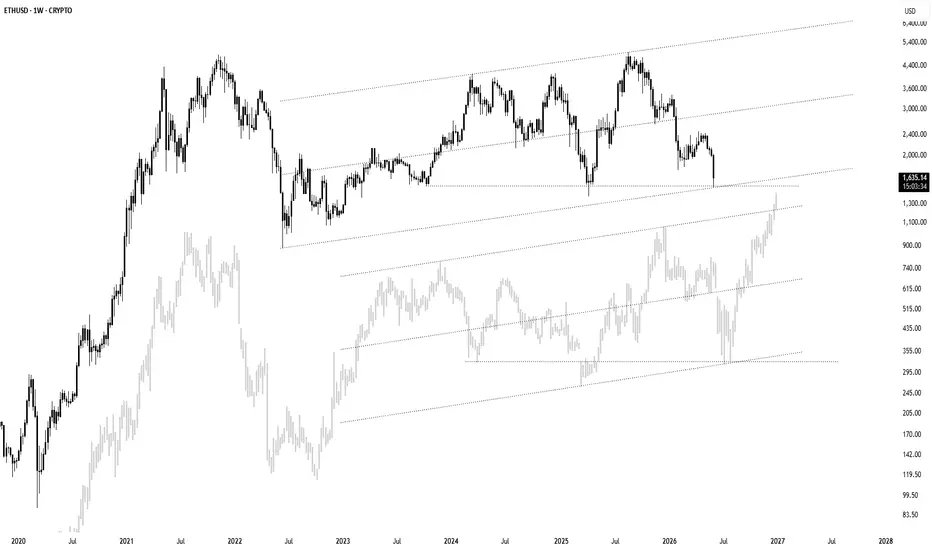
ETH IS DEAD...I think we are in a golden investment opportunity, as we can see in the chart. Ethereum has a lot of fractals, and according to this fractal, it is now at the bottom of the price for holding, and from now on, a move towards the historical ceiling can be considered. Many are looking for Ethereum to fall to $1,200 to $1,000, but I don't think this will happen. The price of $10,350 is the target for this move, and up to that price, I am not personally a seller, and the buying range is $1,620 to $1,
DAX Elliott Waves Analysis: End of Grand Super Cycle Bull MarketIn this video, I analyzed the Germany DAX index on a Grand Super Cycle (GSR) level starting from 1970s. Alarmingly, this analysis tells me that DAX GSR bull market has ended in Jan 2026. What follows will then be a fall to March 2020 low region where I brought up the importance of that price region as a support.
DAX has recently completed it's first sub-wave 1 and sub-wave 2 down and is currently on sub-wave 3 down. I expect a wave 3 type of crash for DAX, similar to Nikkei, S&P500, and Nasdaq.
SPX Elliott Wave Cycle Level Study: The Beginning of Bear MarketIn this video, I talk about the big picture for S&P500 using SPX. The entire wave that starts from March 2009 and ended on June 2026. I discussed the huge wave structure, the Fibonacci extension levels, and the breakdown of the sub-waves for the final cycle wave 5.
Essentially, the warning here is that we can see SPX going down another 2500 points to 4835 as the initial target, and potentially going down even more to 2020 March low of 2192.
Be careful out here.
Good luck!
USDCHF - Long opportunities Looking at USDCHF. Our external structure is bullish and internal structure for the moment is bearish but only to hopefully facilitate longer term buy opportunities.
We have liquidity built up before both of the the demand zones we have highlighted.
Will track this as of Monday morning to see where we are at.
XAU/USD 04 June 2026 Intraday AnalysisH4 Analysis:
-> Swing: Bullish.
-> Internal: Bearish.
Analysis and bias to remain the same as analysis dated 24 March 2026.
Price has printed a bullish CHoCH to indicate bullish pullback phase initiation.
Price is currently trading within an Established internal range.
Intraday expectation:
Price to react at either premium of 50% internal EQ, or H4 demand zone before targeting weak internal low currently priced at 4,099.125.
Note:
Gold remains volatile as tensions between the US,
Daily Trading Setup & Market OutlookSymbol:
Time Frame: 1 H
Every day I share updated technical analysis, key levels, trend direction, and potential trading opportunities based on market structure, support & resistance, and price action.
✅ Daily Updates
✅ Trend Analysis
✅ Support & Resistance Levels
✅ Bullish & Bearish Scenarios
✅ Risk Management Focus
Follow for consistent market insights and daily forecasts.
⚠️ Educational content only. Not financial advice.
XAU/USD 03 June 2026 Intraday AnalysisH4 Analysis:
-> Swing: Bullish.
-> Internal: Bearish.
Analysis and bias to remain the same as analysis dated 24 March 2026.
Price has printed a bullish CHoCH to indicate bullish pullback phase initiation.
Price is currently trading within an Established internal range.
Intraday expectation:
Price to react at either premium of 50% internal EQ, or H4 demand zone before targeting weak internal low currently priced at 4,099.125.
Note:
Gold remains volatile as tensions between the US,
Global clock is ticking down, but minute arrow is still moving66 rubles level is too scarily accurate, and still, this huge nuclear bomb on global scale is tormenting me.
When will it detonate? Will it let us go to 66 levels one last time?! I don't want to be late for this party.
Global probabilities are already starting to move, but this little agent on minutes timeframe is almost reversed, could this little guy confront this huge historical hyperion?
30 minutes, 2 days. This is where you can see those beautiful harbingers of change.
XAU/USD 02 June 2026 Intraday AnalysisH4 Analysis:
-> Swing: Bullish.
-> Internal: Bearish.
Analysis and bias to remain the same as analysis dated 24 March 2026.
Price has printed a bullish CHoCH to indicate bullish pullback phase initiation.
Price is currently trading within an Established internal range.
Intraday expectation:
Price to react at either premium of 50% internal EQ, or H4 demand zone before targeting weak internal low currently priced at 4,099.125.
Note:
Gold remains volatile as tensions between the US,
Gold Bearish move and Reversal Gold is now in bearish move after sweeping high liquidity pool now on recent swing low could be bullish trap and then sweeping the liquidity high probability zone is Nested fvg as levels are marked. these level with Sequential SMT divergence between xauusd and xagusd could be bullish strong move otherwise it will be considered as bearish.
XAU/USD 01 June 2026 Intraday AnalysisH4 Analysis:
-> Swing: Bullish.
-> Internal: Bearish.
Analysis and bias to remain the same as analysis dated 24 March 2026.
Price has printed a bullish CHoCH to indicate bullish pullback phase initiation.
Price is currently trading within an Established internal range.
Intraday expectation:
Price to react at either premium of 50% internal EQ, or H4 demand zone before targeting weak internal low currently priced at 4,099.125.
Note:
Gold remains volatile as tensions between the US,