Why Most Retail Traders Only See Half the MarketWhy Most Retail Traders Only See Half the Market
Level 1 vs. Level 2 – The Information Gap That Changes Everything
Every day, millions of traders open a chart believing they are looking directly at the market.
Candlesticks.
Support and resistance.
Trendlines.
Indicators.
It feels like t
DAX Index
No trades
No trades
Compare with DAX
Profile
ISIN
DE0008469008
FIGI
BBG000HY4HW9
Identifiers
ISIN DE0008469008
The German stock index DAX 40 (GER40) was introduced under "DAX" on July, 1st in 1988 by the Frankfurt Stock Exchange. It consists of the 40 largest companies listed on the Frankfurt Stock Exchange based on the market capitalization and liquidity. The trading hours for the Frankfurt Stock Exchange take place from 9:00 a.m. to 5:30 p.m. CET. The DAX40 is usually reported as a performance index, which means that the dividends of the companies are reinvested.
DAX : Buying the Pullback Instead of Chasing All-TimLast week, the DAX pushed into fresh all-time highs, and I warned against becoming the trader who buys at the most expensive price just before the market finally decides to pull back. Instead of chasing strength, the goal was to wait for price to give us some relief and look for an opportunity to en
Are You Really a Trader?Are You Really a Trader?
Or Is Your Brain Just Chasing the Next High?
Nobody wakes up one morning and says:
"Today I'm going to become addicted to gambling."
It doesn't happen overnight.
It happens quietly.
One decision at a time.
One trade at a time.
At first, the goal sounds perfectly
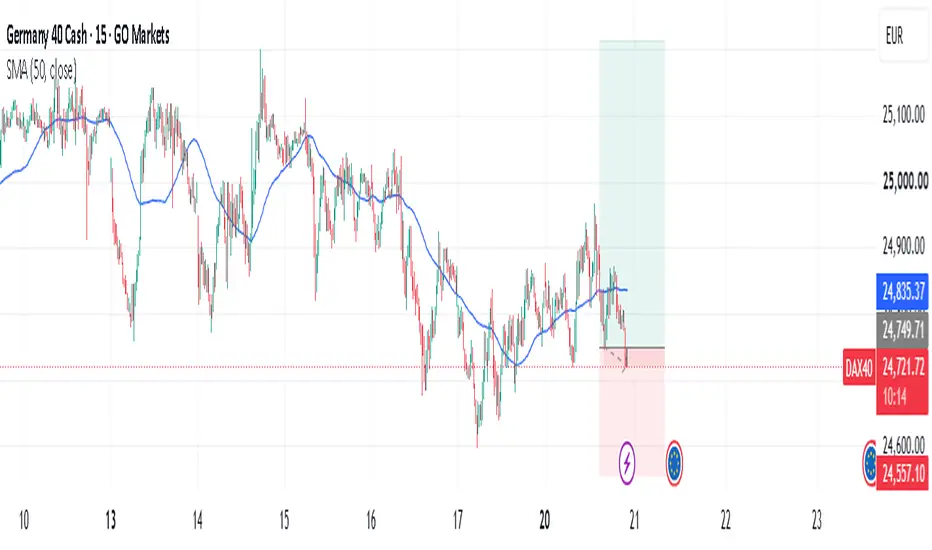
TEAM UPDATE — DAX LONG SETUPTeam, yesterday we handled DAX beautifully — clean execution, clean profits.
Today we stay sharp and focused because the levels are tight and the reaction zone is clear.
ENTRY ZONE:
24742 – 24715
STOP LOSS: 24560
Target 1: 24765 – 24783
Target 2: 24705 – 24865
MARKET NOTES
Price is pulling back
DAX levels to watch after its sharp pullbackEuropean markets took the brunt of the sell-off amid the rewed Middle East tensions this week. The DAX was trying to stabilise along with global markets this morning. Let's see if it will be able to do if oil continues to press higher.
After failing to sustain its breakout above the January 2026 r
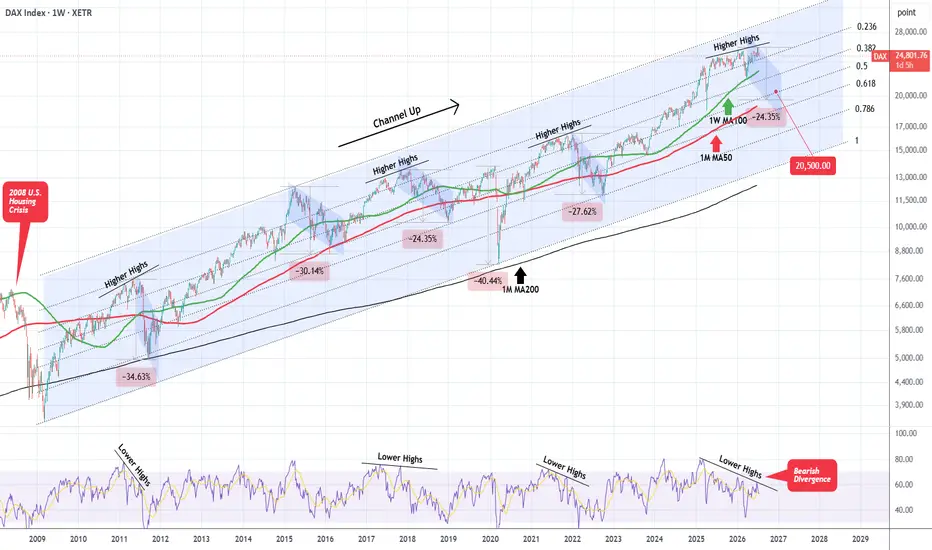
DAX Can this pattern cause a 20500 correction?DAX (DE40) has been trading within a 17-year Channel Up since the bottom of the 2008 U.S. Housing Crisis. This pattern has had 4 major corrections (Bearish Legs), excluding the March 2020 COVID flash crash.
All of those corrections hit at least they 1M MA50 (red trend-line) before bottoming and rig
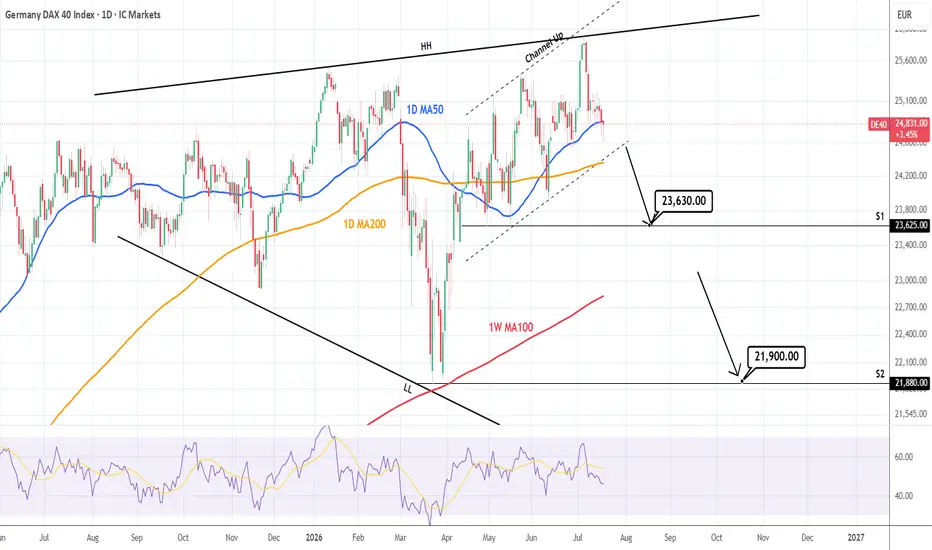
DAX: Ahead of massive bearish breakout.DAX is marginally neutral on its 1D technical outlook (RSI = 45.314, MACD = 34.100, ADX = 25.265) having crossed yesterday under its 1D MA50. This is the bearish wave that was caused from the July 6th HH trendline rejection and is so far supported by the bottom of the Channel Up, which is where the
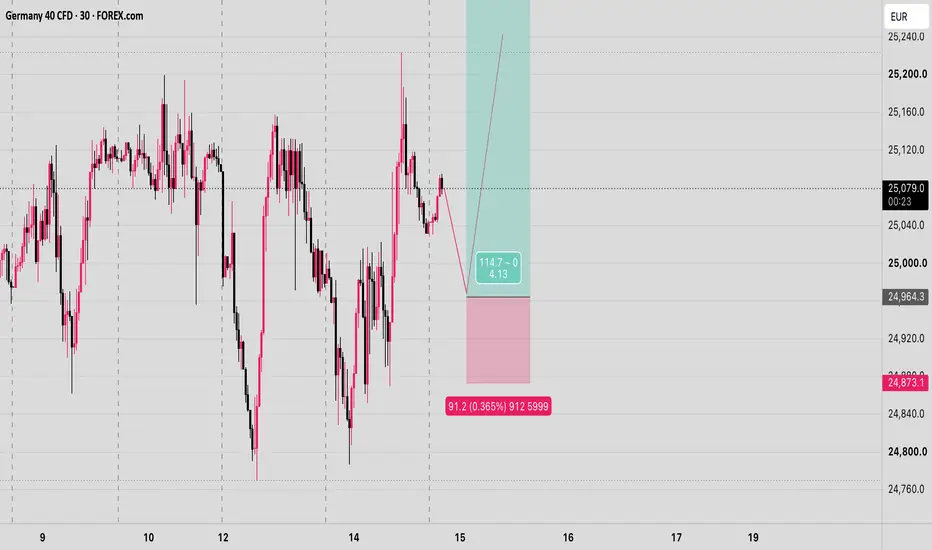
BUY GER40 - GERMAN 40 - DAX1. Price is using the Daily breaker at discount as the one pushing price for us
2. Price hit the Daily breaker Premium yesterday and reverted to discount
3. We are using the IFVGs as narrative too
4. We have IFVG - MSS - a bullish signature
5. On the daily we have BISI C.E as our draw and target +
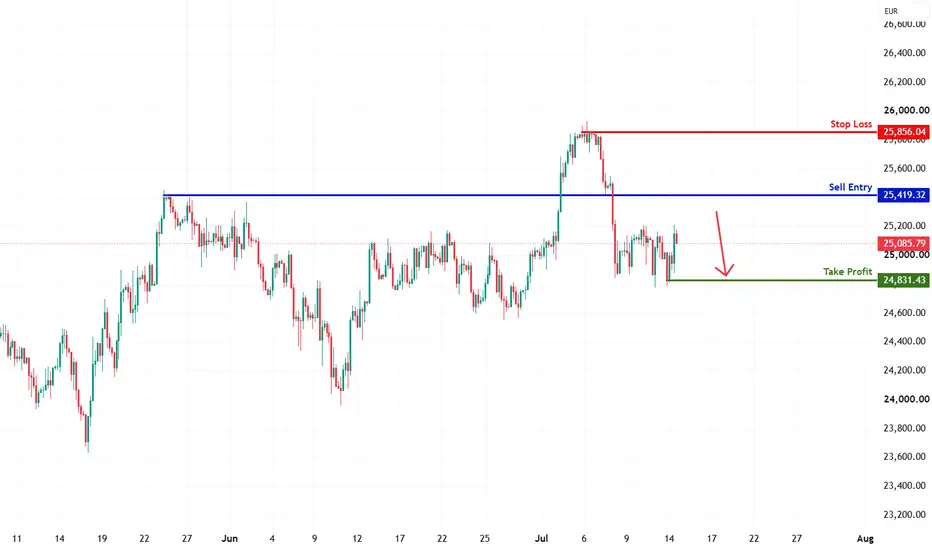
GER30 H4 | Pullback Resistance AheadBased on the H4 chart analysis, we could see the price rise to our sell entry level at 25,419.32, which is a pullback resistance.
Our stop-loss is set at 25,856.04, a pullback resistance.
Our take profit is set at 24,831.43, which is a pullback support.
High Risk Investment Warning
Stratos Marke
See all ideas
Summarizing what the indicators are suggesting.
Oscillators
Neutral
SellBuy
Strong sellStrong buy
Strong sellSellNeutralBuyStrong buy
Oscillators
Neutral
SellBuy
Strong sellStrong buy
Strong sellSellNeutralBuyStrong buy
Summary
Neutral
SellBuy
Strong sellStrong buy
Strong sellSellNeutralBuyStrong buy
Summary
Neutral
SellBuy
Strong sellStrong buy
Strong sellSellNeutralBuyStrong buy
Summary
Neutral
SellBuy
Strong sellStrong buy
Strong sellSellNeutralBuyStrong buy
Moving Averages
Neutral
SellBuy
Strong sellStrong buy
Strong sellSellNeutralBuyStrong buy
Moving Averages
Neutral
SellBuy
Strong sellStrong buy
Strong sellSellNeutralBuyStrong buy
Displays a symbol's value movements over previous years to identify recurring trends.
Frequently asked questions
DAX Index reached its highest quote on Jul 6, 2026 — 25,900.10 POINT. See more data on the DAX Index chart.
The lowest ever quote of DAX Index is 372.30 POINT. It was reached on Nov 6, 1974. See more data on the DAX Index chart.
DAX Index value has decreased by −0.16% in the past week, since last month it has shown a −0.72% decrease, and over the year it's increased by 2.32%. Keep track of all changes on the DAX Index chart.
The champion of DAX Index is XETR:HOT — it's gained 148.04% over the year.
The weakest component of DAX Index is XETR:SAP — it's lost −48.12% over the year.
DAX Index is just a number that lets you track performance of the instruments comprising the index, so you can't invest in it directly. But you can buy DAX Index futures or funds or invest in its components.
The DAX Index is comprised of 40 instruments including XETR:SIE, XETR:SAP, XETR:ALV and others. See the full list of DAX Index components to find more opportunities.