Understanding the Chikou Span: Secret Weapon1. Meet the "Secret Weapon" of the Ichimoku System 🔥
Welcome to the world of Ichimoku! 🌟 While many traders focus on the Kumo Cloud ☁️, there's a lesser-known member of the Ichimoku family that acts as a powerful confirmation tool: the Chikou Span 📈. Think of it as your secret weapon 🗡️ for cutting through market noise 🔇. For a new trader, the Chikou Span offers two immediate benefits: it helps you quickly identify the current market condition 📉📈 (is it trending or stuck in a range?) and it dram
Ichimoku Cloud
Market Pullbacks💬 Let's talk about pullbacks. If you've found them confusing, you're in good company 🤝. In fact, an estimated 99% of traders are unaware of the simple points we're about to cover 📊. My goal is to cut through the noise for you 🔇, remove the strange names and cumbersome details, and focus on the core concepts you actually need to know 🎯.
In the simplest terms, a market pullback is a temporary pause ⏸️ or "breather" 😮💨 in a larger price trend 📈.
Now, let's break down the main classifications of pu
Analysis of the Ichimoku Kumo Cloud📋 Executive Summary
The Ichimoku Kumo Cloud is presented as a critical tool for improving trading outcomes 📈 by providing detailed information on market trends, momentum, and potential reversals. The analysis highlights that the cloud's thickness is a primary indicator of momentum; thin clouds signify a strong trend 💪, while thick clouds indicate weakening momentum 📉 and an impending range-bound market. A thickening cloud, particularly when accompanied by a flat Span B, is a strong signal for th
TLT: NO ONE is betting on thisI don't call recessions and I'm not calling one now. But I do call charts. And this chart is saying something never seen before in NASDAQ:TLT history but a setup I've seen infrequently but often enough in tickers.
TLT is within the longest bear market to consolidation transition in its history. Six years of downtrend from the 2020 highs into a 2.4-year consolidation between $82.42 and $101.64. That's never happened in this ETF. Not even close.
Look at the daily structure. What jumps out isn'
The Two Golden Rules for Validating Crossovers1. 🚀 Introduction: Unlocking the Power of Ichimoku Crossovers
Welcome to your study of the Ichimoku Kinko Hyo system. If you've ever looked at a trading chart and felt overwhelmed by the lines and indicators, you're in the right place. ✨ The Ichimoku system's true strength lies in knowing how to read its signals correctly.
This guide is designed to bring you clarity by teaching two simple but powerful "golden rules" 🥇🥇 for identifying high-validity trading signals known as crossovers. By masteri
Bitcoin: Begun the relief rally it hasGoing back to my roots and looking at Ichimoku cloud breakouts. I've been looking to the 50% Retracement of the last big move down on INDEX:BTCUSD for a pullback to test it. On the 4-hour timeframe price action has setup a structural breakout that could conquer the recent consolidation.
On the higher timeframe (Daily) view:
In order to fully recover from the bear cycle Bitcoin is presently enduring it has to likewise perform an Ichimoku Cloud breakout on the Daily timeframe. The Daily
TSEM - Hammer at EMA 50 Confirms Bullish Trend ContinuationTSEM - CURRENT PRICE : 133.58
📈 TSEM – Technical Buy Call (Hammer at EMA 50)
Tower Semiconductor (TSEM) remains in a strong uptrend, with price holding above EMA 200 (long-term bullish) and above EMA 50 (medium-term bullish). The recent hammer candle near EMA 50 signals strong buying interest and rejection of lower prices. Importantly, price has been staying above the Ichimoku Cloud since May 2025, confirming a sustained bullish trend. RSI remains above 50, supporting positive momentum.
Ac
Bitcoin: Weekly Ichimoku Bear Trend ConfirmedThe Bitcoin INDEX:BTCUSD Weekly Bullish trend has officially ended per Ichimoku with both price and Chikou closing outside the cloud on the bearish side.
This is the complete inversion of the trend's start around the same time as the Blackrock Bitcoin ETF NASDAQ:IBIT launch.
Why is this signal important? I have studied and written about the high efficacy of Bitcoin's Daily Ichimoku trend strategy for over a decade. The weekly signal is naturally more infrequent (only 3 cases before) but
AMAZON - EMA 200: Where Institutions Step InAMZN - CURRENT PRICE : 237.70
📈 AMZN — Institutional Support Holds, Momentum Breakout
AMZN continues to trade in a primary uptrend, with EMA 200 acting as a strong institutional accumulation zone. Multiple pullbacks toward the EMA 200 (highlighted in green) were met with immediate buying interest, confirming long-term demand.
Momentum is now turning bullish:
🔥Price has broken back above the Ichimoku Cloud, signaling trend resumption.
🔥RSI is crossing above the 60 level, a classic sign of bul
ETHUSD finds support at Weekly Ichimoku CloudIt appears that ETHUSD, after quite a consolidative year in 2025, has found some support at the weekly Ichimoku Cloud. The Leading (Senkou) Span A appears to be crossing the Leading (Senkou) Span B in the first week of January 2026. That is a more bullish type of cloud support.
So it appears that the sideways chop for the last few weeks might be prices finally stabilizing after a significant -47.13% decline over the past few months. Note that ETH also declined about -66% in the first part of
TVTX - Breaks a 10-Year High – A New Chapter BeginsTVTX - CURRENT PRICE : 38.21
TVTX has made a major technical breakout by moving above its 10-year high at $37.04, a level last seen in August 2015. This move places the stock firmly into price discovery, meaning there is no nearby historical resistance overhead. Importantly, the breakout is holding, with the previous resistance now acting as strong support, a key sign of a healthy and sustainable uptrend.
Looking back, the 24 December breakout can be viewed as an ascending triangle breakou
Bitcoin Price History RhymesAs I look at the chart for CRYPTO:BTCUSD on the Weekly timeframe with Ichimoku overlayed the similarities to the 2021-2022 cycle top are eerie. Let's break down what I mean:
The key indicator of Ichimoku is price relative to the Kumo Cloud. A trend on the respective timeframe begins when price is above the cloud. I also use Chickou as momentum for confirmation. This means that the current Bull trend of Bitcoin began officially on the Weekly in November 2023.
The inverse to this rule is
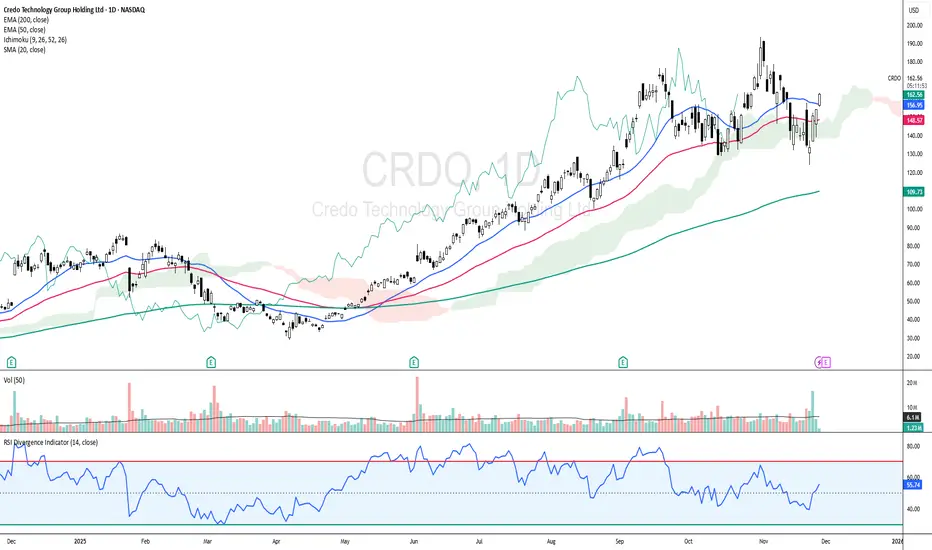
CRDO: Cloud + EMAs Aligning for Upside ContinuationCRDO - CURRENT PRICE : 162.95
CRDO is showing a bullish reversal setup as price rebounds and closes back above the EMA50 while holding firmly above the Ichimoku Cloud , signaling the major trend remains intact. Momentum is improving with RSI rising above 50 and not yet overbought, supported by increasing volume on the recent bullish white candlestick.
Today’s move above the 20-day SMA adds a positive layer to the short-term trend structure. Short term targets are 175.00 and 185.00 while s
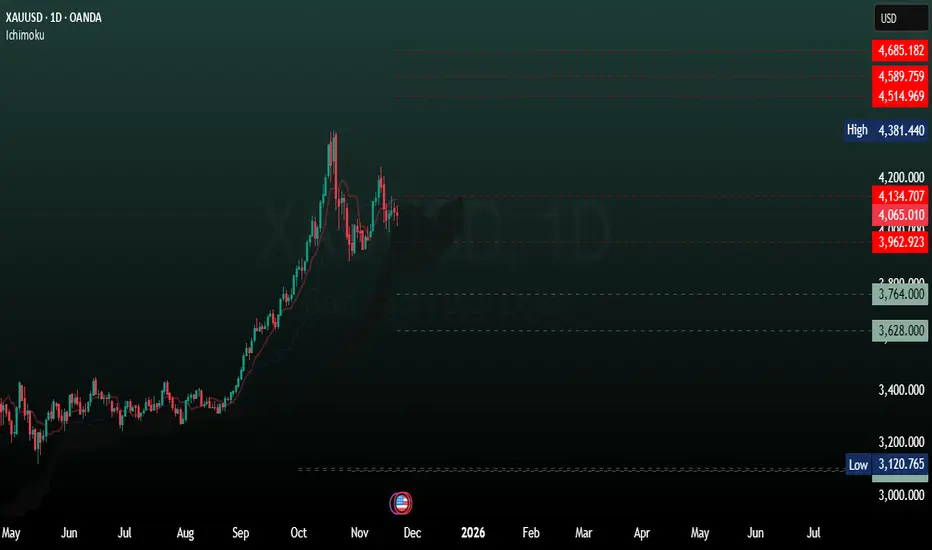
XAUUSD Daily AnalysisBased on ichimoku's data XAUUSD long-term trend is still bulish.
Xauusd is in the short-term downward trend.
if it cannot break through the support level (3962) with ichimoku elements, it will change its direction to resistence levels, but if it can, it will continue to highlighted support levels which are very important for gold and you can consider it as long-term support zones.
Long Term Bitcoin ForecastAlways early, never in doubt
I have already exited my Bitcoin related ( NASDAQ:IBIT Puts) shorts and NASDAQ:MSTR Puts. I felt confident I would be early as that that is my habit. There will undoubtably be a relief rally at some point that I may re-enter. My long term forecast is that the bull phase of the Halvening price cycle has ended and the bear phase has begun. Let's break down each price action component I am watching...
First let's take a step back to learn why we got here.
T
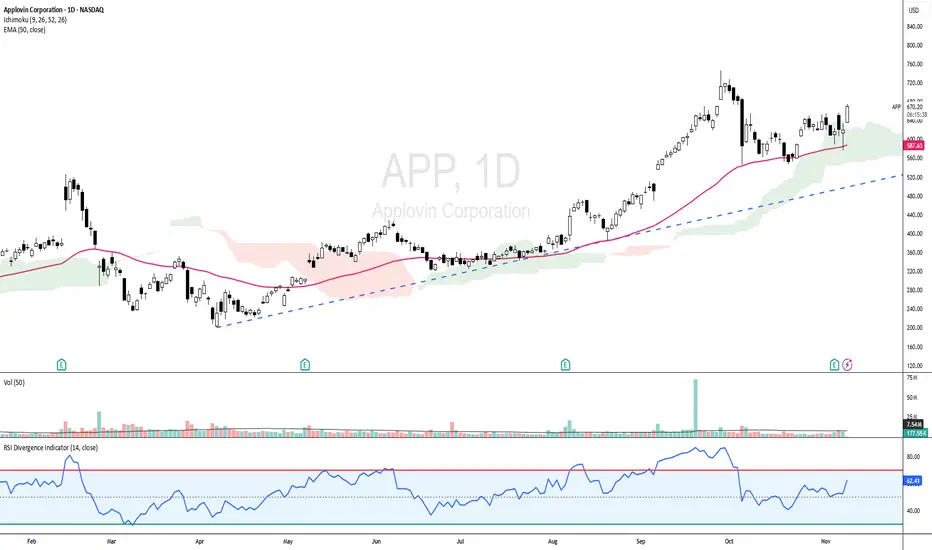
APP - UPTREND STILL INTACT!APP - CURRENT PRICE : 670.00 - 674.00
APP is showing strong bullish momentum as the price trades above the 50-day EMA and ICHIMOKU CLOUD , indicating a sustained uptrend. The RSI is in bullish territory but not yet overbought, indicating room for further upside. With the current setup, the stock has potential to retest its all-time high area if momentum continues.
ENTRY PRICE : 670.00 - 674.00
FIRST TARGET : 727.00
SECOND TARGET : 770.00
SUPPORT : 50-day EMA
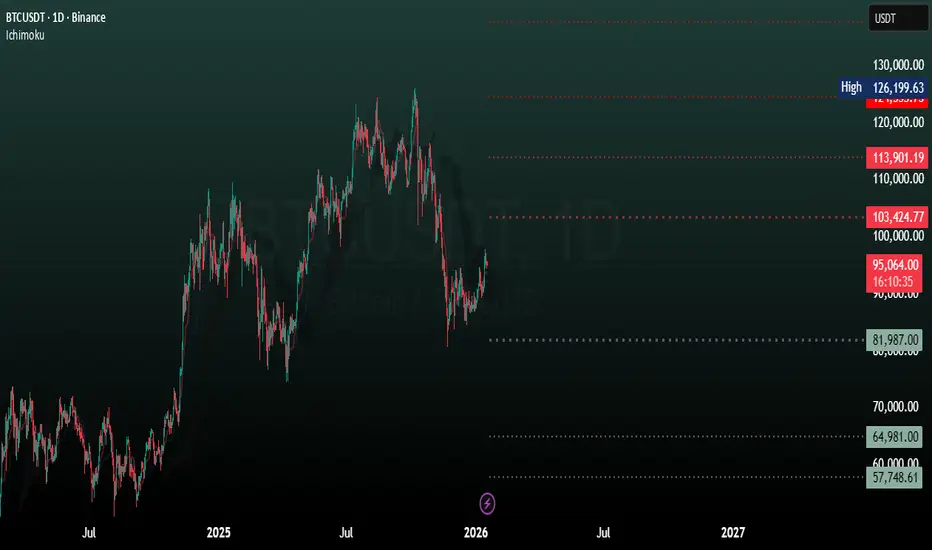
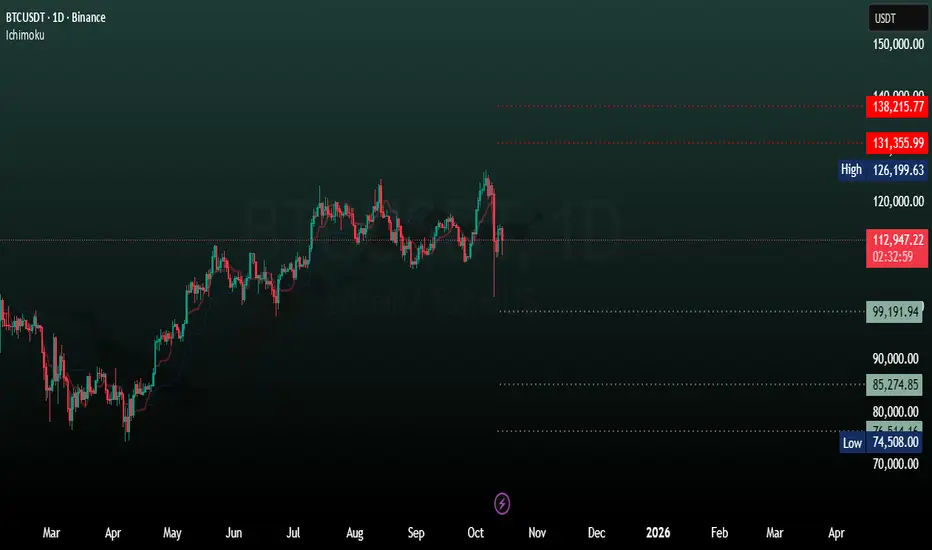
Bitcoin (BTC), End of Cycle Season Based on Cycle DurationBINANCE:BTCUSDT
Bitcoin appears to have already formed its peak within the current bullish cycle and may now be preparing for a correction.
Alternatively, if BTC makes another attempt to reach a new all-time high within October, that period could mark the final peak of this cycle.
Looking at historical data, Bitcoin has shown a repeating pattern —
an uptrend lasting approximately 3 years and 11 months (1,065 days) from the bottom,
followed by a downtrend of about 1 year (365 days) from the p
ETH Elliott Wave - WXY Correction Complete soon!This chart analyzes Ethereum (ETHUSD) at the conclusion phase of a major WXY corrective structure, highlighting the technical environment for a new impulsive wave sequence. Price action is assessed using multiple technical indicators:
Elliott Wave Structure: The chart maps a completed 1-2-3-4-5 impulse, followed by W–X–Y corrective waves. The final Y leg approaches the critical Point 4 support, maintaining overall cycle validity and setting the stage for significant trend reversal once complete
Bitcoin range: 110k defended, 111.9–114k caps the upside__________________________________________________________________________________
Market Overview
__________________________________________________________________________________
BTC is consolidating above 108.7–109.0k after the pullback from ATH, capped under 111.9–114.0k. Short-term momentum is improving while 6H/12H remain corrective.
Momentum: 📈 Neutral-to-slightly bullish above 110k, but capped by 111.9–113.5k; 6H/12H still in a corrective trend.
Key levels:
- Resistances (H