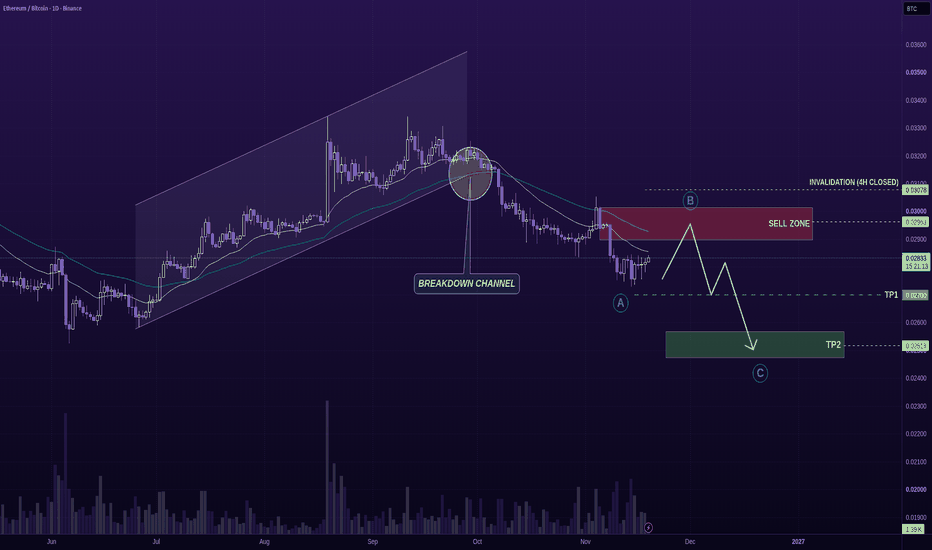
ETHBTC (1D) – ETH Is Losing Ground Against BTCEthereum's weakness is not just about its dollar price. Against Bitcoin, the previous bullish structure has also broken, raising questions about ETH's relative strength. Here's the map.
🗺️ Ethan Map
Ⓐ The structure: ETHBTC has broken below its ascending channel on the daily chart. The subsequent lower highs and declining EMA 21 and EMA 50 suggest that Ethereum continues to lose ground against Bitcoin.
Ⓑ The entry: I am watching the marked sell zone around 0.02963 BTC, where previous price s
M-pattern
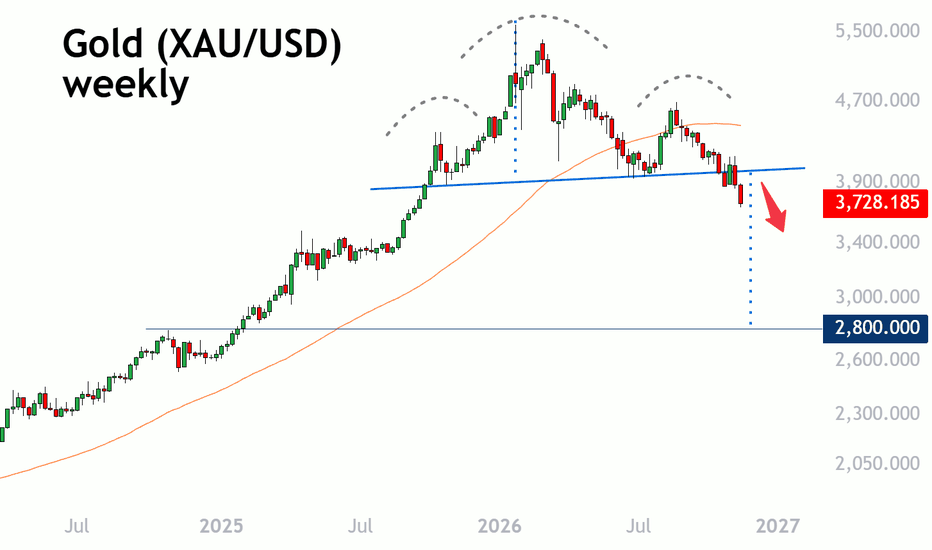
Gold Looks Ugly. Could Drop Back to $2800 /ozThe weekly chart shows gold breaking down from a large head and shoulders top.
The left shoulder formed around $4,380 in October 2025, the head at the $5,602 record in late January, and the right shoulder at $4,697 in late August. The neckline runs through the lows between roughly $3,870 and $3,960 from last October, June to July, and October this year, and this week's drop has taken the price clearly below it.
The weekly RSI held above its mid-range support throughout the bull run before brea
MDRN: Is a Reversal Finally Starting to Build? MDRN has been under significant selling pressure, maintaining a clear bearish trend. 📉
However , something interesting is developing beneath the surface , as the recent price action suggests that the bears may be starting to lose momentum .
📊 Technical Outlook
MDRN is still overall bearish , but there is an important shift developing in the way price is correcting.
Earlier in the move, the stock was forming a falling correction , which reflected strong bearish control, as sellers were
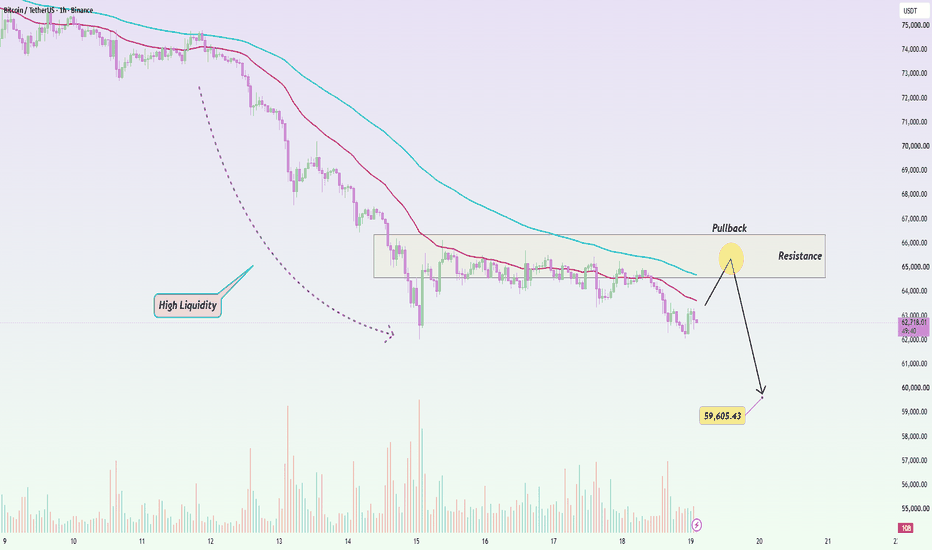
BTCUSDT: Bounce Before Drop, Bearish StructureBitcoin has failed to turn its recent consolidation into a meaningful recovery. With BTC trading around $62,894, sellers are gradually regaining momentum, leaving the market vulnerable to another leg lower.
On the 1H chart, the bearish structure remains intact, with both EMAs sloping downward and previous support turning into resistance. The breakdown from the recent consolidation has brought the $64,500–$66,300 resistance zone into focus. A temporary recovery toward $65,300 could simply repres
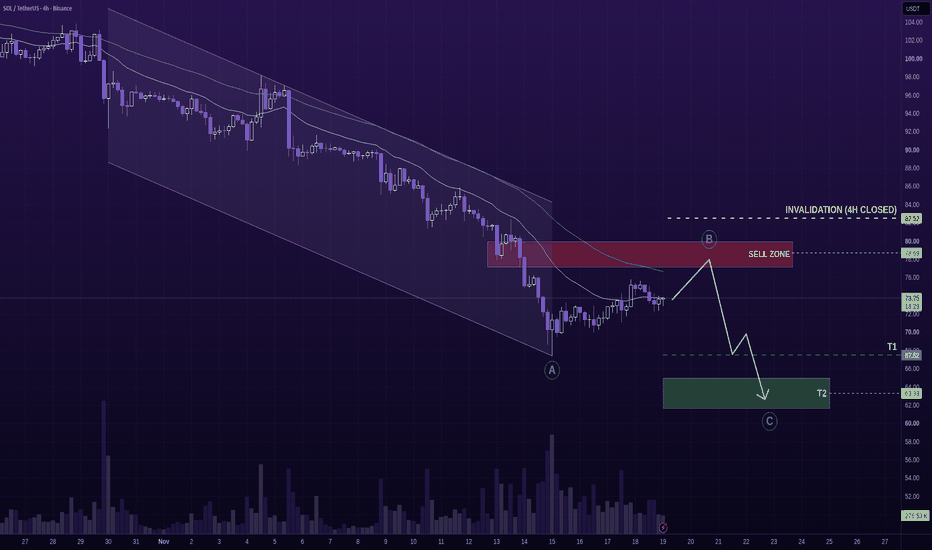
SOLUSDT (4H) – A Recovery or Just Another Lower High?Solana is recovering from its recent lows, but the bounce has yet to reverse the broader bearish structure. The real test sits higher. Here's the map.
🗺️ Ethan Map
Ⓐ The structure: SOL has been trending lower within a descending channel. The latest recovery is testing EMA 21, while EMA 50 remains overhead. Buyers have regained some ground, but a structural reversal remains unconfirmed.
Ⓑ The entry: I am watching the marked sell zone around $78.69, where previous price structure meets overhe
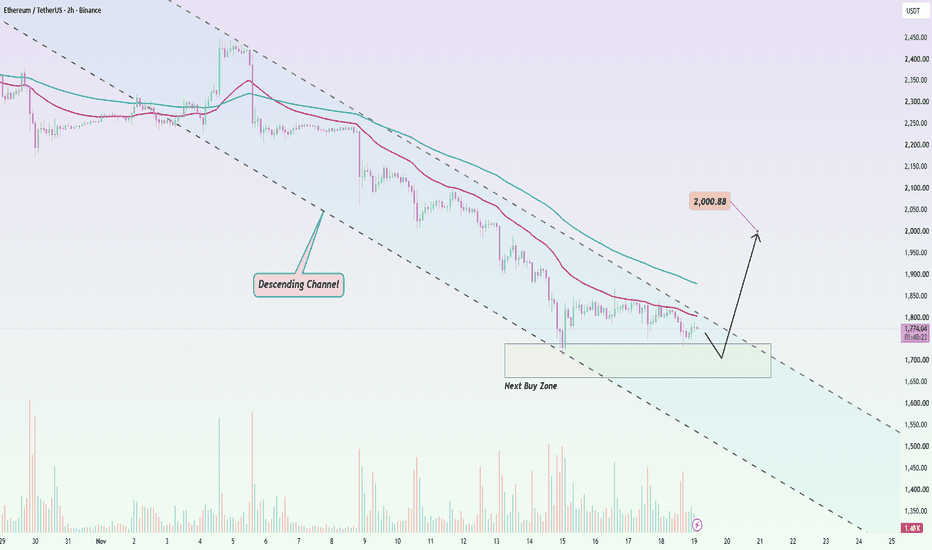
ETHUSDT: Next Buy Zone, Can Buyers Bring 2.000 BackEthereum has been under relentless selling pressure, but the current decline is approaching an area where the risk-to-reward could become more attractive for buyers. With ETH trading around $1,776, I'm watching for one final move lower before a potential recovery.
On the 2H chart, ETH remains inside a descending channel, with both EMAs maintaining their downward slope. However, the $1,660–$1,740 support zone could provide a foundation for a corrective rebound. A sweep of recent lows followed by
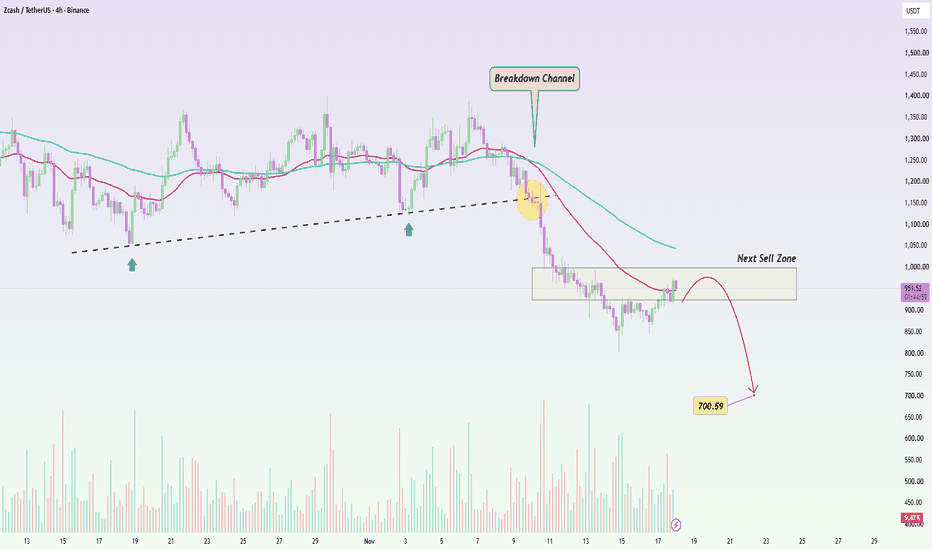
ZECUSDT: Next Downward Signal, Bears ContinueZcash is attempting to recover after a brutal selloff, but I'm not convinced this rebound will last. With ZEC trading around $948, price is approaching an important resistance area where sellers could regain control.
On the 4H chart, the breakdown below the ascending trendline marked a significant shift in market structure. What followed was a sharp decline from above $1,200 toward $850, with both EMAs turning downward. The recent recovery has now brought ZEC back into the $925–$1,000 resistanc
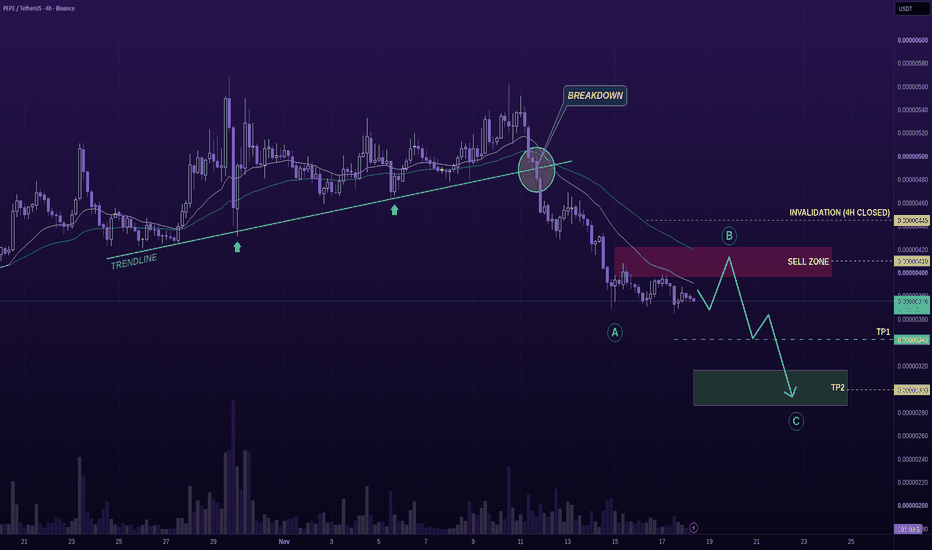
PEPEUSDT (4H) – Trendline Broken, Sellers Have the EdgePEPE's rising trendline supported several recoveries before finally breaking. The structure has shifted, and the next bounce could offer sellers another opportunity. Here's the map.
🗺️ Ethan Map
Ⓐ The structure: PEPE has broken below its ascending trendline, turning the previous bullish structure into a sequence of lower highs and lower lows. Both EMA 21 and EMA 50 remain overhead, reinforcing the bearish bias.
Ⓑ The entry: I am watching the marked sell zone around $0.00000410, where previo
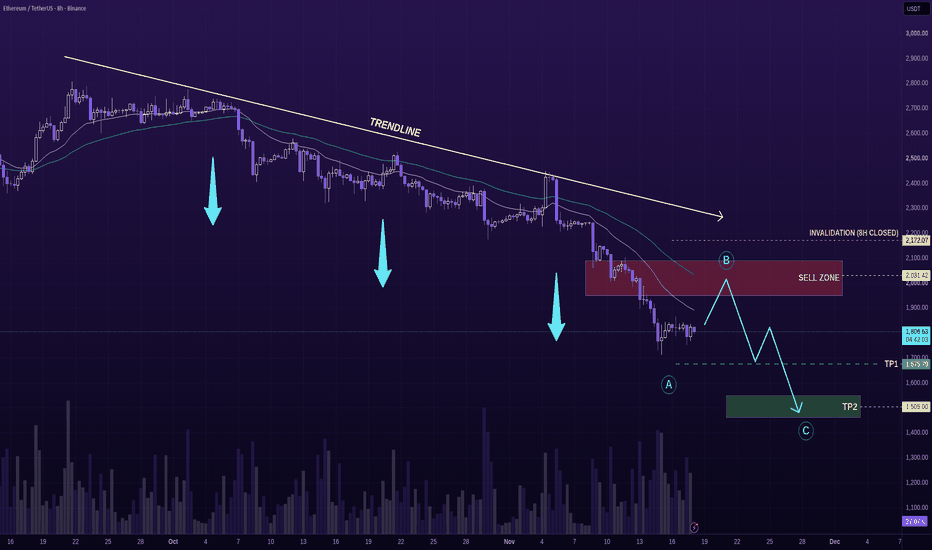
ETHUSDT (8H) – Bulls Pressure, Downside Signal SessionEthereum keeps falling, but the most interesting part of this chart is not the latest drop. It's how every recovery has failed beneath the same descending trendline. Here's the map.
🗺️ Ethan Map
Ⓐ The structure: ETH continues to form lower highs and lower lows on the 8H chart. The descending trendline has repeatedly limited recoveries, while EMA 21 and EMA 50 remain above price. Sellers still control the broader structure.
Ⓑ The entry: I am watching the marked sell zone around $2,031.42. A
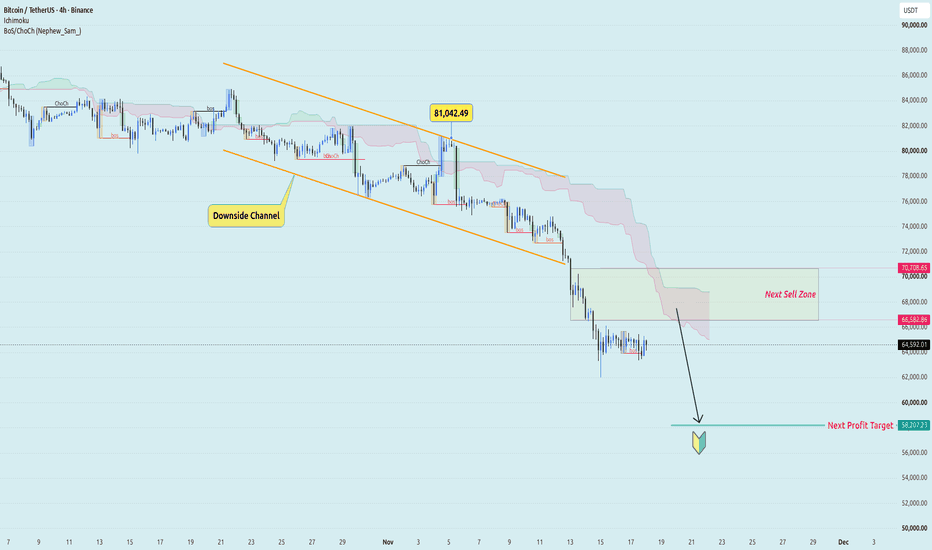
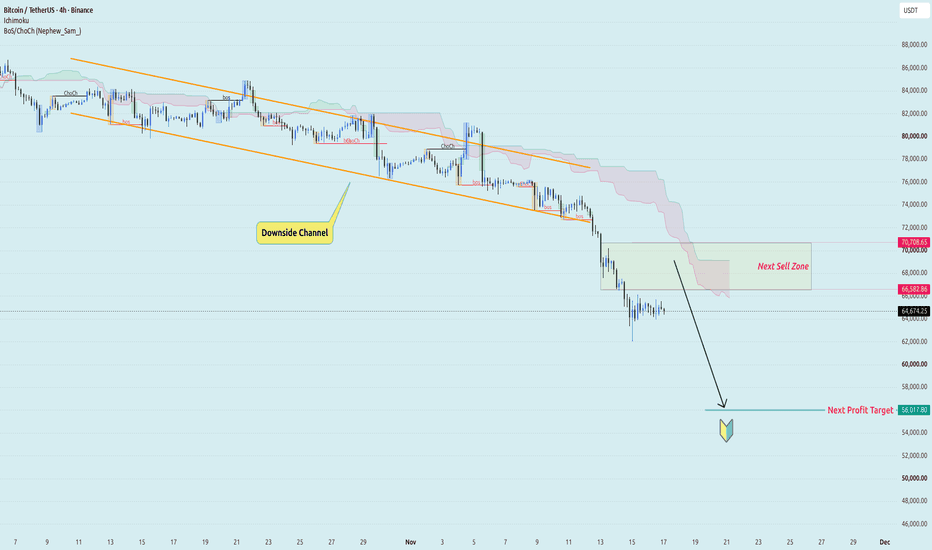
BTC/USDT – Broken Channel, Sellers Eye 58K🟠 BINANCE:BTCUSDT has broken below its descending channel on the H4 chart, extending the selloff toward $64,448. The repeated bearish structure breaks tell a clear story: each recovery has been weaker than the last, and buyers are still struggling to defend previous support.
The area I'm watching is $66,583–$70,709. This former support zone now sits beneath the Ichimoku cloud, making it an important test for any recovery. If Bitcoin rebounds into this region but fails to reclaim it, another
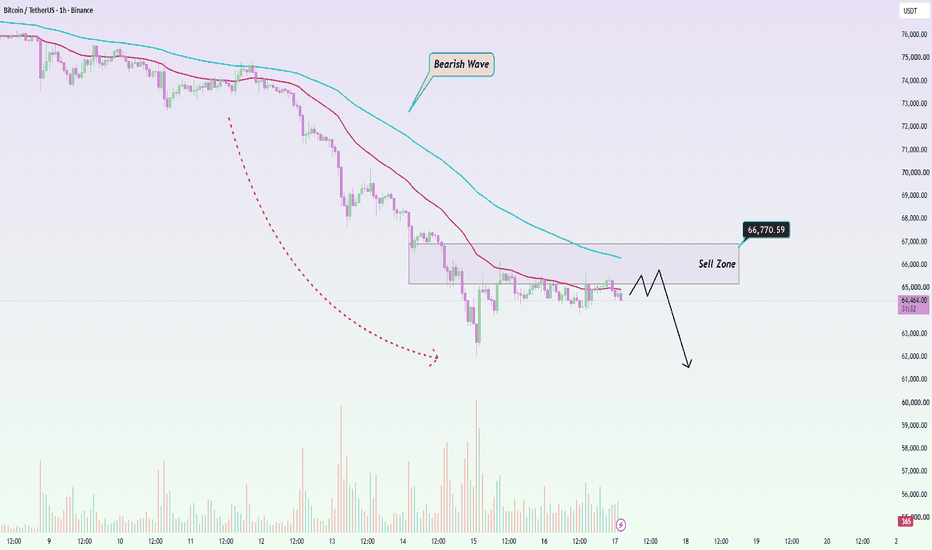
BTCUSDT: Stuck Below 65K, Next Bouncing SignalBitcoin has stopped falling for the moment, but that doesn't mean the selling is over. After a sharp decline, BTC is consolidating around $64,600, and I still see little evidence that buyers are ready to reverse the broader trend.
Looking at the 1H chart, the bearish structure remains clear. Price continues to trade beneath both declining EMAs, with recent recovery attempts failing to gain momentum. The $65,000–$66,770 resistance zone is particularly important, as it overlaps with previous pric
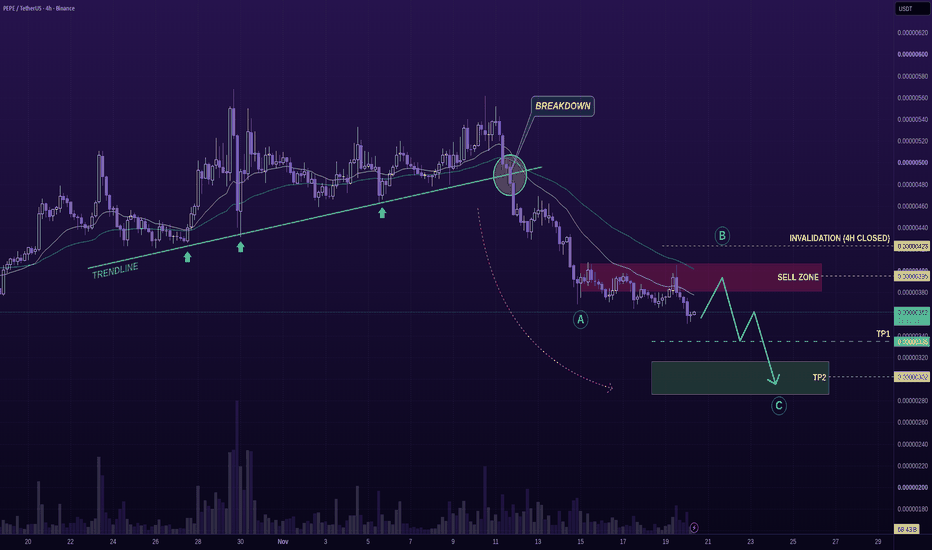
PEPEUSDT (4H) – Broken Trendline, Fading RecoveryPEPE's rising trendline once supported multiple recoveries. Since the breakdown, buyers have struggled to rebuild momentum, and every bounce remains vulnerable to selling pressure. Here's the map.
🗺️ Ethan Map
Ⓐ The structure: PEPE has broken below its ascending trendline and developed a sequence of lower highs and lower lows. Both EMA 21 and EMA 50 remain overhead, reinforcing the bearish structure.
Ⓑ The entry: I am watching the marked sell zone around $0.00000395, where previous consolid
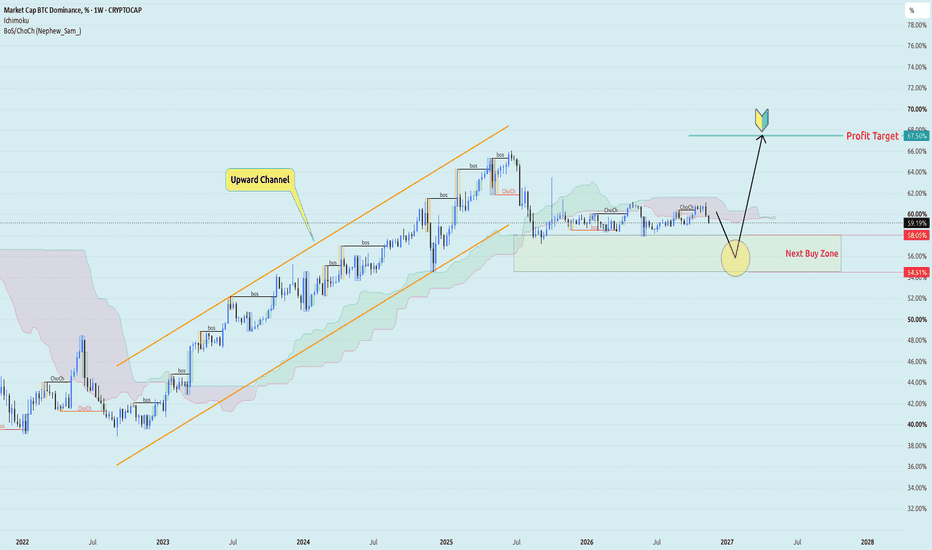
BTC.D – Altcoin Rally Before Bitcoin Dominance Hits 67.5%?🟠 CRYPTOCAP:BTC.D is entering an interesting phase on the Weekly chart. Following its prolonged expansion within an ascending channel throughout 2023–2025, BTC.D has entered a broader consolidation phase around 59.20%.
I'm watching the 54.51%–58.05% support zone as the next potential turning point. A corrective move into this region could temporarily allow Altcoins to outperform Bitcoin. However, if dominance establishes support and resumes its bullish structure, that opportunity may not las
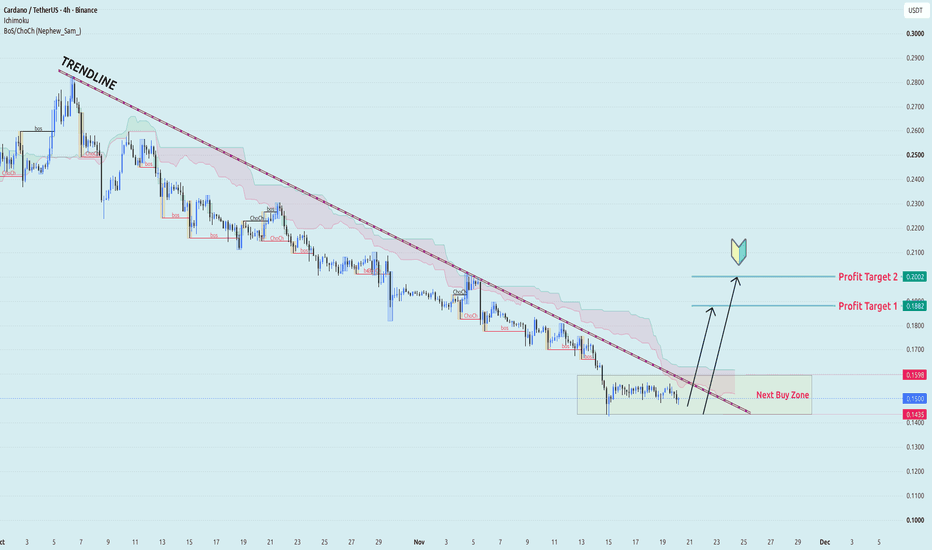
ADA/USDT – Cardano Preparing a Recovery Toward 0.20🔵 BINANCE:ADAUSDT has experienced a prolonged decline on the H4 chart, with successive lower highs and bearish BOS signals defining the dominant trend. However, price is now consolidating near $0.1494 while the descending trendline continues to compress the available trading range.
I'm watching the $0.1435–$0.1598 buy zone. The recent consolidation suggests that bearish momentum may be slowing, but buyers still need to demonstrate strength. A bullish CHoCH, followed by a confirmed breakout a
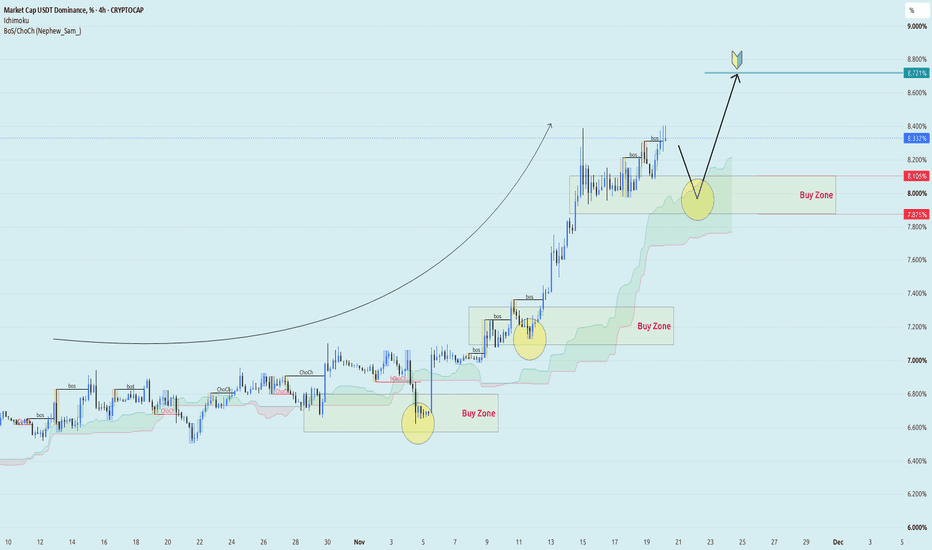
USDT.D – The Road to 8.72% Trouble for Crypto🟢 CRYPTOCAP:USDT.D continues to strengthen on the H4 chart, with successive higher highs, higher lows and bullish BOS signals. Previous pullbacks have found support at progressively higher levels, while the rising Ichimoku cloud reinforces the bullish structure.
With dominance reaching 8.332%, I'm watching the 7.875%–8.105% support zone for the next corrective pullback. If this area holds and bullish momentum returns, another expansion toward higher dominance levels could develop.
Market C
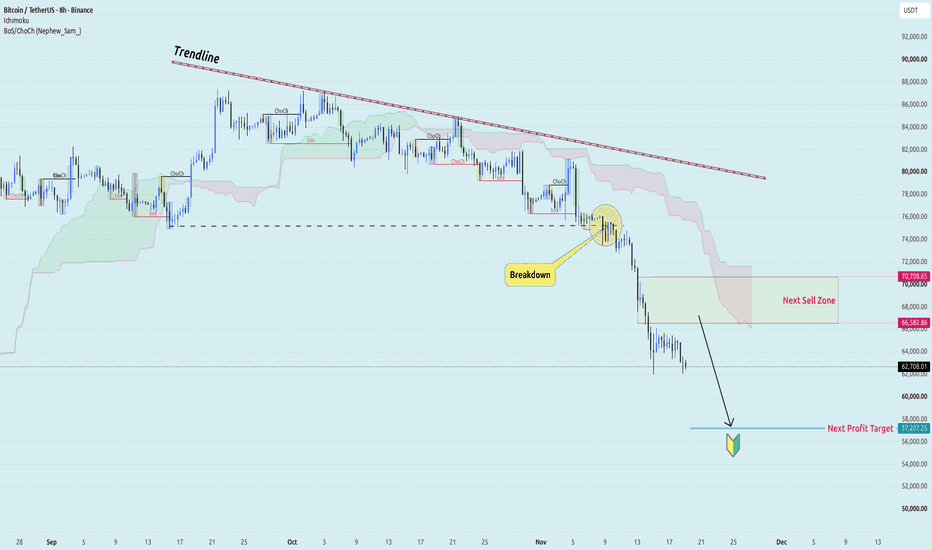
BTC/USDT – Breakdown Leaves 57K Exposed🟠 BINANCE:BTCUSDT continues to deteriorate on the H8 chart. The breakdown below $75,000 marked a significant shift in market structure, accelerating the decline toward $62,694. Successive lower highs, bearish BOS signals and the descending Ichimoku cloud suggest that sellers still hold the technical advantage.
I'm now watching the $66,583–$70,709 sell zone. Bitcoin may attempt a corrective rebound after the recent selloff, but unless buyers reclaim this resistance, such a recovery could simp
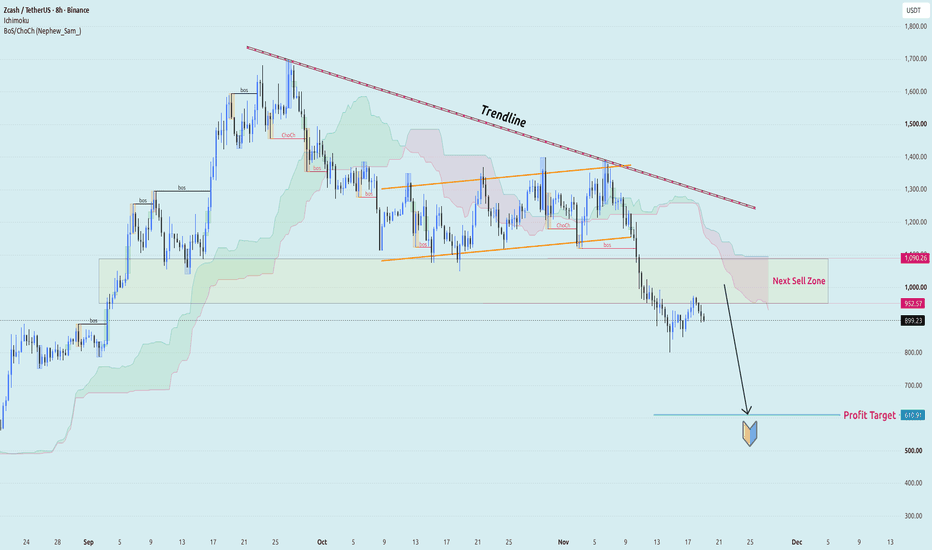
ZECUSDT – Failed Recovery Leaves Wave Downside🟡 BINANCE:ZECUSDT remains structurally bearish on the H8 chart. The attempt to recover within a short-term ascending channel ultimately failed beneath the major descending trendline. Once the channel support gave way, selling accelerated, pushing ZEC below $900 and beneath the Ichimoku cloud.
The recent rebound has already encountered resistance near $952.57–$1,090.26. This former support area is now the key selling region. Another failed attempt to reclaim it could set the stage for a deepe
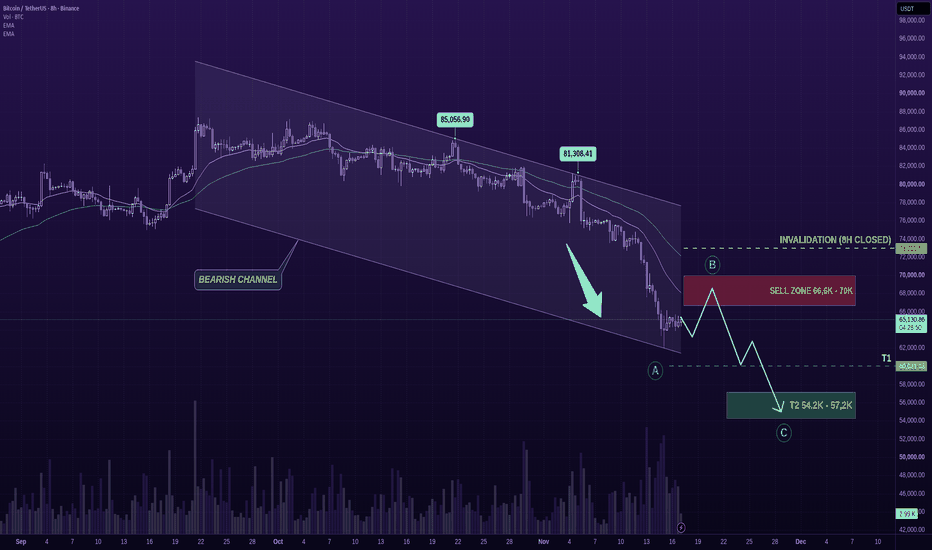
BTCUSDT (8H) – The Next Bounce Is the Real TestBitcoin has broken below $66.6K, but I am not interested in chasing another red candle. After this selloff, the next recovery could offer a much clearer opportunity. Here's the map.
🗺️ Ethan Map
Ⓐ The structure: BTC continues to respect its descending channel on the 8H chart. The lower highs at $85,056.90 and $81,308.41 show how each recovery has lost strength. Price remains below EMA 21 and EMA 50, while the former $66.6K floor has now been broken.
Ⓑ The entry: I am watching $66,600–$70,00
BTC/USDT – Breakdown Opens Door to 56K🟠 BINANCE:BTCUSDT has moved beyond a routine correction. On the H4 chart, Bitcoin has broken below its descending channel after repeatedly losing support and forming lower highs. Price is now hovering around $64,620, with little evidence that buyers have regained control.
What interests me is the $66,583–$70,709 resistance zone. This area previously supported price, but the breakdown has changed its role. If BTC rebounds into this region and fails to hold above it, I expect sellers to return
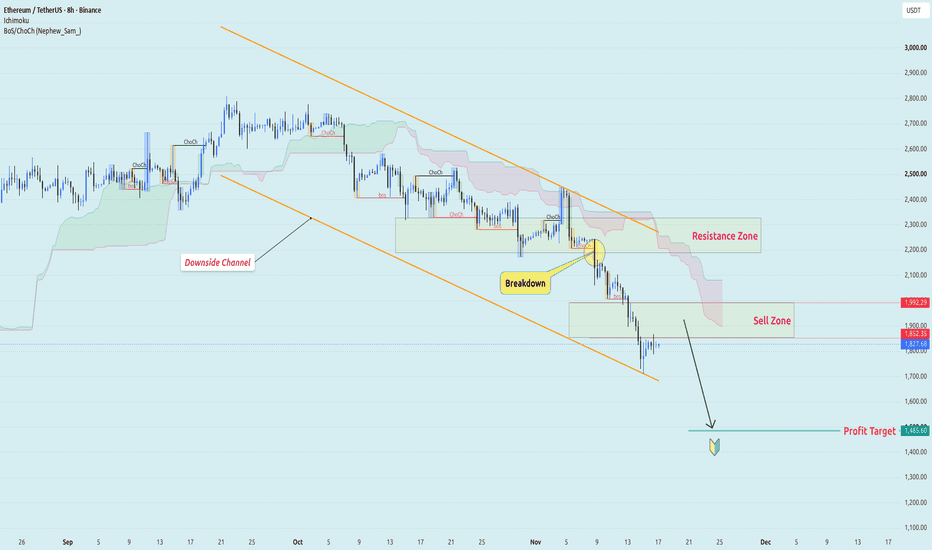
ETHUSDT – Losing Price Opens the Path Toward 1,485🟣 BINANCE:ETHUSDT is struggling to find a floor after another sharp decline. On the H8 chart, the series of lower highs and repeated bearish structure breaks has pushed Ethereum below $1,852, leaving price around $1,820 and firmly beneath the Ichimoku cloud. The descending channel continues to guide the broader bearish trend.
The breakdown around $2,190 was particularly important. Buyers failed to reclaim that level, and the subsequent decline erased another layer of support. I'm now watchin
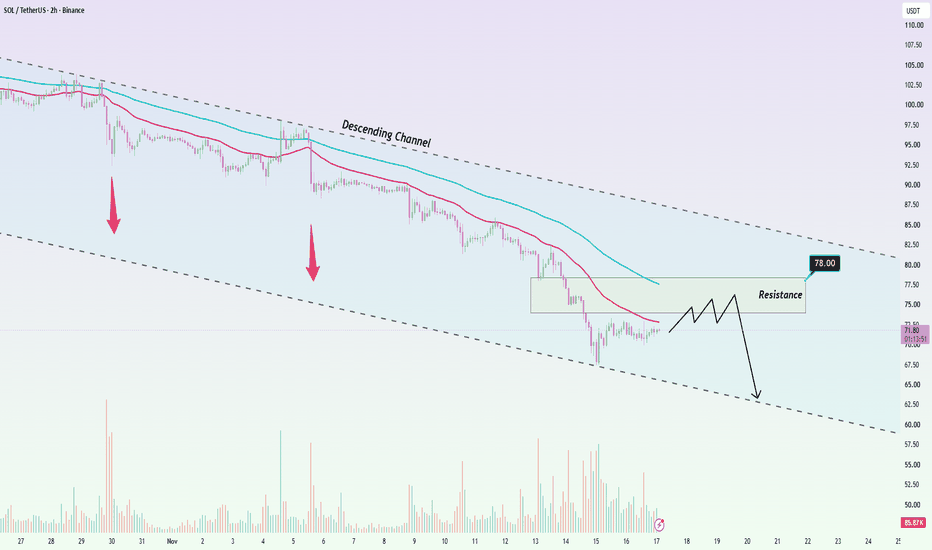
SOLUSDT: Recovery Looks Fragile — $63 Be Next?Solana has been losing ground for weeks, and the latest price action gives me little reason to expect a sustained recovery. With SOL trading around $71.78, I believe the market remains firmly in the hands of sellers, despite signs of short-term stabilization.
The 2H chart tells the story clearly. SOL continues moving inside a well-defined descending channel, with successive lower highs and both EMAs trending downward. The recent rebound from the $67–$68 area has struggled to gain momentum, sugg
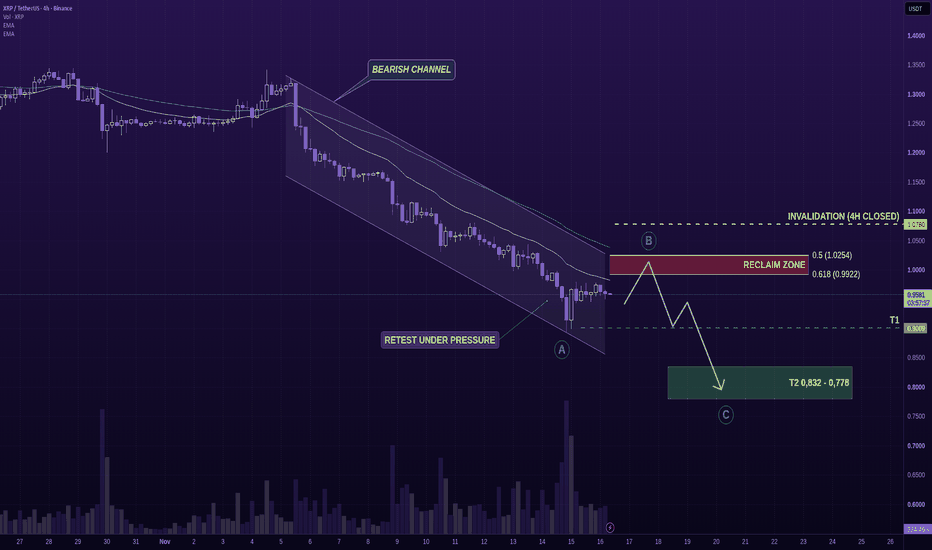
XRPUSDT 4H – Reclaim Inside Bearish ChannelXRP has lost the $1 level, but selling another breakdown near the lows is not the setup I want. The next recovery could tell us much more about who controls this market. Here's the map.
🗺️ Ethan Map
Ⓐ The structure: XRP remains inside a descending channel on the 4H chart, with lower highs and lower lows keeping sellers in control. Both EMA 21 and EMA 50 remain overhead, while the recent bounce has yet to change the bearish structure.
Ⓑ The entry: The key area is $0.9922–$1.0254, where Fibon
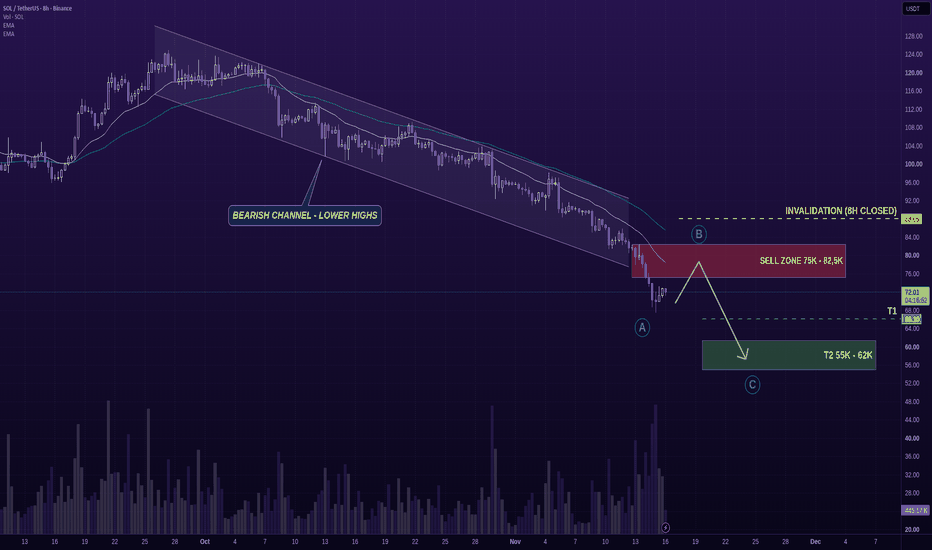
SOLUSDT (8H) – Next Bounce Be a Selling OpportunitySolana has fallen sharply, but the bigger question is whether the next recovery can break the bearish structure. For now, sellers still have the advantage. Here's the map.
🗺️ Ethan Map
Ⓐ SOL remains inside a broader bearish channel, with lower highs and lower lows defining the 8H trend. Price is trading below both EMA 21 and EMA 50, showing that buyers have yet to regain control.
Ⓑ I am watching the $75–$82.50 sell zone. Rather than chasing the decline near $72, I prefer waiting for a recov
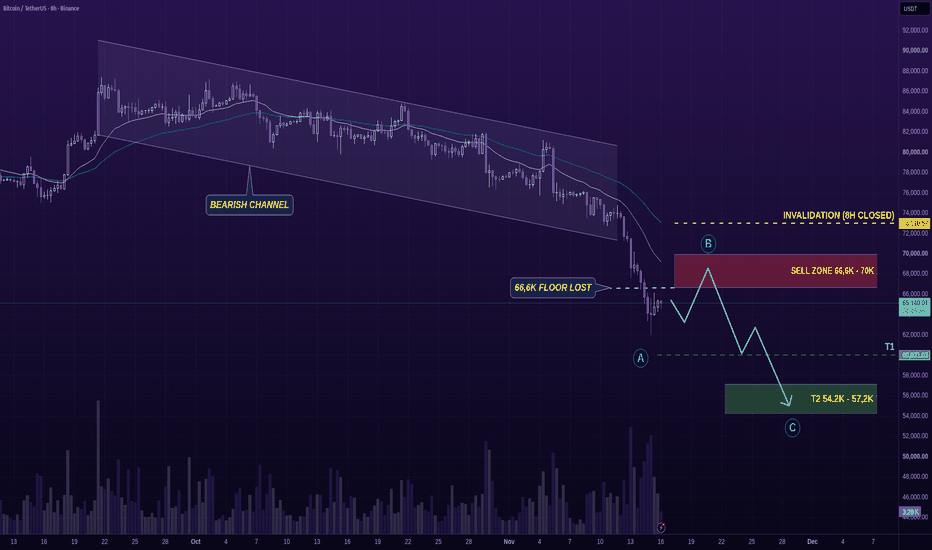
BTCUSDT (8H) – The Broken Floor Changes WaveBitcoin has lost another important floor, and the latest selloff has pushed price below $66.6K. But after such an aggressive decline, I am more interested in the next failed recovery than another red candle. Here's the map.
🗺️ Ethan Map
Ⓐ The structure: BTC remains under pressure inside its broader descending channel on the 8H chart. Lower highs continue to define the trend, while EMA 21 and EMA 50 are both overhead.
The loss of $66.6K is particularly important. A level that previously attr