Long
Long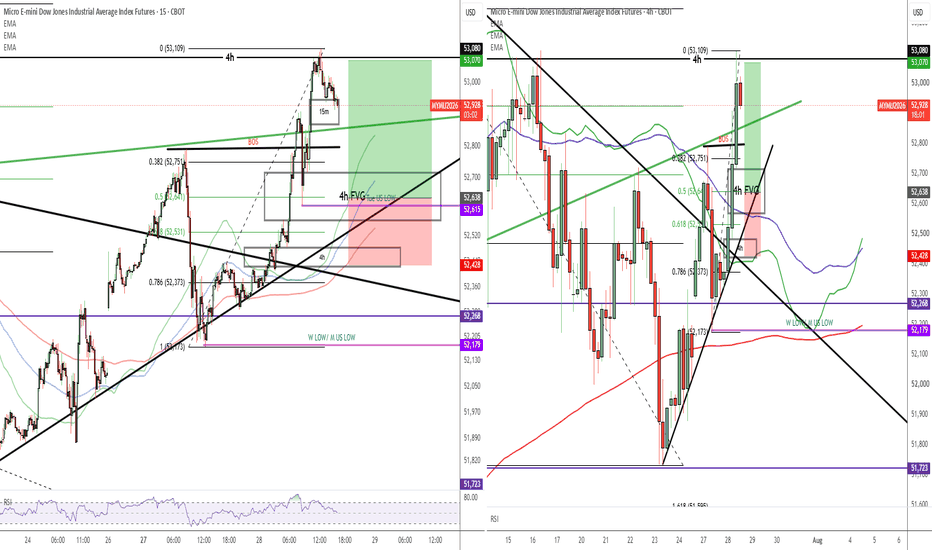
ZKH: China’s Largest MRO platform has turned profitable - July26And nobody is watching...
SYMBOL: NYSE:ZKH | DIRECTION: LONG | TIMEFRAME: Weekly
Published: July 2026
** Attention span greater than 5 minutes required, you were warned **
ZKH Group is China’s dominant B2B industrial supplies marketplace. It serves more than 70,000 transacting customers across manufacturing, infrastructure, and industrial maintenance through a platform that stocks millions of SKUs. It has grown its customer base by 85.6% in a single year, turned quarterly profitable for the first time, and is accelerating revenue growth in 2026. The stock trades at $3. It IPO’d at $12, peaked at $22.
The market has been watching the share price. The fundamentals have been going in the opposite direction. That divergence is the setup.
On the above weekly chart ZKH has broken out of a descending price channel while the RSI simultaneously breaks above its own descending channel, confirming a momentum shift. Five fundamental reasons now exist to be long from current levels. They include:
1) Profitability inflection confirmed. ZKH returned to quarterly profitability in Q4 2025, posting a net profit of RMB 4.8 million and non-GAAP adjusted net profit of RMB 14.9 million, against a loss of RMB 50 million in Q4 2024. Full-year 2025 net loss narrowed by 47.8% to RMB 139.7 million. Operating expenses fell 8.7% for the full year while revenues grew. This is the operating leverage of a platform business beginning to work as the model scales. The company guided for quarterly profitability in Q4 2025 and delivered. That is not nothing.
2) Revenue growth accelerating in 2026. Q1 2026 net revenues came in at RMB 2,113.8 million (US$306.4 million), up 9.2% year on year. That is the highest quarterly year-on-year revenue growth in recent quarters, and the second consecutive quarter of acceleration. Full-year 2025 revenues were RMB 8,987.7 million, approximately US$1.24 billion. A business generating more than a billion dollars in revenue, with growth reaccelerating, trading at under $4 per share is an unusual combination. The market has not yet reconciled those two facts.
3) Customer base growing at a rate that defies the share price. ZKH grew its customer base by 85.6% year on year in fiscal 2025. Transacting customers exceeded 70,000, a new quarterly high as of Q3 2025. In platform businesses, the customer base is the leading indicator. Revenue per customer, cross-selling depth, and retention all compound from a growing base. When customers grow at 85% while the share price sits at a three-year low, one of those two numbers is wrong. History is fairly clear on which one it tends to be.
4) AI is doing two things simultaneously : cutting costs and generating revenue. ZKH’s proprietary Expert Linglong AI model delivered a 42% year-on-year increase in customer service productivity and a 52% increase in procurement productivity. That is the cost side. On the revenue side, the ProductRecom Agent generated over RMB 200 million in sales in 2025 and is scaling further in 2026. Most companies describe AI as a cost efficiency tool. ZKH has made it a revenue line. The combination of a falling cost structure and an AI-native revenue contribution is a margin story that the current share price has not priced in.
5) The TAM is enormous and digital penetration is still in its early stages. China’s total industrial MRO procurement market was RMB 3.6 trillion in 2025, growing to an estimated RMB 4.42 trillion by 2030. Digital and intelligent procurement accounts for approximately 12.3% of that market today, expected to reach 16.6% by 2030. ZKH’s GMV of RMB 10.1 billion represents less than 0.3% of the total addressable market. The company that is already the market leader in digital MRO procurement in China, with proprietary AI and the largest platform, holds less than a third of one percent of the market it will spend the next decade claiming. The distance between where ZKH is and where the opportunity sits is the investment thesis.
One caveat worth stating plainly
ZKH is a Chinese company listed on NYSE as an ADR. That structure carries regulatory and geopolitical risk that is not present in a domestic listing. US-China market friction, potential delistings, and VIE structure considerations are real risks. The chart also shows a Hidden Bear signal, rated WEAK, at current levels. It has not invalidated the breakout, but it warrants monitoring. Position sizing should reflect both the asymmetric upside and the binary risks that come with a Chinese ADR in the current environment.
Targets
• 1st target: $5.50. Resistance from the 2024 - 2025 consolidation range high.
• 2nd target: $8.00. Mid-range recovery to the post-crash consolidation zone from early 2024.
• 3rd target: $13.00. Approaching the original IPO price range. A full fundamental re-rating as profitability matures.
A weekly close back below $3.20 invalidates the breakout and requires reassessment.
The crowd
The crowd abandoned this one. The 2023 IPO disappointed, the share price collapsed 80%, and Chinese ADRs have been broadly out of favour. Retail investors who bought the IPO at $12 and watched it go to $3 do not want to look at it. Institutional investors who missed the original story have moved on. The result is a company with $1.24 billion in revenue, 85% customer growth, a proprietary AI stack, and a confirmed profitability quarter, sitting at a price that implies the market no longer believes the story.
The market is often right to abandon a story that has not worked. It is occasionally wrong about when. ZKH is not the same company it was at the IPO. The revenue base has grown, the cost structure has been cut, the AI has been built, and the customer base has nearly doubled in a year. The question is not whether the story was oversold at $12. It clearly was. The question is whether it is undersold at $3. The fundamentals say yes. The chart has just agreed.
Good luck.
Ww
Type: Fundamental long / Chinese ADR | Timeframe: 12–24 months
==================================================
Disclaimer : This idea is for educational and informational purposes only. It is not financial advice. ZKH Group Limited is a Chinese company listed on NYSE as an American Depositary Receipt (ADR) and operates under a VIE structure. Investing in Chinese ADRs carries additional risks including regulatory risk, geopolitical risk, potential delisting risk, and currency risk, which may not apply to domestic equity investments. All financial figures are sourced from ZKH Group’s publicly filed reports and press releases. Always do your own research and consult a qualified financial adviser before making any investment decisions. Past performance is not indicative of future results.
 Long
Long
Is Wave 3 Beginning, or Is One More Zigzag Still Ahead?Crude Oil (UKOIL) | 4H Elliott Wave Update
From an Elliott Wave perspective, Waves I and II of the current degree appear to be complete.
Wave I developed as an Impulse, ending with signs of a possible truncation, while Wave II unfolded as an Expanded Flat, which now appears to be complete.
The focus now shifts to the current price action and the character of the developing structure.
From the recent low, the initial rally can be counted as a clear five-wave Impulse, suggesting that Wave 1 of a new bullish sequence may already be in place.
The correction highlighted by the red ellipse is particularly interesting. Structurally, it appears to be a sharp correction belonging to the Zigzag family, which leaves two primary scenarios on the table.
The first scenario is that this correction has already completed Wave 2, allowing the market to extend directly into Wave 3. If this count is correct, a breakout above the corrective channel and the nearby structural resistance would provide the first meaningful confirmation that bullish momentum is expanding.
The second scenario is that the current decline represents only the first stage of a larger corrective pattern. In that case, the market could still develop a larger Zigzag before the next impulsive advance begins. Such a move would remain consistent with Elliott Wave guidelines and would not necessarily invalidate the broader bullish outlook.
At this stage, both interpretations remain valid. The market itself—not our expectations—will determine which structure is unfolding.
If, however, both key invalidation levels are broken, greater attention should shift toward the Conservative Scenario presented in my previous Daily analysis.
Under that interpretation, the current structure may represent only Waves (I) and (II) of a larger degree, meaning the market could still require a deeper correction before the primary bullish cycle resumes.
For readers who have followed my previous long-term Crude Oil analysis, this is the same black Conservative Scenario discussed there, and it remains fully valid until proven otherwise.
At this stage, the objective is not to predict the future with certainty.
The objective is to identify the structures that remain valid, respect the key invalidation levels, and allow price action to reveal the true character of the next market move.
As always, price comes first—our wave count comes second.
Patterns whisper. I listen.
— Mr. Nobody 🎧📊
CFDs on Crude Oil (WTI)
Jul 14
Reading the Character of the Next Market Cycle
 Long
Long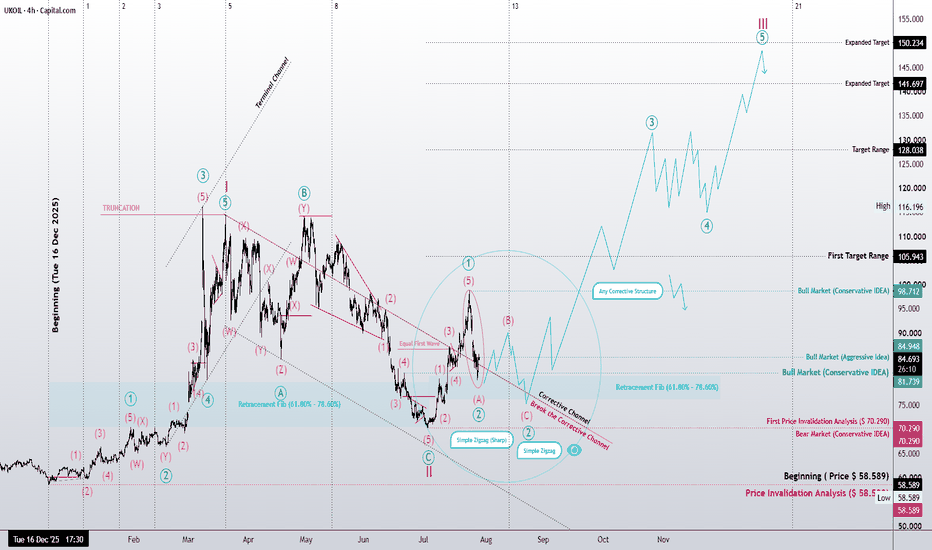
XAU/USD 29 July 2026 Intraday AnalysisH4 Analysis:
-> Swing: Bullish.
-> Internal: Bearish.
Bias and analysis to remain the same as analysis dated 30 June 2026.
Price did not print bullish CHoCH to indicate bullish pullback phase initiation. Price instead printed a new low followed by a bullish CHoCH
Price is currently trading within and established internal range, however, I will continue to monitor price with respect to depth of pullback.
Intraday expectation:
Price to trade up to either premium of internal 50% EQ, or H4 demand zone before targeting weak internal low, currently priced at 3,942.100.
Note:
Gold remains volatile as tensions between the US, Israel, and Iran keep safe‑haven demand elevated.
Markets are reacting quickly to every headline, while uncertainty around the Fed’s easing path and shifting U.S. policy under President Trump, especially tariffs continues to fuel choppy price action.
For newer traders, the key is simple, stay flexible and manage risk carefully, as fast spikes and sudden reversals are a normal part of the current XAU/USD environment.
H4 Chart:
M15 Analysis:
-> Swing: Bearish.
-> Internal: Bearish.
Analysis and bias remains the same as analysis dated 20 July 2026.
Price has printed according to analysis dated 14 July 2026 where I mentioned price to trade up to either premium of internal 50% EQ, or M15 demand zone before targeting weak internal low, priced at 3,983.545. This is how price printed.
Price has subsequently printed a bullish CHoCH to indicate bullish pullback phase initiation. Price has since printed lower. Depth of pullback has been insignificant, therefore, I will not classify the bearish iBOS, however, I have marked this in red for illustration purposes.
Price has since printed a further bullish CHoCH and once again price is trading within an established internal range, however, I shall again monitor price action with regards to depth of pullback.
Intraday expectation:
Price to trade up to either premium of internal 50% EQ, or M15 demand zone before targeting weak internal low, priced at 3,959.800.
Note:
Gold remains highly reactive on M15 as geopolitical risk continues to drive quick, headline‑led moves.
The tension between the US, Israel, and Iran is keeping safe‑haven demand elevated, with markets still sensitive to any sign of escalation.
At the same time, shifting US tariff policy under President Trump is adding extra uncertainty, fuelling sharp intraday swings and increasing the likelihood of sudden sentiment flips. Liquidity pockets and whipsaws remain common, making disciplined risk management essential.
Gold’s geopolitical premium is still firmly in place, and until tensions ease, short‑term volatility is likely to stay front‑loaded.
M15 Chart:  Long
Long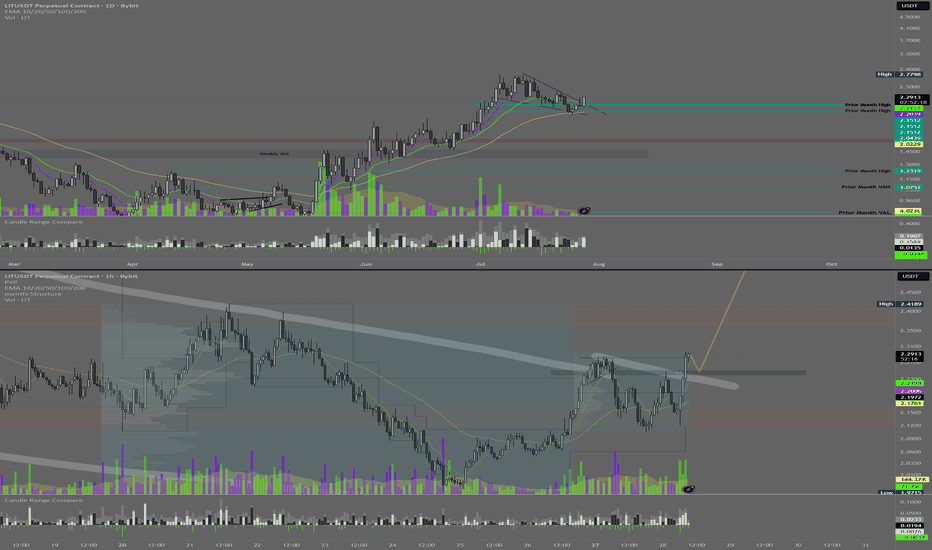
ONDOUSDT | Daily Reversal, 4H Compression Into Supply
⚛️ ONDO has put in a strong reversal from the July lows, reclaimed its key EMA structure, and is now holding above the 10/20/50 on the Daily. The trend quality has improved substantially, but price is now pressing into a clear descending supply zone, so this is the decision point.
On the 4H, price has been building a higher base above the 10/20/50 cluster after the initial expansion. That is constructive. The setup becomes actionable only if ONDO can break through the descending resistance and show acceptance above it.
🟢 Continuation Scenario
A clean 4H close and hold above the 0.411 to 0.414 supply area would put the recent local high near 0.4255 in play. Clearing that level with participation would confirm the next leg of the Daily reversal.
The ideal look is a break, a tight retest that holds above the broken trendline, then continuation. No need to chase directly into supply.
🔴 Failure Scenario
If ONDO rejects here and loses the 4H EMA cluster around 0.3962 to 0.3946, it likely rotates back toward 0.3882. A deeper loss of that support would invalidate the clean higher-low structure and turn this back into a broader range.
This is a good example of why location matters. Daily structure is improving, but price still has to prove it can absorb overhead supply.
Location → Compression → Confirmation.
Not a signal. Just how I’m reading structure and participation.  Long
Long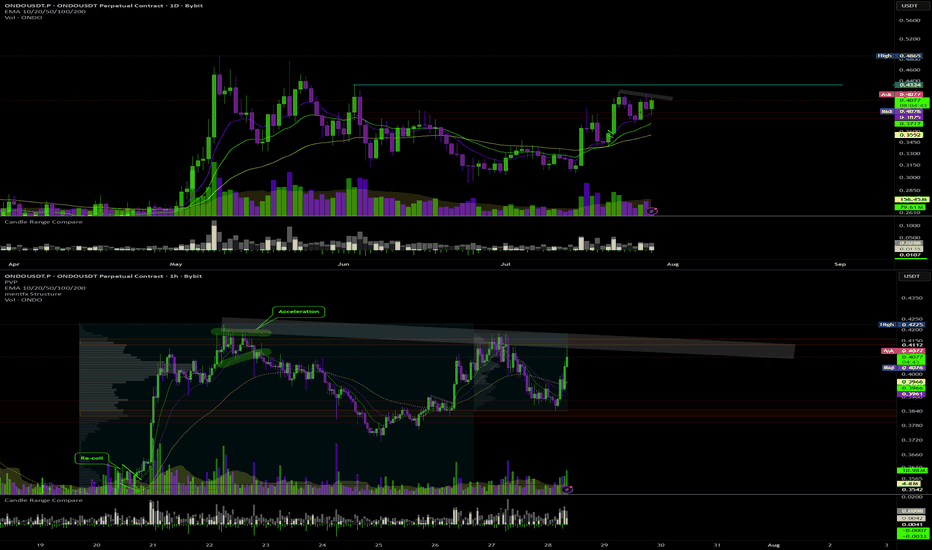
 Long
Long
 Short
Short
XAU/USD 28 July 2026 Intraday AnalysisH4 Chart:
-> Swing: Bullish.
-> Internal: Bearish.
Bias and analysis to remain the same as analysis dated 30 June 2026.
Price did not print bullish CHoCH to indicate bullish pullback phase initiation. Price instead printed a new low followed by a bullish CHoCH
Price is currently trading within and established internal range, however, I will continue to monitor price with respect to depth of pullback.
Intraday expectation:
Price to trade up to either premium of internal 50% EQ, or H4 demand zone before targeting weak internal low, currently priced at 3,942.100.
Note:
Gold remains volatile as tensions between the US, Israel, and Iran keep safe‑haven demand elevated.
Markets are reacting quickly to every headline, while uncertainty around the Fed’s easing path and shifting U.S. policy under President Trump, especially tariffs continues to fuel choppy price action.
For newer traders, the key is simple, stay flexible and manage risk carefully, as fast spikes and sudden reversals are a normal part of the current XAU/USD environment.
H4 Chart:
M15 Analysis:
-> Swing: Bearish.
-> Internal: Bearish.
Analysis and bias remains the same as analysis dated 20 July 2026.
Price has printed according to analysis dated 14 July 2026 where I mentioned price to trade up to either premium of internal 50% EQ, or M15 demand zone before targeting weak internal low, priced at 3,983.545. This is how price printed.
Price has subsequently printed a bullish CHoCH to indicate bullish pullback phase initiation. Price has since printed lower. Depth of pullback has been insignificant, therefore, I will not classify the bearish iBOS, however, I have marked this in red for illustration purposes.
Price has since printed a further bullish CHoCH and once again price is trading within an established internal range, however, I shall again monitor price action with regards to depth of pullback.
Intraday expectation:
Price to trade up to either premium of internal 50% EQ, or M15 demand zone before targeting weak internal low, priced at 3,959.800.
Note:
Gold remains highly reactive on M15 as geopolitical risk continues to drive quick, headline‑led moves.
The tension between the US, Israel, and Iran is keeping safe‑haven demand elevated, with markets still sensitive to any sign of escalation.
At the same time, shifting US tariff policy under President Trump is adding extra uncertainty, fuelling sharp intraday swings and increasing the likelihood of sudden sentiment flips. Liquidity pockets and whipsaws remain common, making disciplined risk management essential.
Gold’s geopolitical premium is still firmly in place, and until tensions ease, short‑term volatility is likely to stay front‑loaded.
M15 Chart:  Short
Short
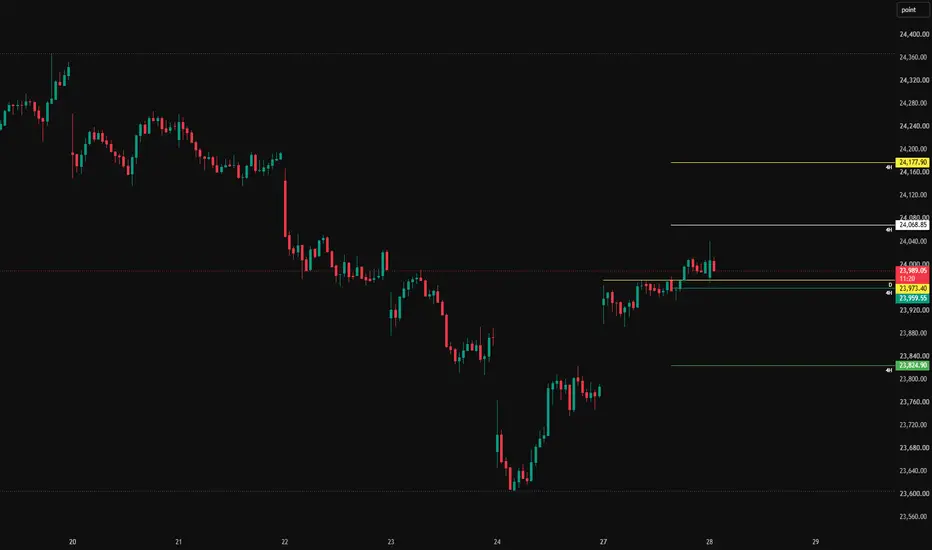
NIFTY50 Market Analysis BreakdownNIFTY50 is currently trading around 24,003, holding above a key support confluence after a strong recovery from the recent bottom. The market has reclaimed the 24,000 psychological level, and price is now testing an immediate resistance zone.
Key Levels
Resistance Levels
24,003.65 – Immediate resistance/current reaction zone
24,068.85 – Major 4H resistance
24,177.90 – Higher 4H resistance and next bullish target
Support Levels
23,973.40 – Daily support
23,959.55 – 4H support
23,824.90 – Major 4H support
Market Structure
The short-term structure remains bullish as price continues to form higher lows after the sharp recovery from the marked 15M–1H bottom. Buyers have successfully defended the 23,973–23,959 support zone, allowing the index to reclaim the 24,000 level.
However, NIFTY50 is now trading directly beneath an important resistance area around 24,003, making this a crucial level for determining the next directional move.
Bullish Scenario 🟢
A sustained move and close above 24,003.65 would strengthen bullish momentum.
The next upside objective would be 24,068.85.
If buyers successfully break and hold above 24,068.85, the rally could extend toward 24,177.90, which is the next major 4H resistance.
Bearish Scenario 🔴
Failure to sustain above 24,003 could result in a pullback toward the 23,973–23,959 support zone.
As long as this support cluster holds, the broader bullish structure remains intact.
A decisive breakdown below 23,959.55 would increase the probability of a deeper correction toward 23,824.90.
Overall Outlook
NIFTY50 is trading at a pivotal resistance while maintaining a positive short-term structure. The 23,973–23,959 zone remains the key support for buyers, whereas 24,003 is the immediate hurdle. A breakout above this resistance would likely shift momentum toward 24,068 and 24,178, while rejection could lead to a healthy retest of support before the next directional move. BTC Market Analysis BreakdownBTC has experienced a sharp rejection from the 66.3K–66.9K resistance zone, confirming selling pressure from higher levels. Price is now trading around 63,285, approaching a critical support region that could determine the next directional move.
Key Levels
Resistance
63,666 – Immediate resistance (D-61.8)
66,390 – 4H Major Resistance
66,924 – Higher Timeframe Major Resistance
Support
62,503 – Immediate Support (D-50)
62,180 – Major 4H Support
61,384 – Strong Support (D-38.2)
Market Structure
BTC remains within a broader rising channel, but the recent rejection from the upper resistance cluster has shifted short-term momentum in favor of the bears. The breakdown below 63,666 indicates that buyers have temporarily lost control, making the current support zone extremely important.
The purple ascending trendlines continue to define the larger structure, suggesting that the overall trend remains constructive as long as price respects the lower trendline.
Bearish Scenario 🔴
If BTC remains below 63,666, bearish pressure could continue toward:
62,503 (D-50 Support)
62,180 (Major 4H Support)
Failure to hold 62,180 would expose 61,384, where the rising trendline and Fibonacci support converge. This area represents the strongest demand zone on the chart.
Bullish Scenario 🟢
For buyers to regain momentum, BTC must first reclaim and hold above 63,666.
A successful recovery above this level could lead to:
66,390 (4H Resistance)
66,924 (Major Higher-Timeframe Resistance)
A breakout above 66,924 would invalidate the current short-term bearish structure and signal renewed bullish strength.
Overall Outlook
BTC is currently testing an important decision zone after losing immediate support. While the broader trend remains supported by the ascending channel, short-term momentum has turned bearish following rejection from the 66K resistance region. The 62,503–62,180 support cluster is the key area to watch. Holding this zone could trigger another recovery attempt toward 63,666 and eventually 66,390, whereas a breakdown below 62,180 would increase the probability of a move toward 61,384, where the next major buying interest is expected. GOLD (XAU/USD) Market Analysis BreakdownGold is currently trading around 4,049, testing an important support zone after failing to sustain its recent rally. The market is positioned between immediate support at 4,038.64 and resistance at 4,062.69, making this a key decision area for the next move.
Key Levels
Resistance
4,062.69 – Immediate 4H Resistance
4,087.31 – Major 4H Resistance
4,140.00 – Higher Resistance
4,165.00 – Major Swing Resistance
Support
4,038.64 – Immediate 4H Support
4,008.43 – Major 4H Support
3,960.00 – Strong Long-Term Support Zone
Market Structure
Gold has pulled back after rejecting from the 4,140–4,165 resistance region, indicating that sellers are defending higher prices. Despite the recent decline, price is still trading above the immediate support at 4,038.64, making this the first level buyers need to protect.
The current structure suggests consolidation within a broader range, with price awaiting confirmation from either a support bounce or a breakdown below key levels.
Bullish Scenario 🟢
If buyers successfully defend 4,038.64 and reclaim 4,062.69, bullish momentum could strengthen toward:
4,087.31 (Major 4H Resistance)
4,140.00 (Higher Resistance)
4,165.00 (Major Swing Resistance)
A sustained break above 4,087.31 would improve the short-term outlook and increase the probability of another test of the recent highs.
Bearish Scenario 🔴
If Gold fails to hold 4,038.64, selling pressure may increase toward:
4,008.43 (Major 4H Support)
A decisive break below 4,008.43 could expose the stronger support zone near 3,960.00, where buyers may look to re-enter the market.
Overall Outlook
Gold is trading at a critical support zone after rejecting from higher resistance. The 4,038.64 level is the immediate line separating bullish recovery from further downside. Holding above this support could lead to a rebound toward 4,062.69 and 4,087.31, while a breakdown below 4,038.64 would shift focus to 4,008.43 and potentially 3,960.00. The reaction around the current support will likely determine the next significant move in the market.  Long
Long
TIP: Why high inflation won’t save this ETF - July 2026SYMBOL: AMEX:TIP | Direction: Short | Timeframe: 3-Week
Published: July 2026
TIPS are supposed to protect you from inflation. The clue is in the name. Treasury Inflation Protected Securities. So why is this chart signalling a correction?
Because the popular understanding of how TIPS work is incomplete. The inflation adjustment is
real. It is simply not the only thing driving the price of a bond ETF. Duration risk is. Real yields
are. And both of those are moving in the wrong direction for TIP holders right now.
TIP has rallied from the 2022 lows in a well-defined ascending channel. That channel is now
exhausted at its upper boundary. Bearish momentum signals are printing. The 3-week chart is
asking a question that the inflation narrative cannot answer.
On the above 3-week chart TIP has reached the upper boundary of its multi-year
ascending channel with bearish momentum signals printing across multiple oscillators.
Three reasons now exist to expect a corrective move lower. They include:
1) Upper channel exhaustion with a bear pending signal . TIP has been climbing within
a clear ascending channel since the 2022 lows. Price is now pressing the upper
boundary of that channel at ~$107. A Bear Pending signal has printed at this level.
Historically, this break of support has marked every significant reversal in this ETF, including the
2021 top and the 2019 peak. It does not print often, but when it does at an upper channel
resistance, Look left.
2) Bearish divergence across the majority of momentum oscillators. More than half of
the oscillators and momentum gauges on the 3-week chart print bearish divergence at
current levels. Price has made a higher high within the channel. Momentum has not
confirmed it. That divergence is the market’s internal structure signalling that buyers are
losing the argument, even as the price tag says otherwise. RSI is simultaneously testing
the upper boundary of its own ascending channel, a level at which it has repeatedly
turned lower. Mean reversion from here is the higher probability path.
3) Duration risk is running faster than the inflation credit. TIP holds intermediate-term
U.S. Treasury Inflation-Protected Securities with an average duration of approximately 6
years. The mathematics of this matters. A 1% rise in nominal Treasury yields inflicts
roughly a 5–6% price drag on a bond of this duration. The CPI adjustment to principal is
real and it helps, but it does not move fast enough to offset aggressive yield moves.
When the Fed holds rates high, when Treasury supply is heavy, and when real interest
rates rise, the base bond price falls faster than inflation adds to it. The price of TIP
drops. The ETF structure cannot change the maths.
Targets (corrective)
• 1st target: ~$101. Mid-channel mean reversion. Prior consolidation zone.
• 2nd target: ~$93. Lower channel boundary. A deeper correction to this level would
represent a full round-trip to the post-2022 recovery base.
A 3-week close above the upper channel boundary, sustained, would invalidate this setup. That
level is approximately $109–$110. If TIP breaks and holds above there, the corrective thesis is
wrong.
The crowd
The crowd holds TIPS as the inflation hedge. That logic is not wrong. It is incomplete. Retail
investors who own TIP have been told, correctly, that the principal adjusts with CPI. What they
have not always been told is that the ETF price is also a function of its underlying bond prices,
which move inversely with yields and are sensitive to duration. When the two forces work
against each other, the net result depends on the maths, not the narrative.
This idea is not a call that inflation disappears. It is a call that the channel is exhausted, the
signals are bearish, and the duration drag is not being fully priced in. Owning the right
instrument for the wrong reason is still the wrong trade. The chart does not care about the
rationale. It cares about price.
The inflation hedge that falls when inflation is high is not a paradox. It is duration. It has always
been duration. The chart is just the most recent reminder.
Ww
Type: Fixed income / ETF technical | Timeframe: 3–9 months
=============================================
Disclaimer : This idea is for educational and informational purposes only. It is not financial advice. It is not a call that inflation is declining or that TIPS will permanently underperform. TIP is a fixed income ETF that tracks U.S. Treasury Inflation-Protected Securities. The price of this ETF is sensitive to changes in nominal interest rates, real yields, and duration, in addition to inflation adjustments. A rise in nominal Treasury yields will negatively affect the price of this
ETF irrespective of the prevailing inflation rate.
Always do your own research and consult a qualified financial adviser before making any investment decisions. Past performance is not indicative of future results.  Short
Short
Long 
Education