EUR is ready to dump in New channel EUR/USD is currently forming a descending channel on the chart. Price is now trading near the channel resistance. I have opened a risky sell position near this resistance level. The target is set before the channel support. However, in the long term, EUR is expected to break this channel to the upside and gain.
Parallel Channel
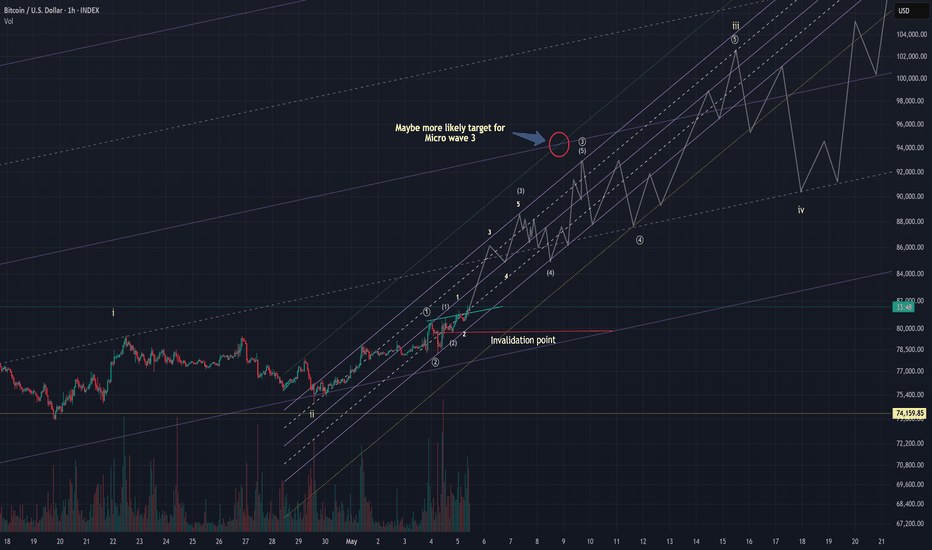
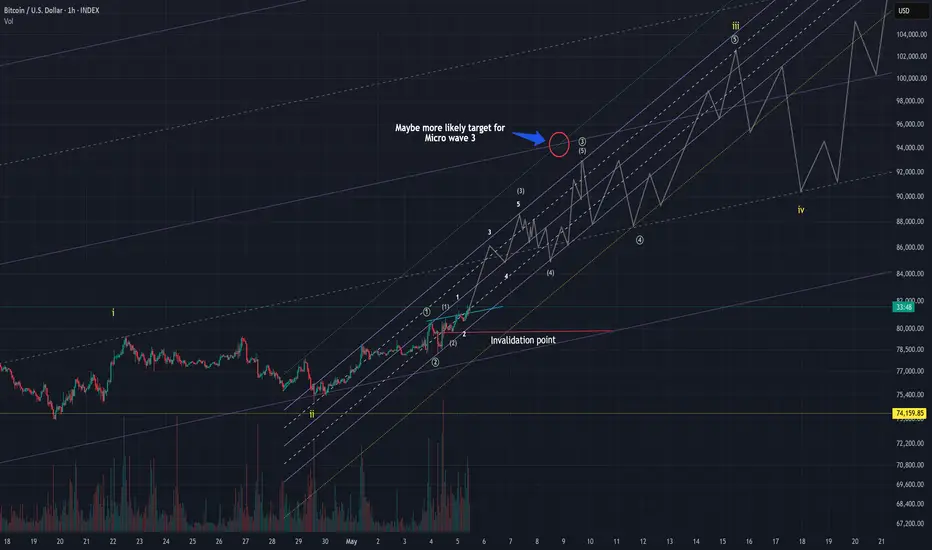
Third Wave Ignition — Don't Fight It As predicted, BTC continues its bullish structure with a Micro Degree (light green ① ② ③ ④ ⑤) channel now forming. Within third waves it's generally not worth trading in and out — impulses tend to run further than expected. Best exits will be at confluence of resistance between the Micro Degree trend channel and the larger Minuette Degree channel (orange (i)(ii)(iii)(iv)(v)).
Long Term Analysis:
Micro Wave 2 and Sub Micro Wave 2 (gray (1)(2)(3)(4)(5)) were both zigzags, so their Wave 4 counterparts are likely to be flats, double zigzags, or triangles. If a correction develops over the weekend, watch for triangle structures specifically — zigzags are possible but low probability, so don't rule out any correction type except as a primary expectation.
The green dotted line above and yellow dotted line below mark the likely extension zones. In a third wave, momentum can accelerate fast — longs pile on, shorts get squeezed, and price moves further than most anticipate.
No shorts on my radar until Micro 4 at the earliest, and more likely not until Subminuette 4 (yellow iv).
The marked invalidation level applies to the Sub Micro (gray) count only — if it breaks there are still multiple bullish alternatives. I will exit my long there if it breaks though, while I try to figure out what's going on. The next 48 hours should be strongly bullish. If we're not seeing 3-5% daily moves, that's its own warning signal — though it won't push me out of an already deeply profitable long. I'd trim and wait for price to clarify before adding back.
Longer term: There are plenty of voices on X married to the bear market narrative, and I expect many will keep labeling this a B wave all the way up. My view is new highs by July, though there's a credible case this impulse only reaches ~$108K. Channel breaks, wave extensions, and momentum will tell us which it is. Monitor, don't predict.
Enjoy the ride if you're long. If you're short… yikes.
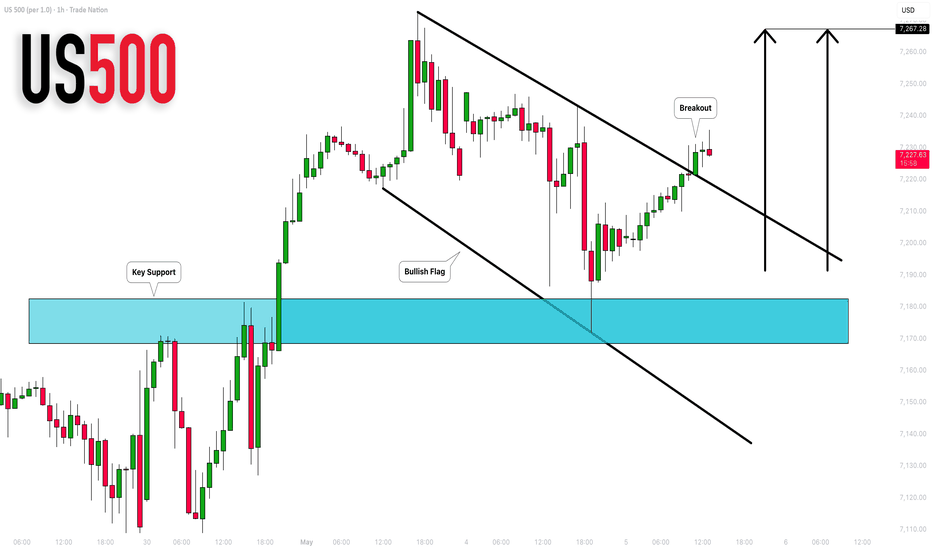
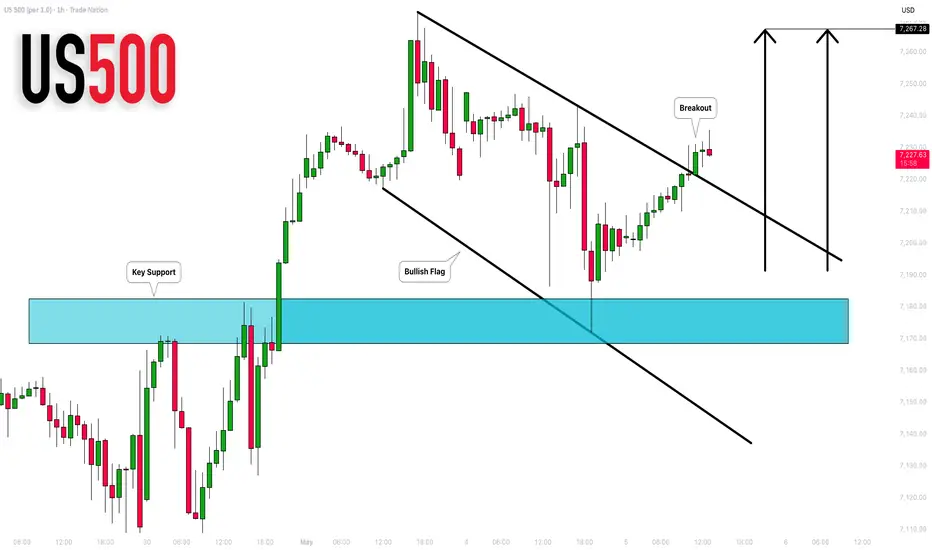
S&P500 INDEX (US500): Bullish Continuation
I see a strong intraday bullish confirmation on US500 index.
The price violated the resistance line of a bullish flag pattern
on an hourly time frame.
I expect a further rise, at least to 7267
❤️Please, support my work with like, thank you!❤️
I am part of Trade Nation's Influencer program and receive a monthly fee for using their TradingView charts in my analysis.
EURUSD Short: Descending Channel Holds Strong, Eyes On 1.1680Hello traders! Here’s my technical outlook based on the current EURUSD (3H) chart structure. EURUSD previously traded below a descending supply line. After a breakout above this structure, price entered a short consolidation phase (range), but the upside momentum was limited.
Currently, EURUSD is trading below the 1.1770 supply zone, which acts as resistance, while moving lower within the descending channel. A recent fake breakout above resistance followed by a sharp rejection indicates strong selling interest.
As long as EURUSD remains below the 1.1770 resistance and respects the descending channel, the bearish scenario remains valid. A continuation to the downside could push price toward the 1.1680 demand zone (TP1). Manage your risk!
EURUSD Approaches 1.1680 Support as Bearish Momentum GrowsHello traders! Here is my technical outlook based on the current EURUSD (1H) chart structure. EURUSD previously traded within a range, consolidating before breaking out to the upside and establishing a short-term bullish phase. After the breakout, price moved into a broader structure and started interacting with a descending resistance line. Currently, price is trading below the 1.1770 resistance level (seller zone), while holding above the 1.1680 support level (buyer zone). The market is also respecting a descending trendline. As long as EURUSD remains below the 1.1770 resistance and respects the descending resistance line, the bearish scenario remains valid. A rejection from this zone could push price toward the 1.1680 support (TP1). Please share this idea with your friends and click Boost 🚀
Gold Rebound Setup: Long Scenario from Key Support To 4,700 TP1Hello traders! Here is my technical outlook based on the current XAUUSD (2H) chart structure. Gold previously moved within an ascending structure, forming higher lows before facing strong resistance and reversing direction. After the rejection, price broke below the trend support and shifted into a descending phase, confirming growing bearish pressure. Currently, price is holding above the 4,580 buyer zone, which acts as strong support, while approaching the 4,700 resistance level (seller zone). A recent reaction from support and consolidation near the trendline indicate that buyers are gaining control. As long as XAUUSD remains above the 4,580 support and respects the ascending trendline, the bullish scenario remains valid. A continuation higher could push price toward the 4,700 resistance (TP1). Please share this idea with your friends and click Boost 🚀
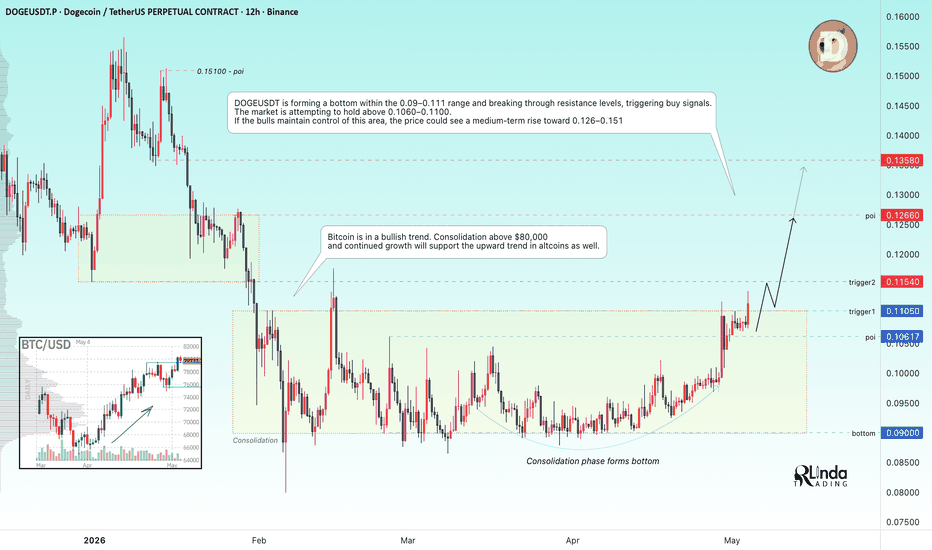
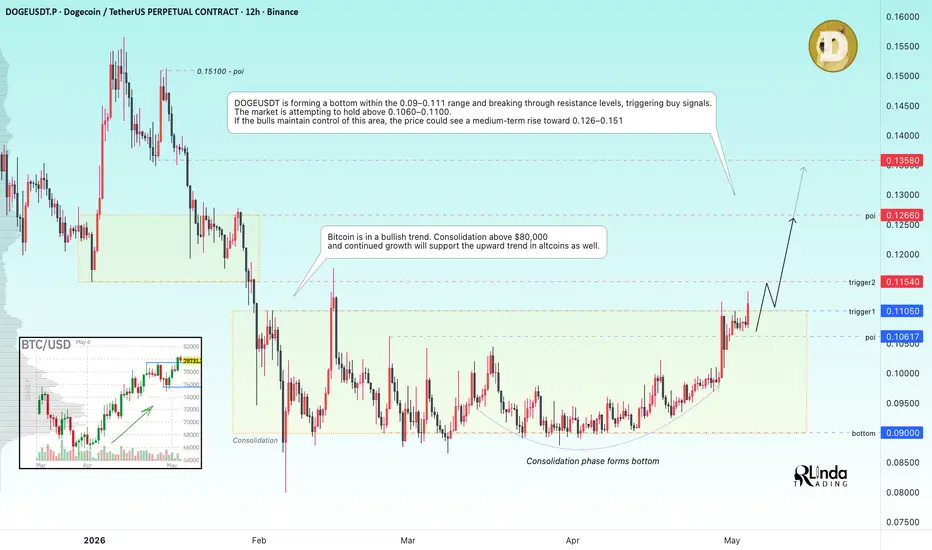
DOGEUSDT - The consolidation is forming a global bottom BINANCE:DOGEUSDT is forming a bottom at 0.09–0.10. The market is entering an intermediate rally phase and preparing for further growth...
Bitcoin is in a bullish trend. Consolidation above 80K and continued growth will support the growth phase in altcoins as well.
DOGEUSDT is forming a bottom within the 0.09–0.11 range and breaking through resistance, activating triggers. The market is attempting to hold above 0.1060–0.1100. If the bulls maintain control of this area, the price could form a medium-term uptrend toward 0.126–0.151
Support levels: 0.1105–0.1060
Resistance levels: 0.1154, 0.1266, 0.1358
The market is showing bullish signs, with the flagship forming a bullish trend over the past month and a half. Doge is emerging from a consolidation phase, and maintaining the price above the key support zone could become the next technical driver for growth. Doge may continue to rise from 0.1100–0.10600; medium-term growth potential is emerging.
Best regards, R. Linda!
I like LCID in this bearish stateSo I'm a fan. I would love to earn a Lucid car through an investment. This is the time to research and find my reasons why.
A falling channel is bearish. A beautiful play from the top to bottom of the channel. Looking for some sideways action. Would love to see LCID dip below $5 for some shares. I'll see what I can figure out. My current plan is to buy and hold dips. I'm anticipating a pop off of the bottom of the channel. However I see that the last time lower channel line was tested, LCID ranged for 2 years. That could be a good strategy to build some shares up to sell when Lucid lovers everywhere give them their flowers.
I'll post as I get more intel.
XAUUSD: Descending Channel Keeps Pressure on Price, 4,510 AimHello everyone, here is my breakdown of the current XAUUSD setup.
Market Analysis
Gold previously traded inside a downward channel, forming lower highs and confirming sustained bearish pressure. After reaching a local bottom, price reversed and broke out of the structure, shifting into a bullish phase and forming an upward channel with higher lows.
Currently, XAUUSD is trading in a descending channel after a consolidation phase below the 4650 resistance zone, approaching the 4510 support zone.
My Scenario & Strategy
As long as price remains inside the descending channel and below resistance, the bearish scenario remains valid. I expect a rebound from the resistance zone and a continued decline in price to the support level of 4510 (TP1).
However, if price breaks above the 4,650 resistance and exits the channel, the bearish outlook would be invalidated, opening the path for a potential recovery.
That’s the setup I’m tracking. Thank you for your attention, and always manage your risk.
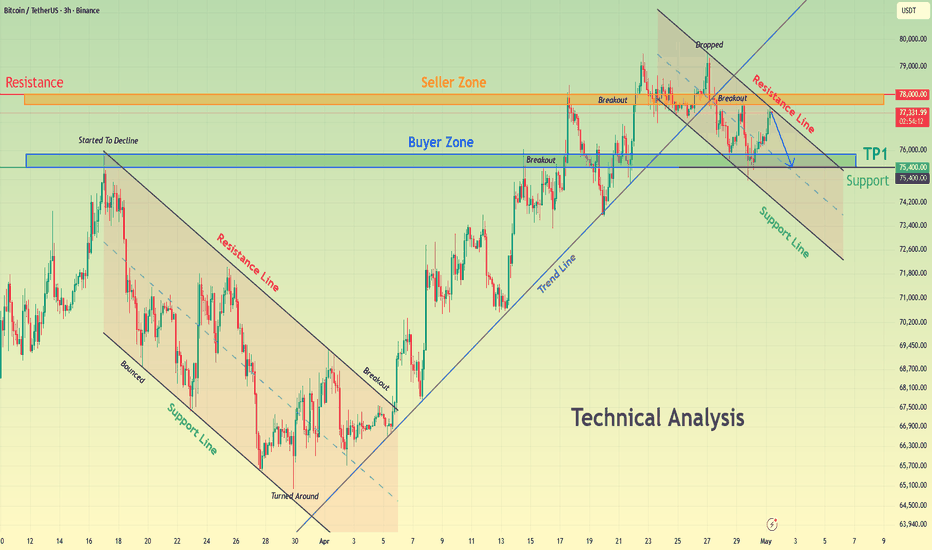
Bitcoin Forms Lower Highs Near 78K – Downside Likely To 75.4KHello traders! Here is my technical outlook based on the current BTCUSDT (3H) chart structure. BTCUSDT previously moved within a descending channel, confirming bearish pressure. After reaching a bottom, price reversed and broke out of the channel, initiating a strong bullish move supported by an ascending trendline. Currently, price is trading below the 78,000 seller zone, while holding above the 76,000 buyer zone. A new descending channel has formed near resistance, and recent breakouts followed by rejection indicate increasing selling pressure. As long as BTCUSDT remains below 78,000 and respects the descending resistance line, the bearish scenario remains valid. A rejection from this area could push price toward the 75,400 support (TP1). Please share this idea with your friends and click Boost 🚀
EURUSD Head & Shoulders Formation - Signals Potential DropHello traders! Here is my technical outlook based on the current EURUSD (4H) chart structure. EURUSD previously traded within a descending channel, showing consistent lower highs and bearish pressure. After a breakdown below the channel, price found support and initiated a recovery, forming an upward move. Currently, price is trading below the 1.1720 seller zone, while holding above the 1.1620 buyer zone. A head and shoulders pattern has formed near resistance, and recent rejections suggest increasing selling pressure. As long as EURUSD remains below 1.1720 and respects the resistance zone, the bearish scenario remains valid. A rejection from this area could push price toward the 1.1620 support (TP1). Please share this idea with your friends and click Boost 🚀
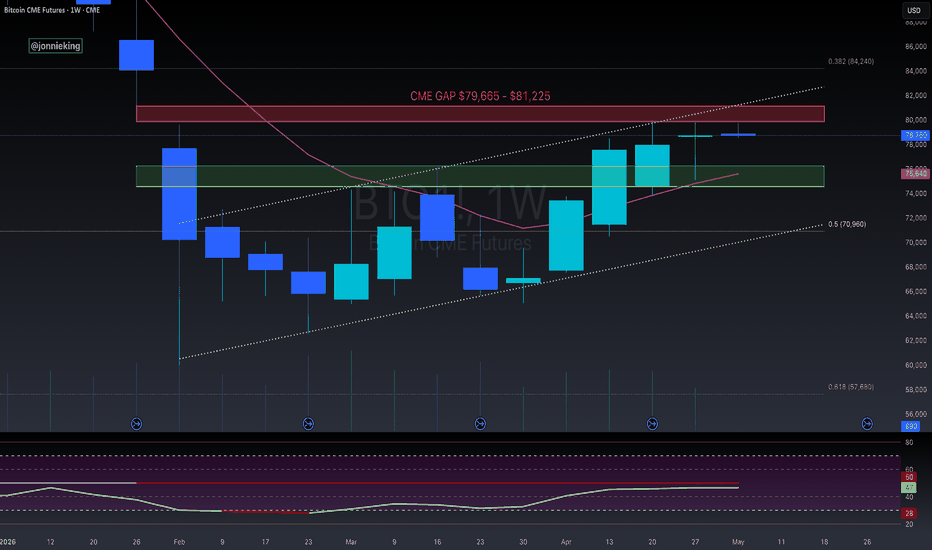
$BTC Hanging Man Weekly Close At Top of ChannelAs suspected, ₿itcoin made a strong push towards $80k to try and fill the CME Gap, but missed filling any portion of it.
We could still see one more push to flush out shorts and fill the gap, otherwise this is most likely the local top.
CRYPTOCAP:BTC has closed the Week with a Hanging Man candle which suggests a trend reversal, and is near the top of the parallel channel.
Waiting for a few Weekly Closes below ~$75k for confirmation.
AAVE double top head & shoulder range consolidationAAVE is consolidating back into its shoulder range after a double top head and shoulder pattern breakdown from the neckline (middle cyan line). Watch for price movement and volatility within the shoulder channel range (purple band) towards the upper neckline (cyan line), the mid-band floor (orange midsection), and the bottom floor of the band (red line).
BTC approaching the 200SMA 83K levelBTC has been in a channel from its previous low making lower highs and higher highs. The price seems to want to retest the previous resistance which was also the previous lower lows. In this case one would call it change of character.
The price actions and the momentum tell a different story. As the price accelerates to the next supply, the moment is diminishing and showing signs of divergence in the short term.
The AB=CD pattern shows a possible scenario when BTC retest that area and would only be valid when the C point develops and gets rejected.
The C point coincided with two other technical trends. It's near the 0.618 Fib retracement. The price has recovered in choppy way and took much longer period to recover its 50-70% from its previous low.
It also coincides with the 200SMA area known for price rejection during the bear market. Price moves faster from higher averages like 10, 50 but slows down and allows the slower averages to catch up. We see this as the price moves towards the 200SMA.
As price develops this change of character it invites more traders to enter long just to get trapped and reversed, liquidity is needed for this to mature. Conditions need to be met for price to go lower than its previous low.
NFA, these are my opinions and are not intended as a financial advice.
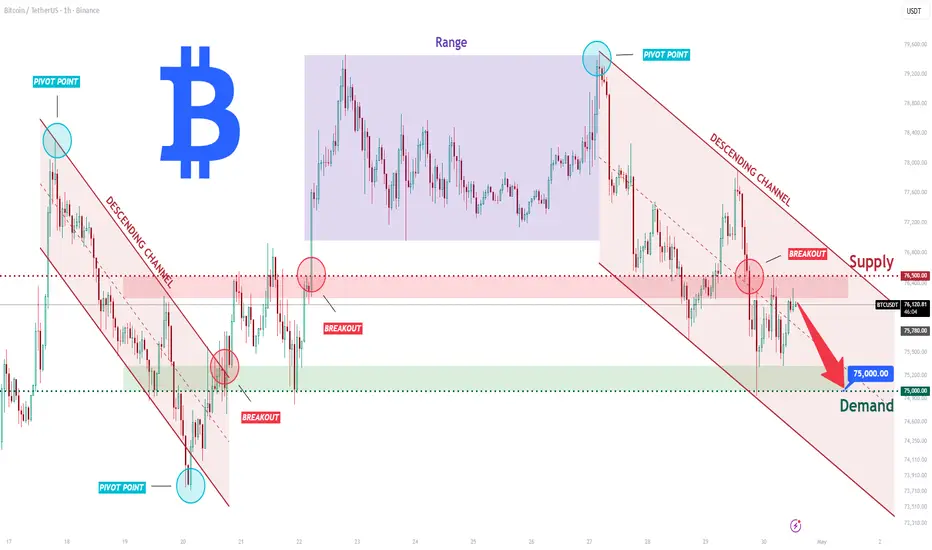
BTCUSDT Short: Descending Channel Points to Further DeclineHello traders! Here’s my technical outlook based on the current BTCUSDT (1H) chart structure. Bitcoin previously traded inside a range after exiting a descending channel. After reaching a pivot point near the upper boundary, price reversed and entered a new descending channel, confirming bearish pressure.
Currently, price is trading below the 76,500 supply zone, which acts as resistance, while moving downward toward the 75,000 demand zone. A recent breakout and rejection from the supply area highlight strong selling pressure and continuation signals.
As long as BTCUSDT remains below the 76,500 resistance and respects the descending channel, the bearish bias remains valid. A continuation to the downside could push price toward the 75,000 support (TP1). Manage your risk!
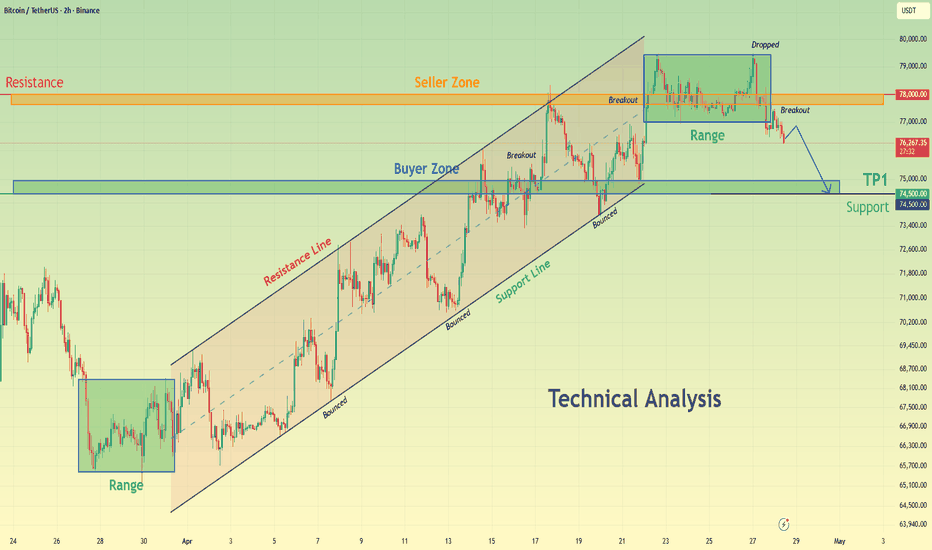
Bitcoin Under Pressure – Short Toward 74.500$ PossibleHello traders! Here is my technical outlook based on the current BTCUSDT (2H) chart structure. Bitcoin previously traded within a range, showing consolidation before breaking out and shifting into an ascending channel with higher lows. The bullish structure was supported by multiple bounces from the rising support line. Currently, price is moving inside the ascending channel and approaching the 78,000 resistance zone (seller zone), where a range has formed and a recent drop indicates selling pressure. As long as BTCUSDT remains below the 78,000 resistance, the bearish scenario becomes valid. A rejection from this zone could push price toward the 74,500 support (TP1), which aligns with the lower boundary of the channel and the buyer zone. Please share this idea with your friends and click Boost 🚀
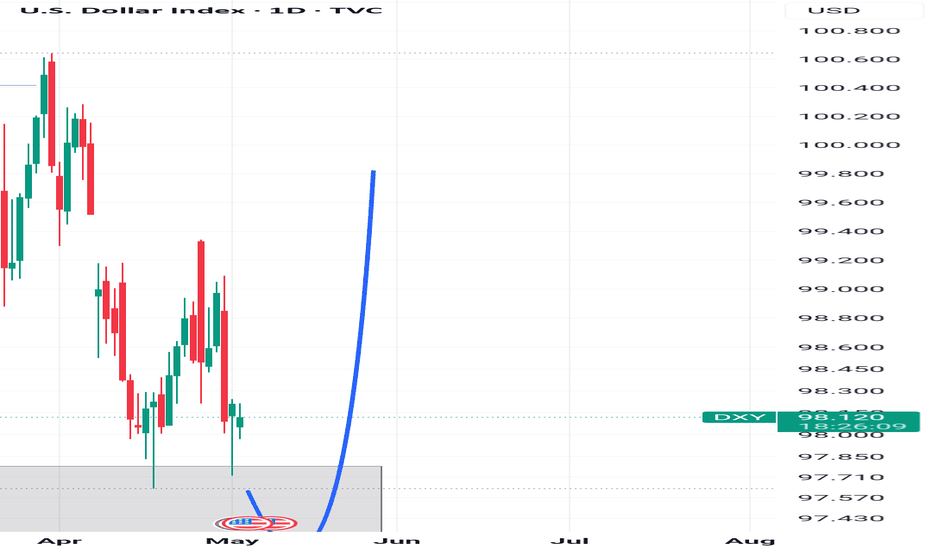
DXY: 12M SFP at Macro ResistanceThe U.S. Dollar Index is printing a textbook structural breakdown on the 12-month timeframe.
Price swept all-time resistance and failed to hold — forming a swing failure pattern with a bearish engulfing candle at the macro ceiling. This is not a minor pullback inside a trend. This is a rejection at the highest distribution zone on the chart.
Price is now declining inside a corrective ascending channel that dates back decades. The structure is intact, but the character of price action has shifted. Lower highs into resistance. Selling pressure absorbed, not reversed.
The 110.31 level remains the key reference. As long as DXY trades below that zone, the macro environment favors risk assets and hard money.
What this means for BTC and gold:
Dollar weakness is the single largest macro tailwind for both. Every leg lower in DXY has historically corresponded with expansion in BTC price and continued demand for gold as a reserve alternative.
The regime is not bullish dollar. It is bearish dollar until structure proves otherwise.
Watching for continuation inside the channel with a primary scenario targeting the lower channel boundary on the 2M timeframe.
1320 Weekly breakout1320 Broke out of a descending channel that it was following since March 2024. If it is able to breakout above 58-59 it has huge potential upward. Should stay above 50.5 (SL) for this swing for now. Some intermediate resistances marked as partial profit taking levels, with eventual target of 78 for now. Will evalute it along the road as it moves forward.