A Wild short in WLDHello Traders!
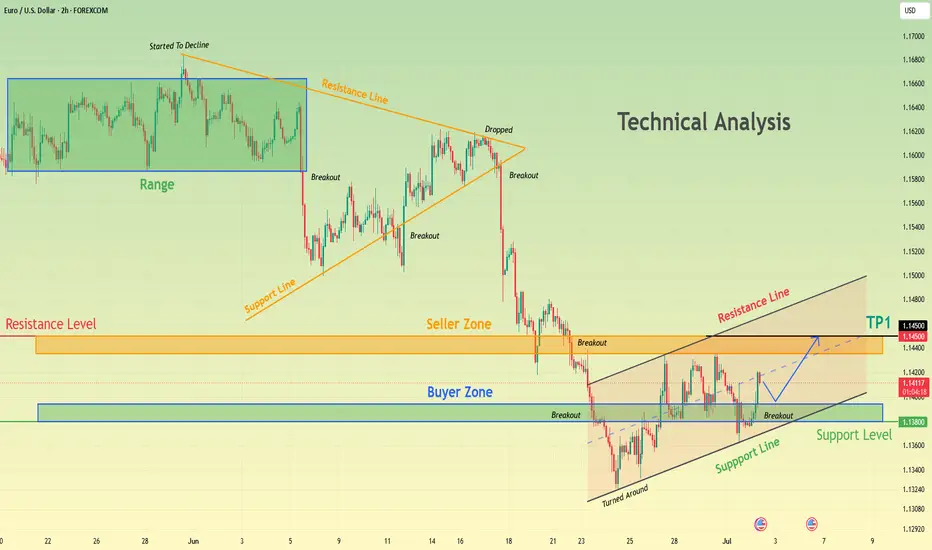
This will be a beautiful short in WLD as we are entering in middle of a bearish trend with small stoploss.
WLD is inside a channel and it has reacted at the resistive trendline of the channel and now it is heading towards downside. There are multiple bearish confirmations in WLD
We are entering in WLD from 0.4157
Stoploss 0.4319 (-3.9%)
Target 0.376(+9.5%)
My goal is to be recognized as one of the highest win-rate traders in the TradingView community. :)
Trade Analysis Based on
> Fibonacci Tool (A1000x Way) – Custom Fibonacci approach for precise market analysis
> Candlestick Patterns – Strong price action confirmation through key candle formations
> A1000x Breakout Strategy – Identifying and trading high-probability breakout setups
> HH, HL & LH, LL Strategy – Market structure analysis for clear trend direction
> Swing Points – Tracking key highs and lows for accurate price movement insight
> A1000x Stoploss Strategy – Strategic stoploss placement for effective risk control
> A1000x Target Strategy – Structured target setting based on price action
We trade using carefully developed strategies and disciplined market analysis, always seeking the best possible accuracy while remembering that ultimate success comes only by the will of Allah.
In some trades, you may notice a relatively larger stop loss or a risk-to-reward ratio that may appear unusual at first glance. However, every trade is taken with proper planning and calculated analysis, not random entries.
Before entering any position, we perform detailed calculations and market evaluation. Based on this analysis, we carefully determine our stop loss and target levels.
I personally apply one of my specialized stop-loss and target strategies, designed to place the stop loss at a logical market level where price is less likely to reach before moving toward the intended target — InshaAllah.
Trading always involves risk, but with discipline, patience, and proper strategy, we aim for consistent and responsible decision-making.
Feel free to share your thoughts, leave a comment, or contact me.  Short
Short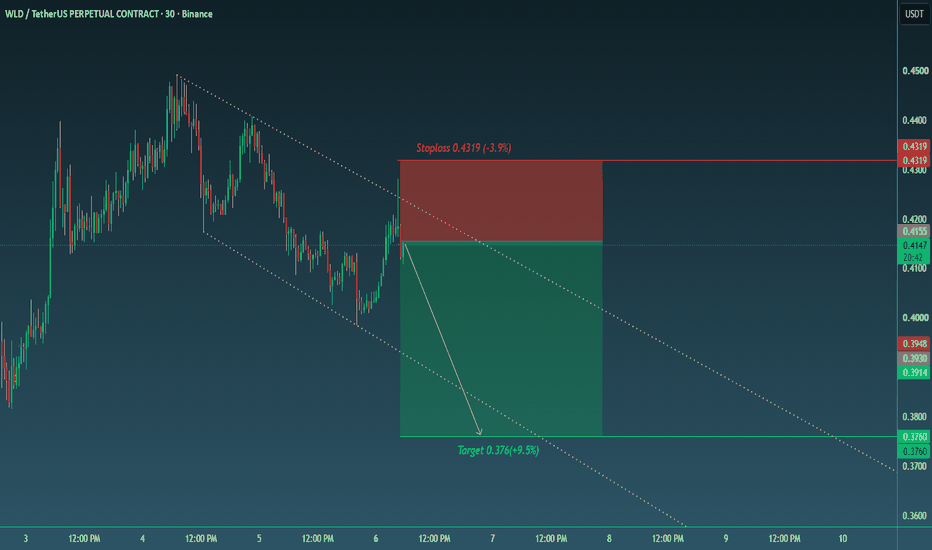
BTCUSDT Recovery Gains Strength – 63.1K Becomes the Next TargetHello traders! Here’s my technical outlook based on the current BTCUSDT (1H) chart structure. BTCUSDT previously traded inside an ascending channel before reversing lower and breaking below support, confirming a bearish shift in market structure. Price later formed a descending channel, but multiple false breakdowns near the lows signaled weakening selling pressure and opened the door for a recovery. Currently, BTC is trading above the 60,700 Buyer Zone while remaining below the 63,100 Seller Zone. After completing an inverse Head and Shoulders pattern, buyers pushed price above the key support area and established a short-term uptrend. As long as BTCUSDT remains above the support level of 60,700 and meets the rising support line, the bullish recovery scenario remains valid. Continued growth may push the price to the resistance zone of 63,100 (TP1), but before that, a correction to the support zone is quite possible. Please share this idea with your friends and click "Boost" 🚀  Long
Long
 Short
Short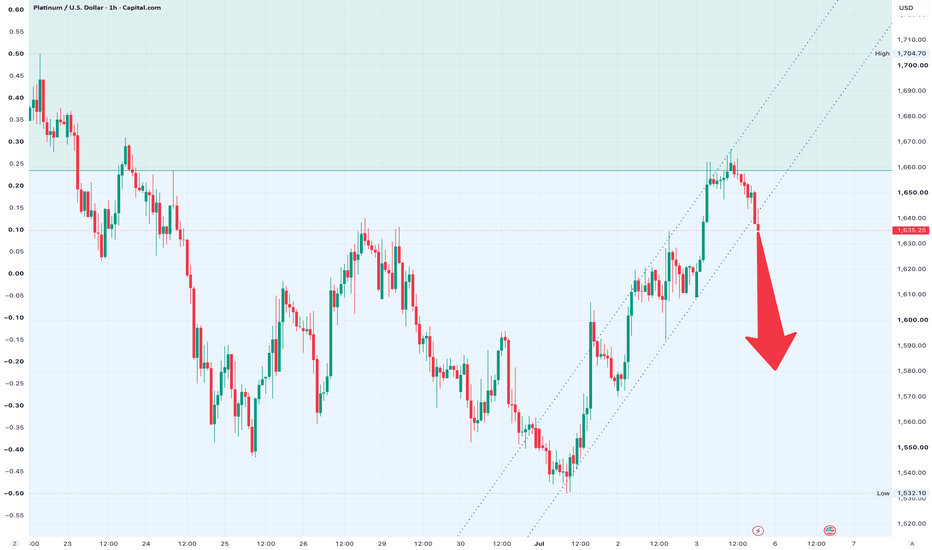
XAUUSD (M30) | Gold Eyes 4,115 in Thin Holiday TradeMarket Context
Gold remains bullish after the NFP breakout.
US markets are closed for Independence Day, creating thin liquidity and algorithm-driven price action.
No major economic data today, so technical structure is likely to dominate.
Technical Structure
Bullish breakout remains valid.
Price is retesting the ascending trendline after clearing the 4,037–4,056 resistance.
Momentum favors continuation while support holds.
Key Levels
🔹 Support: 4,037–4,056
🔹 Dynamic Support: Ascending Trendline
🔹 Target: 4,100–4,115
IF–THEN Scenario
If price holds above 4,056, bullish momentum may extend toward 4,115.
If the trendline fails, a deeper pullback could develop before the next impulse.
MMFLOW View
The short-term bias remains Buy the Dip. Thin holiday liquidity can create false moves, so focus on confirmed pullbacks rather than chasing price at premium levels.
💬 Will Gold reach 4,115 before the weekly close, or will thin liquidity trigger a surprise reversal?  Short
Short
Gold Price Stalls Below Resistance – Is Another Selloff Coming?Hello traders! Here’s my technical outlook based on the current XAUUSD (3H) chart structure. XAUUSD previously traded inside a broad descending channel before breaking below support, confirming a bearish shift in market structure. After the breakdown, price formed a rounding top near the 4,100 Seller Zone, signaling fading bullish momentum and a continuation of the downtrend. Currently, XAUUSD is trading below the 4,100 Seller Zone while holding above the 3,900 Buyer Zone. Price remains beneath a descending resistance line, and recent recovery attempts have been rejected, showing that sellers continue to defend higher levels. As long as XAUUSD remains below the 4,100 Resistance Level and respects the descending resistance line, the bearish scenario remains valid. A rejection from current levels could push price toward the 3,900 Buyer Zone (TP1). Please share this idea with your friends and click “Boost” 🚀 Short 
BTC is back near a major cycle reset zoneBTC/DXY 2W
CRYPTOCAP:BTC Back near a major cycle reset zone, with RSI again sitting close to previous macro stress areas.
Bitcoin is once again testing one of the most important areas on the high-timeframe chart: the lower part of its longterm rising structure. Historically, these zones did not feel comfortable in real time. They appeared during fear, exhaustion, forced selling, and broad disbelief. current structure is important because Bitcoin is now back near the same type of reset zone that marked previous major cycle lows and recovery bases. In 2018, the market bottomed after a long decline into the lower rail. In the Covid crash, price again reached a deep stress zone before recovering sharply. In 2022, the same type of structure appeared near the cycle bottom. Now, in 2026, Bitcoin is testing a similar region again.
The RSI layer adds another important signal. Previous major reset zones occurred when RSI moved into the low-stress region. In 2018, RSI reached the mid-30s. During the Covid crash, RSI was near 40. In 2022, RSI again moved into the low-30s to mid-30s zone. Today, RSI is again sitting around the samee historical stress area.
does not mean the bottom is guaranteed. It means Bitcoin is no longer in an overheated or euphoric position. The market is not pricing comfort here. It is pricing fear, compression, and uncertainty.
That is exactly why this zone matters.
Most people want a clean bottom, clear confirmation, and no emotional pressure. Bitcoin rarely gives that. High-timeframe bottoms usually appear while the chart still looks weak and the crowd still expects more downside.
For the bullish cycle location thesis to remain valid, Bitcoin needs to hold this lower structure and begin reclaiming strength above the recent breakdown area. A strong reaction from this zone would suggest that the current move is not the end of the cycle, but another reset inside the broader structure. invalidation is also clear. If Bitcoin loses the lower rail with continuation and fails to reclaim it, the structure weakens. In that case, the market would be signaling that this is not just a reset, but a deeper structural breakdown.
Until that happens, this remains one of the most important Bitcoin cycle-location tests of the current phase.most crowd sees weakness. chart is asking a better question: Is Bitcoin breaking down, or is this the fear zone before the next major recovery begins?
Bitcoin bottoms are rarely written in confidence. usually written in fear. Long 
GOLD - A shift in the fundamental backdrop. Locally bullishFX:XAUUSD is breaking its recent market structure and transitioning into a local distribution phase within the broader bearish trend. The primary focus is on the 4120–4200 range
Gold has staged a strong rebound after weaker-than-expected U.S. employment data shifted Fed rate expectations from hawkish to neutral. The probability of a rate hike at the next meeting has fallen to 18%, while the U.S. dollar and Treasury yields have both declined, creating favorable conditions for a recovery following gold's sharpest quarterly decline in 13 years.
With the July 4th holiday approaching, profit-taking could increase volatility. Although bearish pressure has eased, the broader technical outlook remains cautious.
Technically, after the short squeeze into the 4190–4200 liquidity zone, gold may enter a corrective phase toward support before attempting another move higher. However, both the global and local trends remain bearish
Resistance levels: 4198, 4220, 4329
Support levels: 4150, 4125, 4061
A correction and retest of the 4130–4120 liquidity zone could provide bulls with another opportunity to push the market higher. Market makers may target a retest of 4220, with a potential medium-term extension toward 4330
Best regards,
R. Linda Long 
BTCUSDT: Finds Support – Is a Possible Move to 60K Next?Hello everyone, here is my breakdown of the current BTCUSDT setup.
Market Analysis
BTCUSDT previously traded inside a strong upward channel before breaking below channel support and transitioning into a broader downtrend. After several failed recovery attempts, price formed a consolidation range beneath the descending trendline, confirming that sellers continued to defend higher levels.
Currently, BTCUSDT is trading above the 57,800 Support Zone while remaining below the 60,000 Resistance Zone. Price recently rejected the lower boundary of the range and is attempting a short-term recovery from support. The descending trendline and horizontal resistance now represent the key barriers for buyers.
My Scenario & Strategy
As long as BTCUSDT remains above the 57,800 Support Zone, the recovery scenario remains valid. A continuation higher could push price toward the 60,000 Resistance Zone (TP1), where the descending trendline may trigger fresh selling pressure.
However, if BTCUSDT breaks below the support zone, the bullish recovery would weaken and the broader bearish trend could resume.
That’s the setup I’m tracking. Thank you for your attention, and always manage your risk. Long 
BITCOIN - A false breakout of resistance during a bearish trendBINANCE:BTCUSDT.P remains in a bearish trend and is currently retesting the 60700 resistance zone. Both the global and local trends continue to favor the downside.
Bitcoin is caught between three key forces: the Fed's softer rhetoric (Kevin Warsh signaled easing inflation risks, reducing pressure on risk assets), record institutional outflows (the tenth consecutive day of ETF outflows, with $4.5 billion withdrawn in June), and a countertrend correction within the broader bearish trend.
Technically, the market is showing signs of a false breakout around resistance as sellers attempt to defend the area. Consolidation below 60700 could trigger another leg lower.
Resistance levels: 60700, 62200
Support levels: 59555, 58320, 58030
The focus remains on two key trigger levels: 60730 and 62232. If the market fails to reclaim 60730 after the false breakout, Bitcoin could resume its decline toward 59500–58000. However, a retest of the 62200 resistance zone cannot be ruled out. A short squeeze into either resistance area could create the conditions for another bearish move.
Best regards,
R. Linda Short 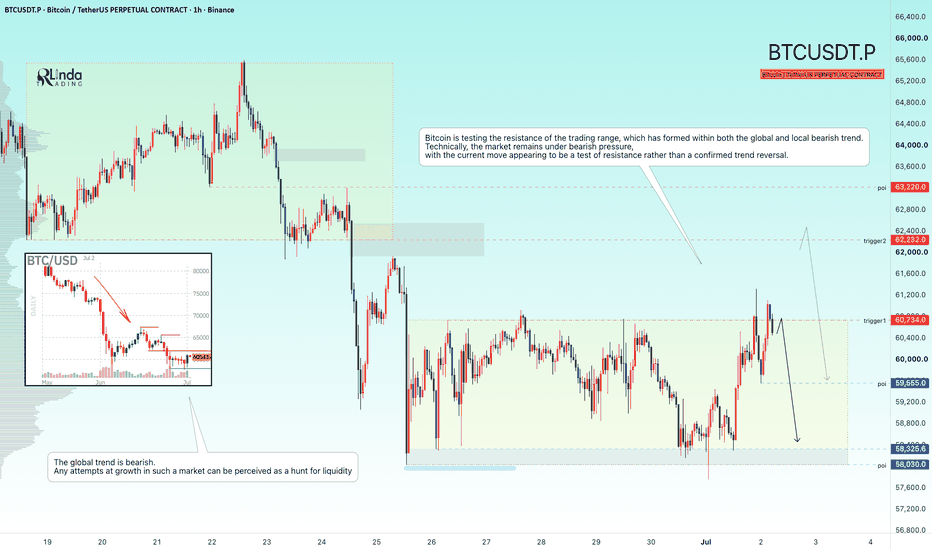
XAUUSD Short: Bears Defend 4,100 Supply, Eyes on 3,960 DemandHello traders! Here’s my technical outlook based on the current XAUUSD (1H) chart structure. XAUUSD previously traded inside a consolidation range before breaking lower from a major pivot high, confirming a bearish shift in market structure. Price then entered a well-defined descending channel.
Currently, XAUUSD is trading above the 3,960 Demand Zone while remaining below the 4,100 Supply Zone. A recent rebound from demand has lifted price toward the descending channel resistance, but the recovery is still corrective as long as the channel remains intact.
As long as XAUUSD stays below the 4,100 Supply Zone and continues to respect the descending channel, the bearish scenario remains valid. A rejection from current levels could send price back toward the 3,960 Demand Zone (TP1). Manage your risk! Short 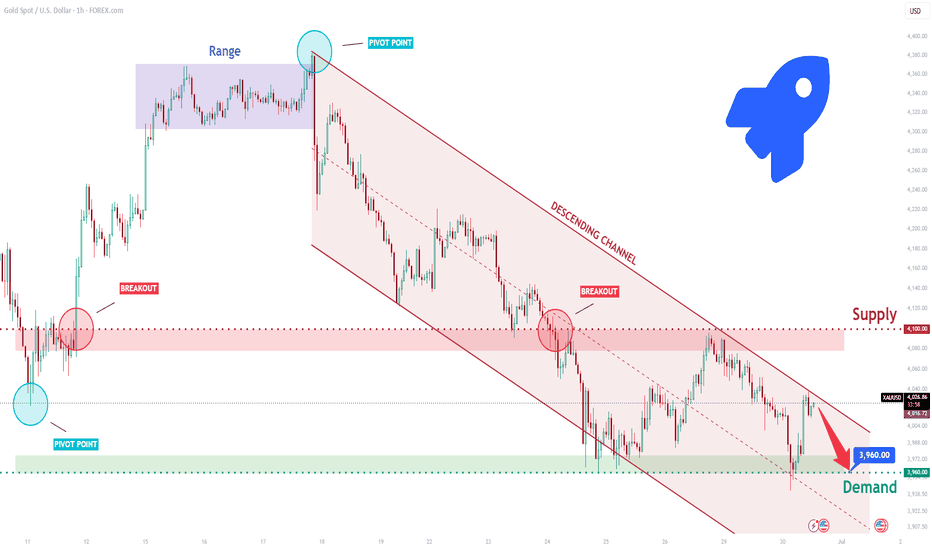
EURUSD: Climbs From Demand - Can Buyers Extend the Rally?Hello everyone, here is my breakdown of the current EURUSD setup.
Market Analysis
EURUSD previously traded below a long-term descending trendline after failing to hold above a consolidation range. A fake breakout above trendline resistance was quickly rejected, triggering a strong bearish impulse that confirmed seller dominance. Later, multiple breakdowns below key support levels extended the decline toward the current demand area.
Currently, EURUSD is trading above the 1.1340 Support Zone while remaining below the 1.1440 Resistance Zone. After forming a fake breakout beneath support, price entered a rising channel and started a recovery. The pair is now approaching both the descending trendline and the resistance zone, where sellers may attempt to regain control.
My Scenario & Strategy
As long as EURUSD remains above the 1.1340 Support Zone and continues to respect the ascending channel, the recovery scenario remains valid. A continuation higher could push price toward the 1.1440 Resistance Zone (TP1).
However, if EURUSD breaks below the ascending channel and loses the support zone, the bullish outlook would weaken and another bearish leg could develop.
That’s the setup I’m tracking. Thank you for your attention, and always manage your risk. BTCUSDT: Near Channel Resistance – Watching for a Bearish ReversHello everyone, here is my breakdown of the current BTCUSDT setup.
Market Analysis
BTCUSDT previously traded inside a strong ascending channel before reversing lower and breaking into a well-defined descending channel, confirming a shift in market structure. Several breakdowns below former support levels strengthened bearish momentum, while each recovery attempt was rejected near channel resistance.
Currently, BTCUSDT is trading above the 58,600 Support Zone while remaining below the 61,000 Resistance Zone. Price recently rebounded from support after a false breakdown, but it continues to trade beneath the descending channel and below former support, now acting as resistance. This suggests that sellers still have the upper hand.
My Scenario & Strategy
As long as BTCUSDT remains below the 61,000 Resistance Zone and continues to respect the descending channel structure, the bearish scenario remains valid. A rejection from current levels could push price back toward the 58,600 Support Zone (TP1).
However, if BTCUSDT breaks above the resistance zone and exits the descending channel, the bearish outlook would weaken and a stronger recovery could develop.
That’s the setup I’m tracking. Thank you for your attention, and always manage your risk. Short 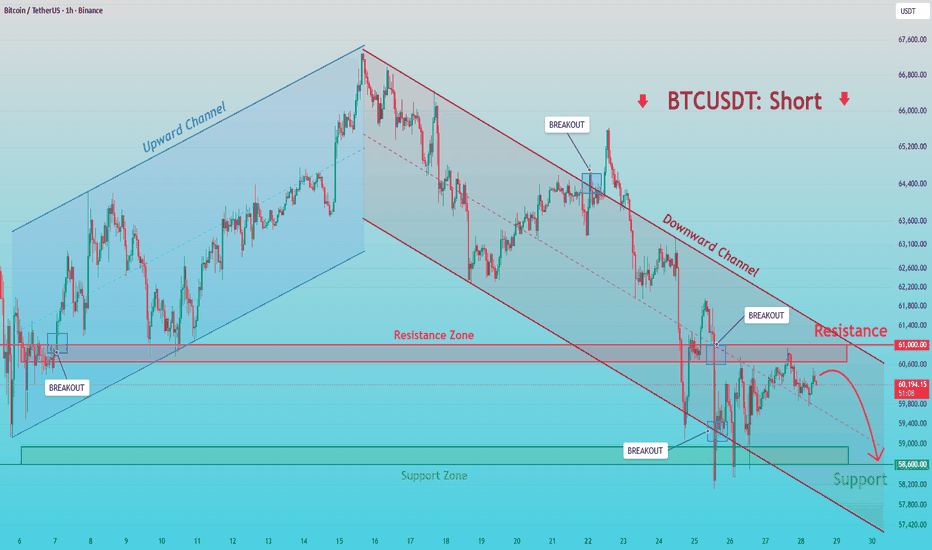
Bitcoin Rejected Below Resistance — 58K Support Back in FocusHello traders! Here’s my technical outlook based on the current BTCUSDT (4H) chart structure. BTCUSDT previously traded inside a broad descending channel before breaking below support, confirming strong bearish momentum. After reaching a major low, price recovered inside an ascending channel, but buyers failed to maintain control as the channel eventually broke to the downside. Currently, BTCUSDT is trading below the 62,000 Seller Zone while holding above the 58,000 Buyer Zone. Price has entered a tight consolidation range beneath former support, suggesting that buyers remain weak while sellers continue defending resistance. As long as BTCUSDT remains below the 62,000 Resistance Level, the bearish scenario remains valid. A rejection from the current range could push price toward the 58,000 Buyer Zone (TP1). Please share this idea with your friends and click “Boost” 🚀 Short 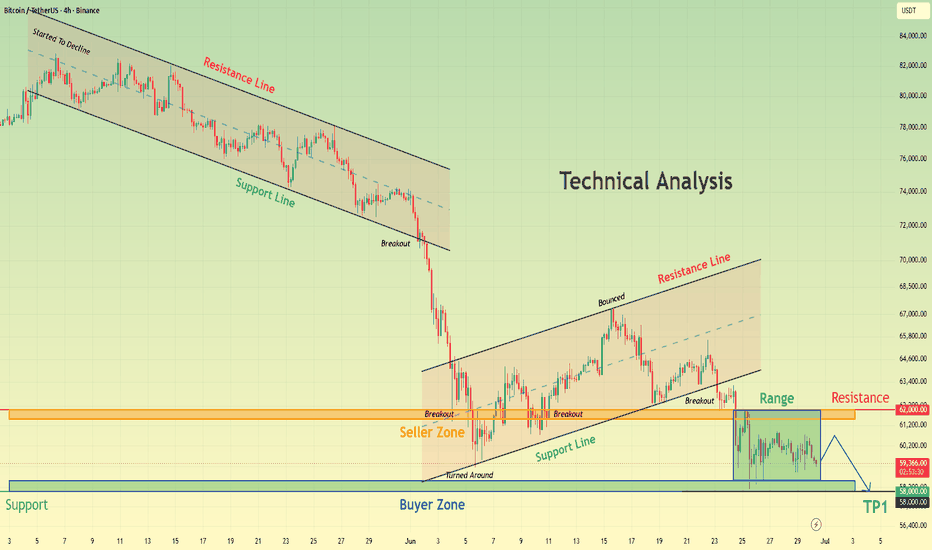

 Long
Long