Pin Bar
BTCUSD: Bullish Gartley Support Confirmed Targeting $155,627.72This is a follow-up to the previous bullish entry idea from 2 months ago at the bottom of the channel.
Over the last several weeks BTC has been putting in a bottom at the bottom of this channel both in terms of putting in a Double Bottom on the weekly timeframe and confirming a Bullish Inverted Hammer on last month's Monthly Close; in this time BTC has been taking back the 200-week moving average and given that BTC rarely stays below the 200-week Moving Average for long it is statistically li
Cypher pattern in makingSetup
The Cypher pattern is a 4-leg reversal pattern that relies on specific Fibonacci ratios.
Here is how this specific setup validates:
B Point: Must be a retracement of the XA leg, typically between 0.382 and 0.618.
Here, it sits perfectly at the 0.618 level.C Point:
This is a "beyond" extension of the XA leg, reaching at least 1.272. On this chart, it pushed to 1.311, creating a higher high and trapping early shorters.
D Point (The Entry): The completion point occurs at the 0.786 retrace
EUR/USD Long Trade IdeaAfter a strong bullish move, the price retraced to Golden Fib Level of 0.618 and is consolidating in this range. The next bullish move of the ABCD Harmonic Pattern is expected to hit TP 1 and TP 2. An aggressive entry would be around 1.63, but it is advised to enter after the liquidity sweep or grab which would confirm the bias, as the move would then become quite bullish.
Entry: 1.16712
Stoploss: 1.16491
TP1: 1.17220
TP2: 1.17715
Risk: 0.4%
RR: 1:4.75
Disclaimer: Plan trade as per your own
BTCUSDT 4H Bearish Cypher: PRZ Hit, Reversal Toward 67k?BTCUSDT 4H — Bearish Cypher nearing completion, watch for rejection from PRZ
BTC is trading into a very clean bearish Cypher structure on the 4H chart, with price now pressing into the potential reversal zone (PRZ) around 72.8k–73.8k .
The structure is technically interesting because:
X-A defines the initial impulsive leg
B respects the retracement conditions and has not closed above the invalidation area
C swept deep enough into the lower support zone and stayed within accept
NEAR Breaking Structure + AB=CD Pattern | High Probability Long Description:
#NEAR is showing strong bullish momentum on the 1H timeframe, forming a clean AB=CD harmonic pattern while successfully breaking previous Higher Highs (HHs) — a clear sign of trend continuation. The market structure is bullish with no visible bearish divergence or weakness, indicating buyers are in full control. With price holding above key structure, this looks like an ideal opportunity to enter a long position at current market price (CMP). As always, wait for confirmation and man
GBPJPY - Bearish Bat
GBPJPY forming a Bearish Bat, completion projected at 212.6–213.0.
Current Condition:
Price has NOT reached the PRZ. No valid entry yet.
Plan:
Wait for price to complete into PRZ and show rejection before shorting.
Entry:
212.6 – 213.0 (after confirmation preferred)
Stop Loss:
213.5 – 214.2
Targets:
TP1: 211.0
TP2: 209.8
TP3: 208.5
USD/CAD Long Trade IdeaAfter consolidating in the past session, USD/CAD appears to be ready for a bullish continuation.
Bullish indications:
1- Volume compressing in the consolidation box.
2- Printing Bullish Flag Pattern
3- Sustaining key levels
4- Strong rejection from lower level
Entry: CMP(Aggressive) or after confirmation at 1.39510
Target: 1.39742
Stop Loss: 1.39428
Risk: 0.4%
RR: 1:3
Disclaimer: Plan this trade as per your own risk management. This is not financial advice.
The Bullish Setup on ETH Has More Potential Than Once ThoughtFollowing up on this initial Bullish idea on the 4 Hour:
and this Bullish idea on the daily:
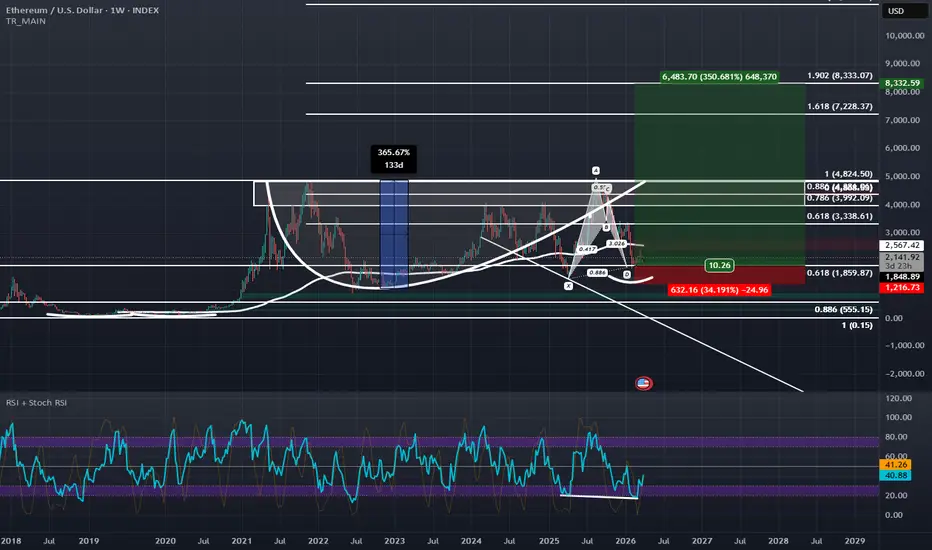
It would seem that ETH also has a big bullish setup on the weekly as seen in the current chart. We are at the all-time 0.618 Retrace and at this retrace we are making a local 0.886 and completing a Bullish Bat visible on the Weekly with Hidden Bullish Divergence on the RSI. If ETH really starts to bounce here at this heavy level of confluence it would be confirming a Partial-Decline of a Right-angle
FET Bullish Pullback Setup | HL Entry Opportunity#Fetch.ai is showing strong bullish momentum on lower timeframes with clear Higher Highs and Higher Lows structure, indicating a continuation trend; currently, price is pulling back toward a key HL zone where we will wait for confirmation (bullish reaction/rejection) before entering a long position, as this pullback can provide a better risk-to-reward opportunity, but proper risk management is essential with stop loss below the HL and no chasing entries.
#FET #CryptoTrading #TradingView #Bullis
XAUUSD | What If This Level Breaks?
Price is currently trading higher timeframe structure after a clear shift in delivery.
We are not at supply yet.
And on the daily timeframe , this is a process, not a moment.
The current move shows:
Manipulation into demand
Displacement + BOS
Continuation building toward premium
The highs ahead are formed as equal highs in a bullish trend ,
meaning buy-side liquidity is resting above .
Supply is still untested.
Which makes it more likely to react initially ,
but not necessarily to
XAUUSD (GOLD) analysis for scalpersIn this video, I break down the current gold ( PEPPERSTONE:XAUUSD ) market from a scalper’s perspective using a top-down approach.
➡️ Starting from the daily timeframe
➡️ Moving to the 1H chart
➡️ And finishing on lower timeframe (M15)
I explain:
✔️ where to look for high-probability entries
✔️ how to properly use channels
✔️ how to work with trendlines in real trading
The focus is on building context from higher timeframes and executing precise entries on the lower ones.
🎯 If you trade G
CIPHER Macro analysis | The bigger picture | Long-term holdersNASDAQ:CIFR remains in a wave 4, below the all-time high. Wave 4s are characterised by their drawn-out, shallow, volatile ranges, well known as the place where traders give their gains back to the market through impatience and false signals. Wave 4s usually end at the 0.382 Fib, $8.52, but can extend as far as the 0.5, aligning with the weekly 200EMA and HVN, so this is a high confluence area. Price is currently testing the weekly pivot as support and the upper trend-line of the previous trend
NKE: 1.618 Bullish Butterfly with RSI Bullish DivergenceNKE is down 71% from the highs with an unfilled upside gap at $157. In this decline NKE has formed some RSI Bullish Divergence at the 1.618 PCZ of a Bullish Butterfly. Given how much NKE has already been beaten down I think that it is slightly more likely for NKE to attempt to find a bottom here especially as it goes into earnings today and if it does I think it could rise to the top of the pattern to $130 and from there maybe even go for the full gap fill at $157 so long as today's earnings do
ETH Big picture Elloit wave 3/29/2026In my opinion, I believe that ETH still has further downside pressure to complete its wave ⓥ. After wave i, the upward momentum failed to make a higher high compared to previous levels and instead formed a corrective wave ii. Therefore, I expect that we are currently moving downward into wave iii.
For the micro count, I believe that wave (2) is nearing completion and the market is preparing to enter wave (3).
The target price for wave ⓥ is around $1,564, as suggested by a Crab harmonic pattern
USDCAD SELL 1.4000On the daily chart, USD/CAD has stabilized and is trending upwards, with a short-term bullish bias. The current resistance level to watch is around 1.4000. This level represents a potential shorting opportunity based on a bearish cypher pattern; consider shorting once this level is reached.
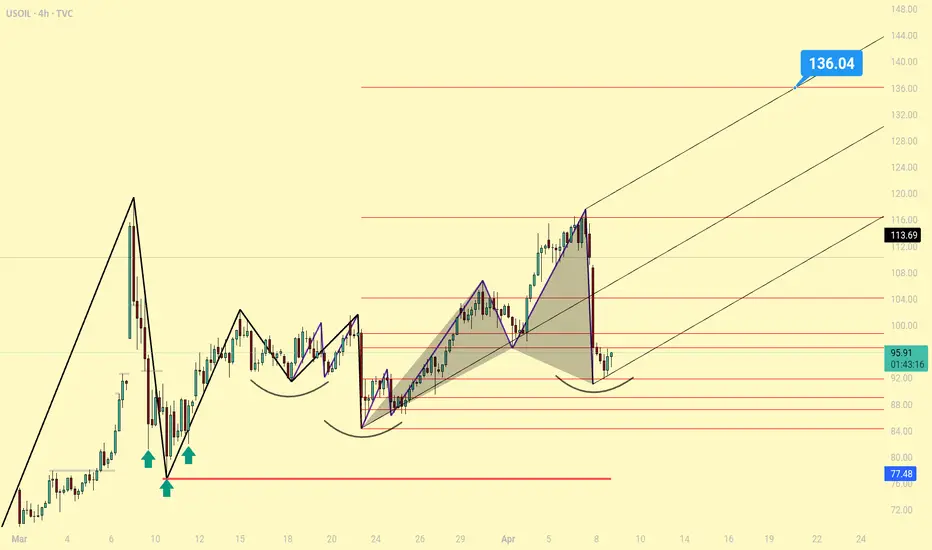
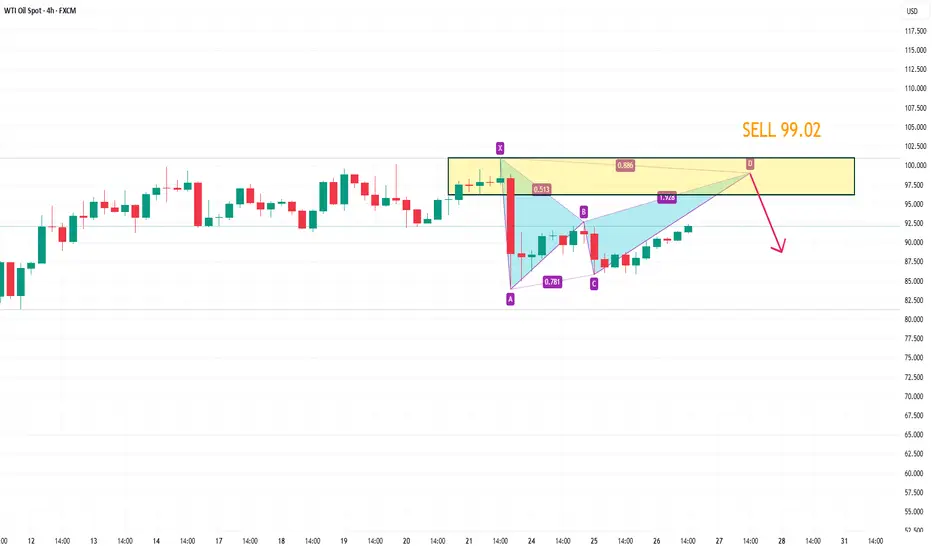
USOIL SELL 99.02On the 4-hour chart, USOIL has stabilized and is trending upwards, with bulls holding the upper hand in the short term. Currently, attention should be paid to the resistance around 99.02, which is a potential shorting entry point for a bearish bat pattern and is also located within a previous supply zone.