Huntin Wabbits 2.0 - The Doc Sees What's UpPalantir is coming into that death zone if the market doesn't see a recovery soon. If seen, the PA at 161-157(VPOC) will let us know if we dip to $126-$124 again.
Taking a look at this weekly volume profile, the most value for buyers would be at the $115 area.
I'd sell my wife and kids to buy that dip. Jk, I'm single ladies ;).
If price falls and is maintained below the VPOC this simply means that sellers have taken control. Continuation below there and the stock gets Burry'd.
Rectangle
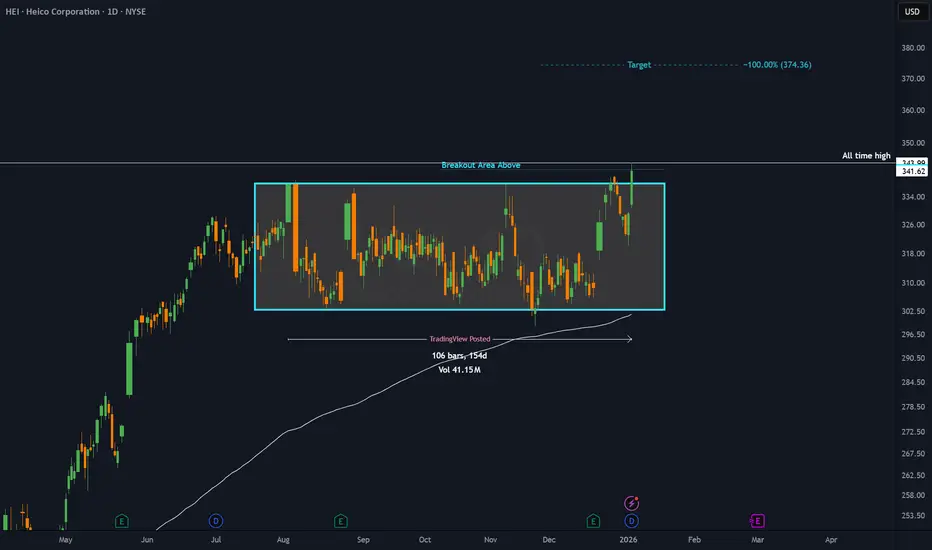
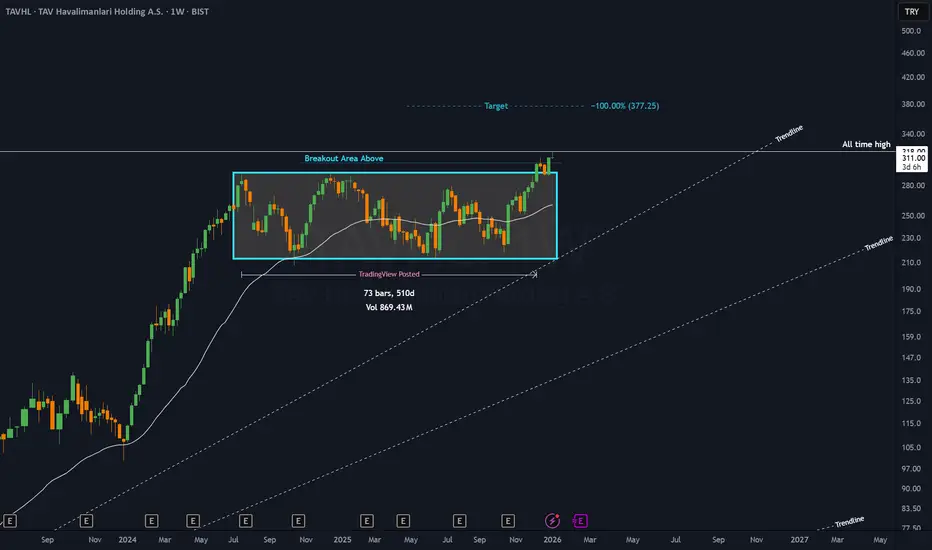
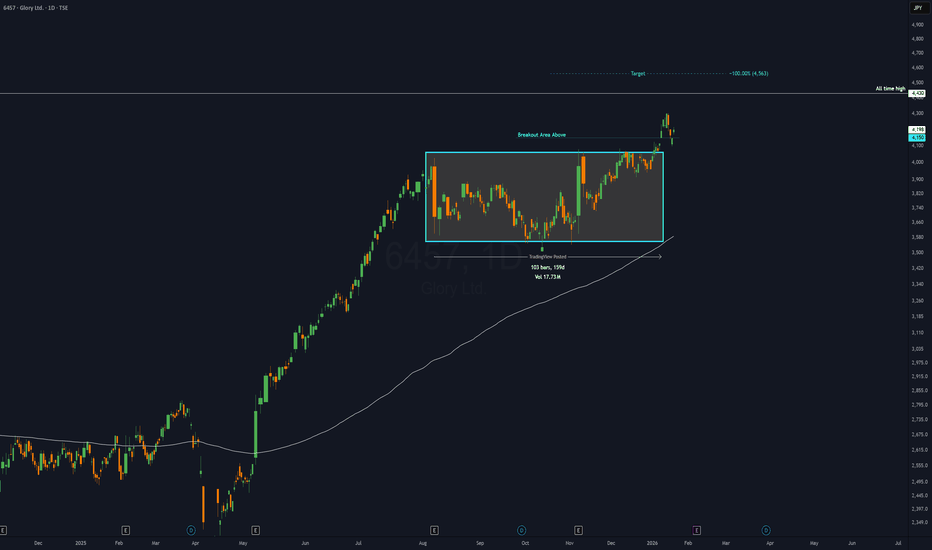
AVHOL/USDTRY 90% potentialreversal from bottom of the range. on the watch for conservative entry on the downtrend resistance retest. no entry unless the reversal is confirmed 🚫.
stop below daily region close
take profits at upper range & stops to entry.
close position at rectangle target.
⚠️ not a financial advice - DYOR
Thyrocare Long - ATH BreakoutThe Chart says it all.
Thyrocare is displaying strong #bullish #momentum, breaking out confidently after a solid period of #accumulation.
The structure is clean—consecutive higher highs and higher lows keep the #uptrend firmly intact.
Price has surged above key resistance levels, turning them into support, and is now marching toward multiple #swing and long-term #targets.
Overall, the chart reflects renewed strength, buyer dominance, and clear upside potential as the trend continues to build. 🚀📈
Levels and Targets in chart.
Disclaimer:
I am not a SEBI-registered advisor. The analysis shared is purely for educational and informational purposes and should not be considered investment or trading advice. Please consult a SEBI-registered financial advisor before making any investment decisions.
Trading and investing in the markets involve risk; you should perform your own research and due diligence.
BULLISH ON XAUUSDBullish Momentum Ahead.
-Touch/Retest on the previous support.
-Im still expecting a drop before or after highlighted move (later on in the day if not week)
-With that being said im still expecting crazy market movement (fake outs;wicks etc)
-Bullish Confirmations:
4HR TF touch on rectangle support zone.
1HR TF new buy candle formed & closed above.
15MTF continuation flag.
-Anything can still happen; hence im expecting to types of entries.
Lets see....
Disney Wave Analysis – 14 November 2025
- Disney falling inside impulse wave (1)
- Likely to fall to support level 100.00
Disney continues to fall inside the wide weekly sideways price range from the middle of 2022, as can be seen from the weekly Disney chart below.
The price earlier broke below the support level 110.00 (which stopped the previous impulse wave i) – which accelerated the active impulse wave (1).
Given the long-term downtrend, Disney can be expected to fall further in the active impulse wave (1) to the next round support level 100.00.
Tesla Macro Chart - Monitor PA @ Gap and Box midpointWatching to see what happens to tesla at the daily gap below and the box midpoint.
Again there could be a look below and fail of the pictured inner box but the failure at the top of this box says that we should be heading lower.
If the gap fill happens and it continues past $384, things could get musky.
CAD/JPY: Multiple Time Frame Analysis & PlanFollowing a breakthrough of a significant daily structural resistance yesterday.
📈CADJPY is currently consolidating within a horizontal range on an hourly timeframe.
For those seeking an intraday buying opportunity, a bullish breach of the range's resistance, specifically an hourly candle closing above 110.65, would provide a strong bullish confirmation.
A subsequent bullish continuation would then be anticipated, at least to the 111.00 level.
US100 | Building Liquidity for a Potential Push Toward 26,000NASDAQ (US100) is consolidating between 25,400–25,750, forming a potential accumulation zone below short-term liquidity. A clean break and retest above 25,750 could trigger a bullish expansion toward the 26,000–26,200 range, where major buy-side liquidity sits.
Market Structure:
Bias: Bullish (HTF structure shifting higher)
Key Demand Zone: 25,400 – 25,450
Breakout Zone: 25,750
Target Zone: 26,000 – 26,200
Invalidation: Below 25,400
Concepts: Liquidity Grab | Market Structure Shift | Demand Zone | Breaker Block | Smart Money Flow
LYFT 1W from losses to profit investors believe,but for how longLYFT broke out of its long accumulation range between $8 and $20 and is now consolidating above the breakout level. The “breakout + retest” structure remains intact, with $20–21 acting as key support. A golden cross on the weekly chart confirms a shift toward bullish momentum. As long as price holds above $20, targets stay at $33.33 and $48.48.
Fundamentally , Lyft is in its strongest position in years. In Q3 2025, the company reported its first net profit of about $46 million after years of losses. Revenue grew 11% YoY to $1.68 billion, gross bookings rose 16%, and adjusted EBITDA reached roughly $139 million (+29% YoY). Active riders climbed past 28 million, average revenue per user increased, and corporate and premium rides strengthened overall performance. Cash flow improved, debt levels declined, and operating margins continued to expand.
The main challenge lies in competition and pricing pressure from Uber, as well as in sustaining profitability beyond a single quarter. While optimism is reflected in the stock price, consistent financial performance is now critical for further upside.
Technically, holding above $20 keeps the bullish setup valid. Any pullback toward $21–20 may offer a buy-the-dip opportunity with targets at $33 and $48.
Lyft finally turned profitable - now the real test is proving that growth isn’t just a quarterly anomaly.
DAX index Wave Analysis – 12 November 2025
- DAX index reversed from support level 23500.00
- Likely to rise to resistance level 24695.00
DAX index recently reversed with the daily Hammer from the support level 23500.00 (lower border of the sideways price range inside which the index has been moving from July, as can be seen from the daily DAX chart below).
The support level 23500.00 was strengthened by the lower daily Bollinger Band.
Given the clear daily uptrend, DAX index can be expected to rise further to the next resistance level 24695.00 (upper border of the active sideways price range, which stopped earlier waves (3) and B).
GOLD BLOODBATH | 4103 so close | TradeWithMKY🚨 **GOLD JUST HIT MIRACLE SHOT SUPPORT @ $4,001**
📉 **-0.11% today, but SMART MONEY LOADED AT $3,990–$4,010**
🧠 **What the chart says (3H):**
- **Smart Money Footprint** = Dark pool accumulation zone
- **Red Warning Line** = $3,990.251 → **DO NOT BREAK**
- **Green Support** = $4,001.275 → **Bounce or Die**
- **First Target** = $4,175 (All-time high retest)
⚡ **Miracle Shot™ Indicator NOW PUBLIC**
👉 Search: `Miracle Shot by TradeWithMky` → Add to chart
📢 **Comment "GOLD" below → I pin you & send NEXT signal in DM**
💥 **Backtested 2025: 11/11 wins on Gold**
> Last hit: **$3,800 → $4,050** in 72 hours
⚠️ **Not financial advice. DYOR.**
#Gold #XAUUSD #MiracleShot #SmartMoney
XAUUSD | Breakout Above Supply Zone – Targeting 4140–4150 NextGold has successfully broken above the supply zone (4020–4060), confirming a bullish structure shift after multiple rejections in the past week. The clean breakout now opens the path for a liquidity grab toward 4140–4150, aligning with higher timeframe inefficiencies.
Trade Plan:
Entry Zone: Retest of 4040–4060 (previous supply turned demand)
Bias: Bullish continuation
Target 1: 4129 (intra-day liquidity level)
Target 2: 4153 (major HTF resistance)
Invalidation: Below 4020
The Swing Strategy, I been usingZone‑to‑Zone Trading
1.1 Drawing the Zones
What is a zone?
A price area (not a single line) where the market repeatedly reacts: flips from support→resistance (S/R) or resistance→support (R/S), stalls, or coils.
Priority by timeframe:
Monthly ≥ Weekly ≥ Daily ≥ Hourly. Higher‑timeframe zones carry more weight.
How to mark zones
Start on monthly, and highlight obvious S/R bands.
Drill down to weekly, refine, or add.
Drill down to daily, refine, or add.
Drill down to hourly for tactical entries.
Clues for a quality zone
Prior breakout level that later flips to S/R on retest and consolidates before resolution.
Clear historical reaction clusters (wicks, bodies, or gaps).
Visible “sensitivity” (multiple rejections/holds in the same area).
1.2 Trading the Zones
Entry: Wait for local consolidation near a zone, then take the breakout.
Stops:
Conservative: Below the box low (consolidation floor).
Tight: Mid‑box (accept higher stop‑out rate, better R).
Filter:
Longs only above 50 SMA, shorts only below 50 SMA (trend filter).
1.3 Range vs. Exact Level
Treat zones as bands, not one price tick. I would take the pivot close to the opening of the first red candle if it's a bullish pivot.
At times a single line is acceptable (e.g., clean, repeated close‑basis pivot), but default to ranges.
2) Box System
2.1 Market Phases
Sideways (consolidation) → build energy (boxes form between zones).
Trending → series of HH/HL (up) or LH/LL (down).
2.2 Trend Structure
Trends breathe via consolidation → expansion → consolidation.
Breakouts can:
Go with no retest
Retest the boundary and go
Brief incursion back into box, then full resolve
The first inner zone inside the box is critical: if a new uptrend is valid, the price shouldn’t revisit below it.
Stops: below that first inner zone.
Note: Zone‑to‑Zone shines in non‑trendy markets (FX, many dividend names).
2.3 Types of Boxes
MA roles (fractal):
9 SMA → short‑term momentum
50 SMA → intermediate momentum
21 SMA → the inflection between 9 and 50; often reacts first
2.3.1 Base Box
Both the 9 & 50 SMA flatten for an extended period.
Highest stored energy; breakouts can start major trends.
2.3.2 50 SMA Box
Sideways price, 9 SMA flat, 50 SMA rising/falling into price as dynamic S/R.
Breakout after the 50 SMA reaches the box.
2.3.3 9 SMA Box
Shorter coil (≈ 3–4 candles).
9 SMA catches up; breakout follows.
Shortest consolidation; quicker moves.
2.3.4 9 vs 50 Comparison
9 SMA trend: 2× HH/HL supported by 9. Parabolic (≈20% of cases): each candle’s low should not undercut the prior candle’s low.
9 SMA box: brief sideways until 9 SMA “tags” price → quick reaction.
50 SMA boxes: longer coil; 50 “arrives,” 9 often flat.
Base box: 50 is inside & flat; price crossed above/below multiple times.
2.4 System Objectives Checklist
Trend-following or mean-reversion?
Entry conditions?
Exit logic?
System expectancy?
Risk model?
Entries
Box breakout (bullish): Prefer consolidation at the top‑right of the box before break → higher probability.
Zone‑to‑Zone: Look for a lower‑TF coil at a higher‑TF zone → break of coil for entry.
Profit & Exits
Next zone target; or
Exit when an uptrend fails to make an HL (i.e., breaks prior swing low).
Stops
Box breakout: Below the first inner zone or box low.
Zone‑to‑Zone: Based on the lower‑TF coil used for entry.
Position Size = 4% per trade or less.
2.5 Trading the Boxes
Four box archetypes: 9 SMA, 21 SMA, 50 SMA, and Base.
Base Box
More false starts; longest runs when it goes.
Prefer equity or bull‑put spreads; ride while price > 50 SMA.
50 SMA Box
The first 50‑box after a base is the most reliable.
Daily 50‑box usually follows 3–4 weeks of coil; expect ≈1.5–2 weeks of trend leg.
Tactics: Stock and swing options (expiry ≈ coil length or slightly more).
9 SMA Boxes
Breakout leg ≈2–3 days, then another coil.
Tactics: Scalps with 1–1.5 weeks to expiry; 1–2 OTM strikes.
Quick Summary
Base: most power, least timing precision.
50: first after base = best reliability; second is weaker.
9: short, sharp, tactical.
2.6 Overall Market Environment
If indices trend up above the latest daily zone, 8/10 breakouts can succeed.
If indices chop under the latest daily zone, expect ≈5/10 to work.
Compare QQQ vs. SPY strength to gauge risk‑on/off.
Rules of thumb
Upside bias: Index above the latest daily zone (or proxy 9 SMA if approximating).
Scalping bias: Above the latest hourly zone.
2.7 Box System & Long‑Term Investing (LTI)
Markets are fractal; weekly = daily = hourly in pattern, not speed.
Trend rule: in an uptrend, price should not break prior swing low (mirror for downtrend).
Trailing stop logic
Uptrend: trail to recent swing low once confirmed.
Downtrend: trail to recent swing high.
MA benchmarks:
Hard breaks of 9 SMA → likely consolidation.
50 SMA for longer bias.
Caveat: large‑cap growth rarely trends cleanly down (index dependency & fund flows).
2.8 Watchlist Creation
Three steps
Scan sectors for consolidations (boxes).
Check relative strength vs. SPY (e.g., XLK/SPY).
Review the top 10–20 holdings.
Tiers
A‑List: Box about to break + high options liquidity.
B‑List: Box about to break but low options liquidity.
C‑List: Boxes are still developing.
2.9 Role of the 21 SMA
Acts as the inflection between 9 and 50.
The highest failed‑break probability occurs at 21 boxes.
After a 9‑trend ends, watch 21 for the reaction:
Back to recent highs and breaks, or
Failed break; or
Reject at 9 after 21 reactions.
2.10 SPX Intraday Scalp Pattern
Don’t chase the open; wait 1–2 hours for the market to form an intraday box (2–3 h coil).
Enter as the range breaks: you benefit from direction and rising IV (“double whammy”).
2.11 SQUEEZE Pro Indicator (SQZPRO)
Concept: A squeeze occurs when Bollinger Bands compress inside the Keltner Channels (BB inside KC) → energy building.
Dot codes (suggested):
Green: No squeeze
Black: Mild squeeze (BB within 2 ATR KC)
Red: Tight squeeze (BB within 1.5 ATR KC)
Yellow: Very tight (best odds for expansion)
Heuristic: The tighter the compression, the stronger the potential release.
2.12 Backtesting & Strategy Creation
Use TradingView Replay. Segment by regime (bull, bear, or chop).
Test entries, exits, and risk variants.
Purpose: build statistical confidence to keep your “monkey brain” from hijacking.
2.13 QQQ vs SPY for Intraday
SPY: S&P 500 (market‑cap weighted, broader economy).
QQQ: NASDAQ‑100 ex‑financials (tech‑heavy, risk‑on).
Scenarios
Bullish clean: QQQ > SPY, and both above hourly 9.
Bearish clean: QQQ < SPY, and both below hourly 9.
Chop, green day: Market up but QQQ < SPY → grindy.
Chop, red day: Market down and SPY < QQQ → grindy.
Read strength: Compare % change vs prior close.
2.14 Gaps: What & Why
Markets aren’t 24/7; exogenous events (earnings, geopolitics) reset expectations → open ≠ prior close.
How to trade gaps
Treat the gap range as support (gap‑up) or resistance (gap‑down); draw a gap box.
Unfilled gaps are potent S/R. Above, a bullish gap favors continuation until filled.
If the gap is huge, rely on historic zones to seed new levels within.
2.15 Scalps vs Swings
Scalps: minutes–hours; TF ≤ 1h.
Swings: days–weeks; TF ≥ 1h (prefer daily baseline).
Drill down one TF for refined entries; manage to the anchor TF.
Expiration (rules of thumb)
Stocks (scalps): Mon/Tue → same‑week; Wed/Thu/Fri → next‑week.
Indices (scalps): 1–2 DTE, 1–2 OTM.
Swings: Expiry ≥ consolidation length (often 1–1.5× coil duration).
2.16 Which Timeframe Should You Trade?
Real Trading Hours, 1-2 HR → Day trading & scalps (≤1h TF).
After Hours, 1–2 hr → Swings (≥1 hr, ideally daily).
Less than 1 HR → Multi‑week swings or LTI (weekly charts).
GOLD (XAUUSD): Deep Consolidation
This week is very slow for Gold.
The market is stuck within a wide horizontal range on a daily time frame.
With the absence of high impact US fundamentals, I think that probabilities will be high that the market will keep consolidating.
The best strategy to follow for now is to look for trading opportunities from the boundaries of the underlined parallel channel: selling from the resistance and buying from the support after a confirmation.
As the price is closer and closer to the resistance, wait for its test and then look for selling.
That is the plan so far.
❤️Please, support my work with like, thank you!❤️
I am part of Trade Nation's Influencer program and receive a monthly fee for using their TradingView charts in my analysis.
Webull Chart - Robinhood Competitor?Calling all matadors, we got a bull to corral.
I've charted some levels of interest for a speculative hold. Many view webull as a potential competitor for robinhood, although fundamentally, bull is in no-where near in the financial position that hood is in terms of free cash flow and expenses (or innovation as far as I've seen).
This could make a great swing trade on pure technicals. If the brokerage industry sees a period of exuberance(like we've seen in the quantum space), bull could catch a bid. This could also occur if we see a rotation out of hood.
I would love to pick up some shares or calls if the name completes a look below and fail of the anchored volume profile's value area low(around $12.28). or a LBAF of the box bottom @ $10.20.
So far webull has been consolidating. I believe a hold above the VPOC (volume point of control @ $15.43), a breakout of the lower boxes and reclaim of the larger upper box around $18.33-$18.87, could see a push to the mid 20s and 30s at least.
If we are following box rules for that potential trade, then I would not be surprised if bull goes to the box midpoint @ $48.97.
If this thing holds above the VPOC around $15.43 or does a LBAF of either $12.28 or $10.20 it's ripe for picking imo.
Now this is pure speculation, and my analysis could be a shack of shit, who knows, BUT if these set ups present themselves, I would like to roll the dice.
~ The Villain
EURAUD Wave Analysis – 4 November 2025
- EURAUD reversed from support level 1.7600
- Likely to rise to resistance level 1.8085
EURAUD currency pair recently reversed from the support zone between the support level 1.7600 (lower border of the narrow sideways price range inside which the pair has been trading from June) and the lower daily Bollinger Band.
The upward reversal from this support area stopped the previous short-term impulse wave A.
Given the strength of the support level 1.7600 and the bullish euro sentiment seen today across the FX markets, EURAUD currency pair can be expected to rise to the next resistance level 1.8085 (upper border of the active sideways price range).
Updated BTC Box - BTC Box 2.0Hella levels to this shit.
BTC's been struggling in the upper box for a while.
Previously achieved a look below and fail but could not go beyond the box's midpoint.
To summarize a bullish event occurred without producing a bullish result. That is objectively bearish to me.
I would like to see how BTC reacts to the previous lows and if we revisit that old bear trap from a year ago.
Maybe we get another look below and fail but I will continue to evaluate.
For now I just want to share the updated levels.
EURCAD: Consolidation Trading 🇪🇺🇨🇦
EURCAD is trading in a horizontal range.
The price has just tested its support.
There is a high chance that the price will bounce from that
and reach a resistance of the range soon.
Goal - 1.621
❤️Please, support my work with like, thank you!❤️
I am part of Trade Nation's Influencer program and receive a monthly fee for using their TradingView charts in my analysis.