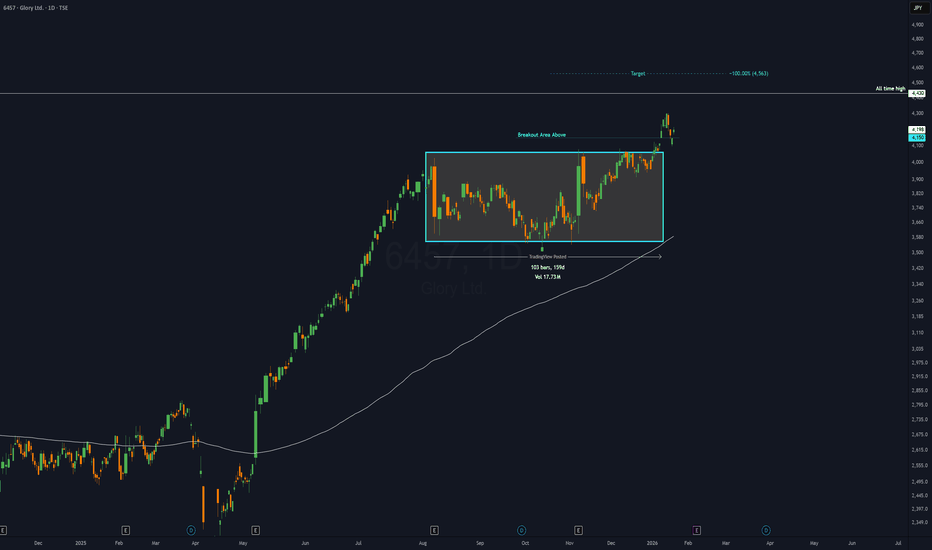
6457 - 5 months RECTANGLE══════════════════════════════
Since 2014, my markets approach is to spot
trading opportunities based solely on the
development of
CLASSICAL CHART PATTERNS
🤝Let’s learn and grow together 🤝
══════════════════════════════
Hello Traders ✌
After a careful consideration I came to the conclusion that:
- it is crucial to be quick in alerting you with all the opportunities I spot and often I don't post a good pattern because I don't have the opportunity to write down a proper didactical comment;
- since my parameters to identify a Classical Pattern and its scenario are very well defined, many of my comments were and would be redundant;
- the information that I think is important is very simple and can easily be understood just by looking at charts;
For these reasons and hoping to give you a better help, I decided to write comments only when something very specific or interesting shows up, otherwise all the information is shown on the chart.
Thank you all for your support
🔎🔎🔎 ALWAYS REMEMBER
"A pattern IS NOT a Pattern until the breakout is completed. Before that moment it is just a bunch of colorful candlesticks on a chart of your watchlist"
═════════════════════════════
⚠ DISCLAIMER ⚠
The content is The Art Of Charting's personal opinion and it is posted purely for educational purpose and therefore it must not be taken as a direct or indirect investing recommendations or advices. Any action taken upon these information is at your own risk.
Rectangle
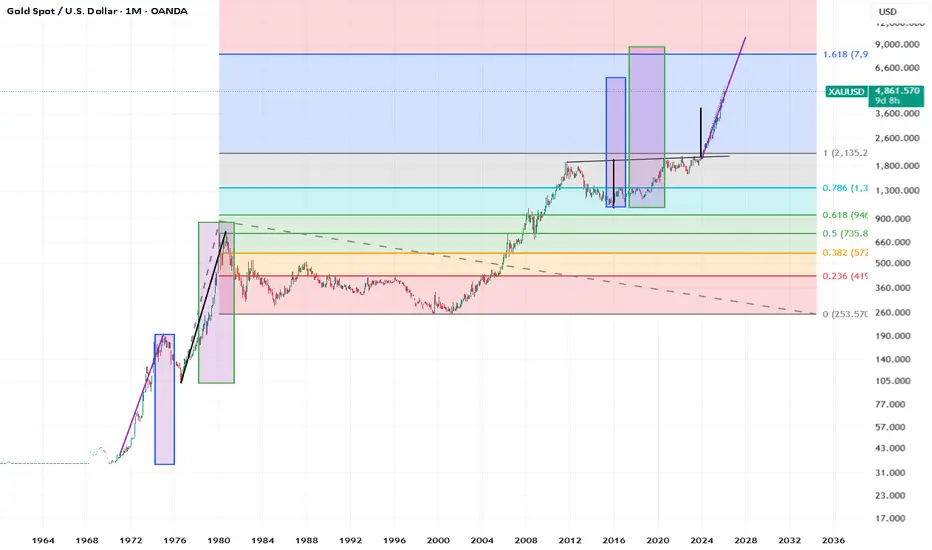
Gold is accelerating at same rate as prior cycles big picture Bullish Gold
how far will gold move to? this shows it could go over 8k?
Yes there are big round numbers out there
But if it scales like last time maybe we get another chance to add soon
Then wheres the top Elliot 5th wave top ?
Have a look at the boxes to give you some perspective how far gold could travel and still be in the same remit similar to what it did in the past.
Same works for Silver
Long term 15k or even 25k looks like big real numbers but first its got to do 5k and 10k
Chart needs cleaning up for exact numbers just was drawn fast to look at big picture to see how far the gold and silver miners could keep running for as they lag.
How many gold and silver miners were in the top 100 companies or top 10 last time around? and look to see if a similar amount are there again. As a relative comparison I guess would be sensible Using fib exertion tool on the monthly often you see price reach one of the key fib numbers and then inflect and gold likes Fib numbers historically.
Tokyo Trap ResolutionOn the 15-minute timeframe during the Tokyo session, a defined BSB trap bar has been identified and is serving as the current bar of focus. Price action is now being monitored for a decisive close outside of this trap zone to establish direction.
15-Minute Chart Highlights
• BSB trap bar clearly identified
• Swing high defines bullish boundary
• Swing low defines bearish boundary
15-Minute Trade Logic
• A confirmed close above the trap swing high triggers a bullish entry targeting 10 basis points, while a confirmed close below the trap swing low triggers a bearish entry targeting 10 basis points; a close beyond the trap in the opposite direction of the active signal serves as the stop condition.
Ajanta Pharma | Box Breakout → Trend Initiation | SwingTechnical
Long consolidation between ₹2,400–₹2,800 resolved upward.
Clean breakout and acceptance above ₹2,800.
Prior downtrend invalidated.
RSI >60 confirms momentum regime shift.
Volume expansion on breakout, no rejection so far.
Levels
Buy zone: ₹2,800–2,900
Invalidation: Daily close < ₹2,750 (hard fail < ₹2,700)
Targets
T1: ₹3,450–3,550 (prior V-top / supply)
T2: ₹4,400–4,600 (measured move from base)
Fundamental support (brief)
H1 FY26 revenue +14%, US business +42% YoY.
Normalized EBITDA ~27–28%, ROCE ~33%.
Strong balance sheet, dividend + capex confidence.
Growth-focused execution, not margin gimmicks.
View
This is a post-acceptance breakout, not a chase.
As long as price holds above ₹2,800, path of least resistance is up.
Disclaimer
Not financial advice.
GOLD (XAUUSD): Another BoS
I see another bullish setup on Gold.
There is a confirmed break of structure BoS on a 4H time frame
and a violation of a resistance of a local consolidation.
The market may rise more and reach 4700 level soon.
❤️Please, support my work with like, thank you!❤️
I am part of Trade Nation's Influencer program and receive a monthly fee for using their TradingView charts in my analysis.
Selena | XAUUSD –Weekly Structure|Correction Before ContinuationFOREXCOM:XAUUSD PEPPERSTONE:XAUUSD
Market Overview
XAUUSD delivered a strong bullish expansion and is now consolidating near the upper range, signaling potential profit-taking before continuation. As long as price holds above the internal structure and demand support, bullish momentum remains valid. A deeper pullback into demand would offer healthier continuation rather than immediate breakout chasing.
Key Scenarios
✅ Bullish Case 🚀 → Shallow pullback or structure hold above demand opens upside continuation toward liquidity resting above recent highs (4,620+).
❌ Bearish Case 📉 → Failure to hold the channel and clean acceptance below demand exposes a deeper correction toward lower range support.
Current Levels to Watch
Resistance 🔴: 4,600 – 4,620
Support 🟢: 4,480 – 4,450 (Strong Buying Zone)
⚠️ Disclaimer: This analysis is for educational purposes only. It is not financial advice
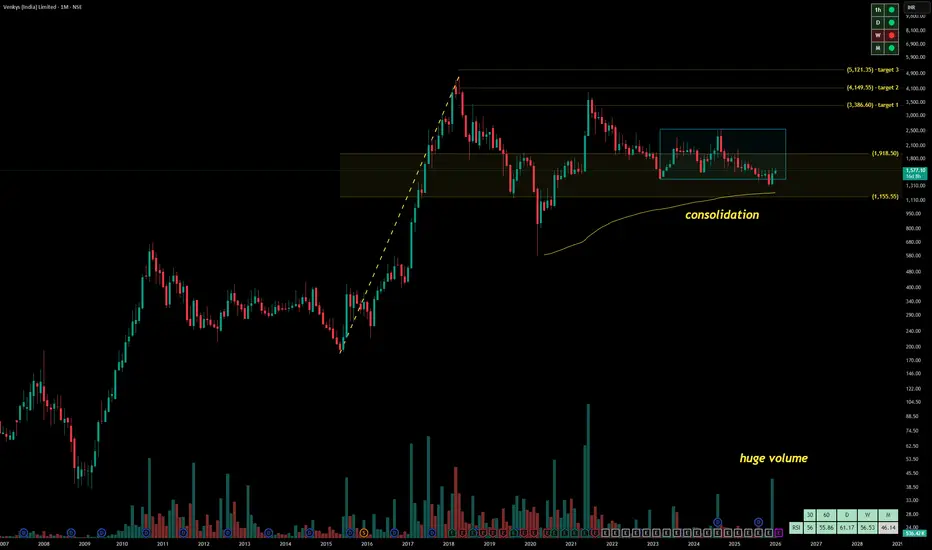
VENKYSVenky’s (India) Ltd. (CMP ₹1,577.10, -2.14%), headquartered in Pune, is India’s leading poultry and animal health company. Incorporated in 1976, Venky’s operates across poultry breeding, processed chicken, animal feed, and pharmaceutical products. It is also known for producing pathogen-free eggs used in vaccine manufacturing.
Promoter: Venkateshwara Hatcheries Pvt. Ltd. (~51.6% holding). Founded by Dr. B.V. Rao, recognized as the Father of the Indian Poultry Industry, who pioneered modern poultry farming in India.
FY22–FY25 Snapshot
Sales – ₹3,050 Cr → ₹3,420 Cr → ₹3,680 Cr → ₹3,950 Cr
Net Profit – ₹210 Cr → ₹185 Cr → ₹160 Cr → ₹175 Cr
Operating Performance – Strong → Moderate → Weak → Improving
Dividend Yield – 0.8% → 0.9% → 1.0% → 1.1%
Equity Capital – ₹14 Cr (constant)
Total Debt – ₹1,050 Cr → ₹980 Cr → ₹940 Cr → ₹900 Cr
Fixed Assets – ₹2,800 Cr → ₹3,000 Cr → ₹3,200 Cr → ₹3,400 Cr
EPS – ₹150 → ₹132 → ₹114 → ₹125
Institutional Interest & Ownership Trends
Promoter holding is ~51.6% (Venkateshwara Hatcheries Pvt. Ltd.), reflecting strong family-led governance. FIIs and DIIs have modest exposure due to Venky’s niche poultry focus. Public float is ~48%, with delivery volumes showing long-term positioning by consumer and agri-focused funds.
Strategic Moves & Innovations
Venky’s has diversified into processed chicken products, animal health supplements, and poultry feed. The company is investing in biosecurity, vaccine inputs, and pathogen-free egg production, which are critical for pharma and poultry industries. It continues to expand its retail presence through Venky’s branded outlets.
Cash Flow & Balance Sheet Strength
Operating cash flows remain stable, though margins are cyclical due to feed cost volatility. Free cash flow is modest, with reinvestment into poultry infrastructure and pharma products. Debt levels are gradually declining, reflecting disciplined capital allocation.
Risk Factors
Key risks include raw material inflation (maize, soybean), disease outbreaks in poultry, regulatory changes in food safety, and competitive intensity from other poultry and FMCG players.
Investor Takeaway
Venky’s demonstrates steady fundamentals with improving profitability, strong brand equity in poultry, and diversification into animal health and pharma inputs. While cyclical risks remain, it is positioned as a long-term niche player in India’s poultry and food processing sector.
BNB Wave Analysis – 13 January 2026
- BNB broke out of sideways price range
- Likely to rise to resistance level 1000.00
BNB recently broke the resistance area between the resistance level 910.00 (upper border of the sideways price range from November) and the 50% Fibonacci correction of the downward impulse from November.
The breakout of this resistance area accelerated the active impulse wave iii – which belongs to the medium-term impulse wave (C) from November.
BNB can be expected to rise to the next round resistance level 1000.00 (target for the completion of the active impulse wave iii).
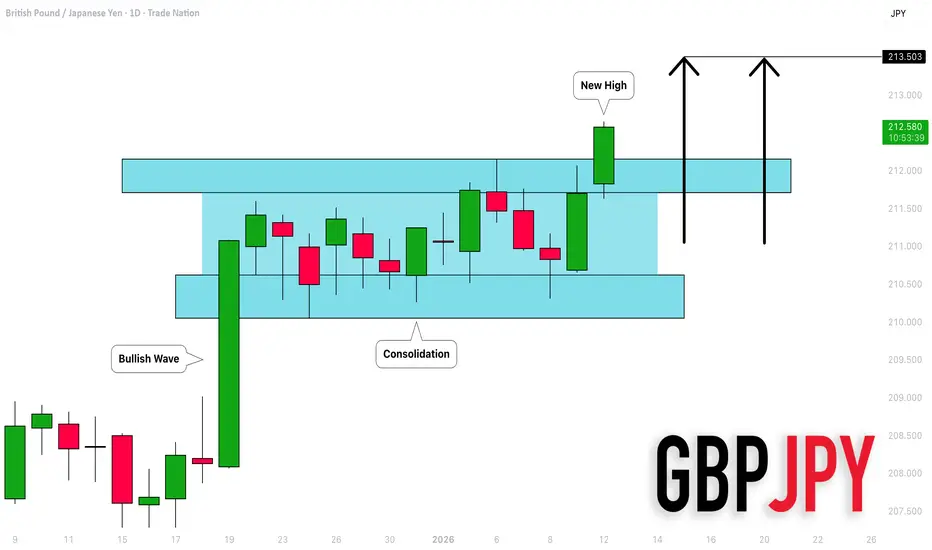
GBPJPY: Breaking Another High 🇬🇧🇯🇵
GBPJPY is breaking another high after a consolidation
and accumulation within a horizontal channel on a daily.
The market will most likely continue rising.
The next strong resistance will be 213.5.
For extra confirmation, I recommend waiting for a daily
candle close above the underlined structure before you buy.
❤️Please, support my work with like, thank you!❤️
I am part of Trade Nation's Influencer program and receive a monthly fee for using their TradingView charts in my analysis.
Chart Patterns ranked by reliability (1-8)Chart Patterns as a Strategy (Not a System)
In the world of technical analysis, chart patterns are often marketed as stand-alone trading systems. In reality, their real edge comes from probabilistic structure recognition, not prediction.
The key insight from my large-sample testing (10 years, 200,000+ patterns (Futures, FX)) is this:
Patterns don’t predict direction — they quantify structural bias once price has already revealed intent.
That distinction is what separates profitable traders from pattern collectors.
How These Patterns Were Tested (Why the Stats Matter)
All patterns discussed below were:
Only counted once fully completed
Required confirmed breaks of structure (trendline, neckline, or support/resistance)
Measured using objective projection rules, not discretionary targets
TP Rule: Full Head and Shoulder Height, using the Head distance and the right shoulder as the SL.
Full Height of triangles, and a full height for flags as well.
Twice the height of the Channel as TP, and Time TP for Channels, for half of the duration of the it.
Rectangles were Full Box Width as TP, and a time-based TP of 1/4 the Length.
It could be trailed further, but some such as Rectangle TP made great mean-reversion trade.
This removes hindsight bias — a major flaw in most pattern discussions.
Continuation Patterns (Trend Context Is Mandatory).
#8. Bull & Bear Flags (~67%) (Alt. Name: Cups, Volatility Contraction Pattern)
Occur after near-vertical impulse moves, typically the 50 EMA can filter the direction.
Represent temporary pauses, not reversals.
Best when:
Flag is tight
Forms near the extreme of the impulse
Volume contracts during consolidation
Professional takeaway:
Flags are trend health checks, not entries. If a flag fails, momentum is likely exhausted.
#7. Ascending & Descending Triangles (~73%)
Market compresses against a hard level
One side shows aggression, the other absorption
Breakout confirms institutional imbalance
Use them to answer:
“Is price being accumulated or distributed?”
#6. Ascending & Descending Channels (~73%) (Alt. Name: Cups & Handle)
Wide consolidations between parallel trendlines
Stronger than flags due to time + participation
Breakouts often lead to measured trend continuation
Key insight:
Channels are delayed continuation, not indecision.
Reversal Patterns (Confirmation Is Everything)
The Joker: Double Tops & Bottoms (75–79%)
Require structural failure
Completion only occurs after neckline break
Bottoms outperform tops statistically (markets rise faster than they fall)
⚠️ Common mistake:
Anticipating the second top/bottom instead of waiting for confirmation.
The Queen: Triple Tops & Bottoms (77–79%)
Stronger due to repeated rejection
Represent exhaustion of dominant participants
Interpretation:
The market tried three times — and failed.
The King: Rectangle Patterns (~78–80%)
Flat consolidation after a trend, more than 3 touches top and bottom.
Essentially failed reversal attempts.
Breakouts often trap traders positioned against the trend, it's best to enter on retest of breakout or earlier at the Bear-Bull Midline of the Box.
Critical lesson:
Most “double tops” fail — and turn into rectangles.
The Ace: Head & Shoulders (~83%)
Why it works so well:
Clear distribution → failure → confirmation
Captures institutional exit mechanics
Neckline break aligns with order-flow imbalance
Both regular and inverted versions are the most reliable classical patterns when properly confirmed.
⚠️ Common mistake: It's easy to mistake a Head and Shoulders with another pattern like a Double or Triple Bottom if it's neckline is not broken well.
The Trap Pattern: Pennants (~55%)
Despite being taught alongside flags:
Pennants break against trend too often
Over-compression increases randomness
Lack clear structural dominance, Pivot HL are spots where trader's should sell.
Professional rule:
If it looks too tight, it’s probably a coin flip.
It's better to target Equal High and Lows to the left as TP.
How Professionals Actually Use Chart Patterns
We don’t trade patterns — we trade what they imply.
Patterns help answer:
Is the market accepting or rejecting price?
Are participants trapped or in control?
Is this continuation, transition, or reversal?
They work best when combined with:
Market structure (HH/HL, LH/LL)
Time-of-day context
Volume or order-flow
Higher-timeframe bias
Final Truth About Pattern Accuracy
Pattern Type Role Best Use
Flags / Channels Continuation Trend validation
Triangles Pressure build Breakout bias
Double / Triple Reversal Failure detection
Rectangles Continuation Trap identification
Head & Shoulders Reversal Distribution confirmation
Pennants ❌ Avoid
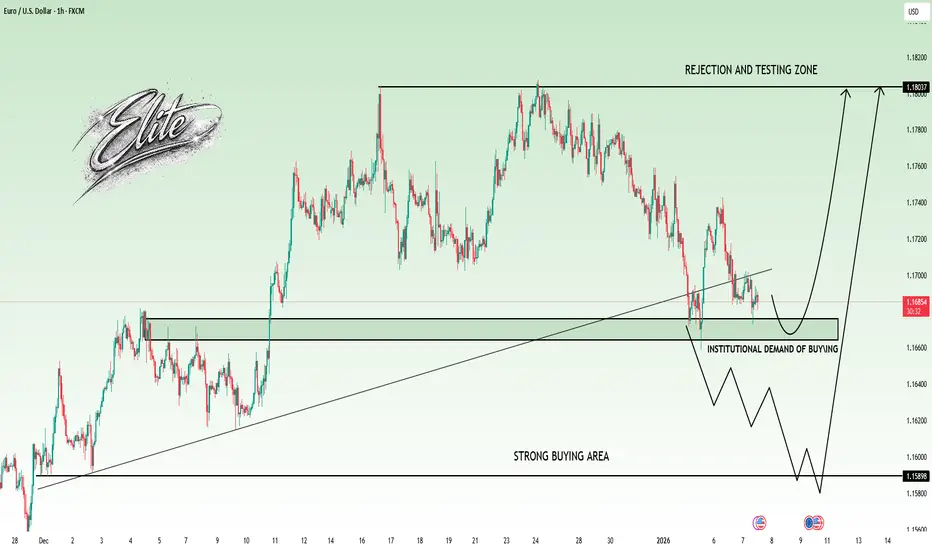
Elite | EURUSD – H1 | Pullback into DemandFX:EURUSD
After rejecting the previous high near 1.1803, price corrected into demand where buying interest has previously entered. Current price action suggests consolidation and liquidity engineering, with continuation dependent on confirmation rather than anticipation.
Key Scenarios
✅ Bullish Case 🚀
– Strong reaction from 1.1660–1.1680
– H1 close above 1.1803 → Bullish BOS confirmed
🎯 Target 1: 1.1850
🎯 Target 2: 1.1900
🎯 Target 3: 1.2000 (HTF liquidity)
❌ Bearish Case 📉
– Failure to hold demand
– Acceptance below 1.1620
🎯 Downside Target: 1.1588
Current Levels to Watch
Resistance 🔴: 1.1803
Support 🟢: 1.1660–1.1680
Invalidation ❌: H1 close below 1.1620
⚠️ Disclaimer: This analysis is for educational purposes only. Not financial advice.
One-Hour Expansion Trap
On the one-hour timeframe, market momentum has slowed as price approaches the end of the New York session, resulting in a clear expansion trap forming. Price is currently trading within a defined range created by opposing expansion zones, indicating compression ahead of a directional move.
One-Hour Chart Highlights
• Bullish expansion zone identified as supply
• Bearish expansion zone identified as demand
• Price trading within the one-hour trap zone and respecting structure
One-Hour Trade Logic
• A confirmed close beyond either the bullish or bearish expansion zone triggers a market entry in that direction with a fixed target of 10 basis points.
DAX - 7 months RECTANGLE══════════════════════════════
Since 2014, my markets approach is to spot
trading opportunities based solely on the
development of
CLASSICAL CHART PATTERNS
🤝Let’s learn and grow together 🤝
══════════════════════════════
Hello Traders ✌
After a careful consideration I came to the conclusion that:
- it is crucial to be quick in alerting you with all the opportunities I spot and often I don't post a good pattern because I don't have the opportunity to write down a proper didactical comment;
- since my parameters to identify a Classical Pattern and its scenario are very well defined, many of my comments were and would be redundant;
- the information that I think is important is very simple and can easily be understood just by looking at charts;
For these reasons and hoping to give you a better help, I decided to write comments only when something very specific or interesting shows up, otherwise all the information is shown on the chart.
Thank you all for your support
🔎🔎🔎 ALWAYS REMEMBER
"A pattern IS NOT a Pattern until the breakout is completed. Before that moment it is just a bunch of colorful candlesticks on a chart of your watchlist"
═════════════════════════════
⚠ DISCLAIMER ⚠
The content is The Art Of Charting's personal opinion and it is posted purely for educational purpose and therefore it must not be taken as a direct or indirect investing recommendations or advices. Any action taken upon these information is at your own risk.
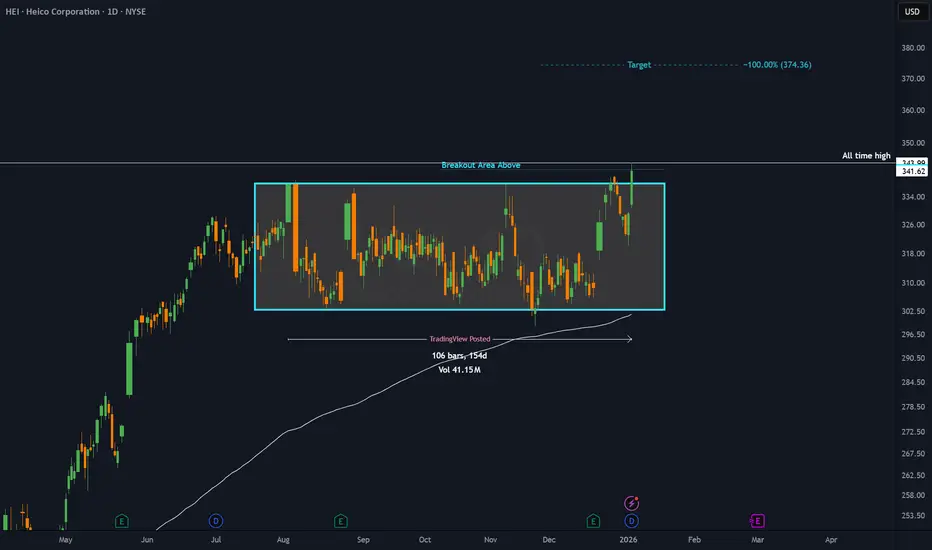
HEI - 5 months RECTANGLE══════════════════════════════
Since 2014, my markets approach is to spot
trading opportunities based solely on the
development of
CLASSICAL CHART PATTERNS
🤝Let’s learn and grow together 🤝
══════════════════════════════
Hello Traders ✌
After a careful consideration I came to the conclusion that:
- it is crucial to be quick in alerting you with all the opportunities I spot and often I don't post a good pattern because I don't have the opportunity to write down a proper didactical comment;
- since my parameters to identify a Classical Pattern and its scenario are very well defined, many of my comments were and would be redundant;
- the information that I think is important is very simple and can easily be understood just by looking at charts;
For these reasons and hoping to give you a better help, I decided to write comments only when something very specific or interesting shows up, otherwise all the information is shown on the chart.
Thank you all for your support
🔎🔎🔎 ALWAYS REMEMBER
"A pattern IS NOT a Pattern until the breakout is completed. Before that moment it is just a bunch of colorful candlesticks on a chart of your watchlist"
═════════════════════════════
⚠ DISCLAIMER ⚠
The content is The Art Of Charting's personal opinion and it is posted purely for educational purpose and therefore it must not be taken as a direct or indirect investing recommendations or advices. Any action taken upon these information is at your own risk.
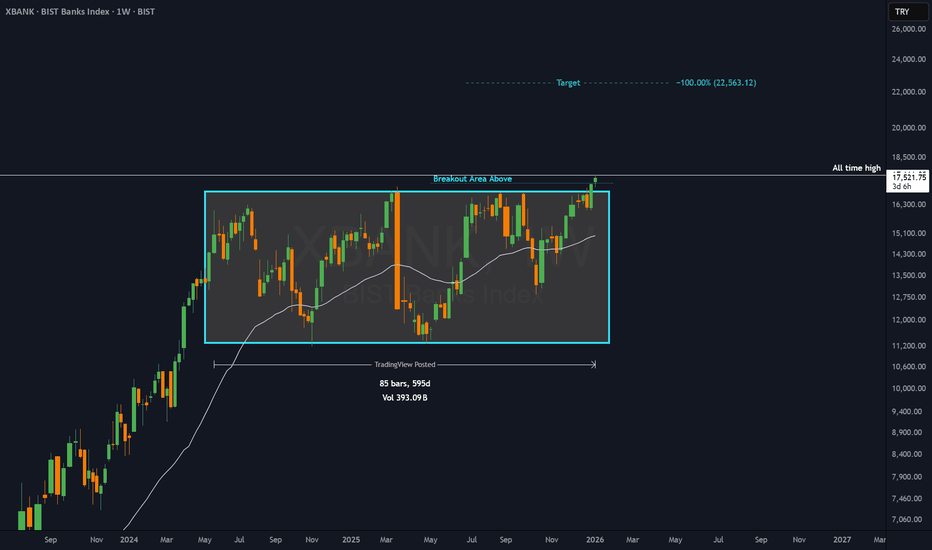
XBANK - 20 months RECTANGLE══════════════════════════════
Since 2014, my markets approach is to spot
trading opportunities based solely on the
development of
CLASSICAL CHART PATTERNS
🤝Let’s learn and grow together 🤝
══════════════════════════════
Hello Traders ✌
After a careful consideration I came to the conclusion that:
- it is crucial to be quick in alerting you with all the opportunities I spot and often I don't post a good pattern because I don't have the opportunity to write down a proper didactical comment;
- since my parameters to identify a Classical Pattern and its scenario are very well defined, many of my comments were and would be redundant;
- the information that I think is important is very simple and can easily be understood just by looking at charts;
For these reasons and hoping to give you a better help, I decided to write comments only when something very specific or interesting shows up, otherwise all the information is shown on the chart.
Thank you all for your support
🔎🔎🔎 ALWAYS REMEMBER
"A pattern IS NOT a Pattern until the breakout is completed. Before that moment it is just a bunch of colorful candlesticks on a chart of your watchlist"
═════════════════════════════
⚠ DISCLAIMER ⚠
The content is The Art Of Charting's personal opinion and it is posted purely for educational purpose and therefore it must not be taken as a direct or indirect investing recommendations or advices. Any action taken upon these information is at your own risk.
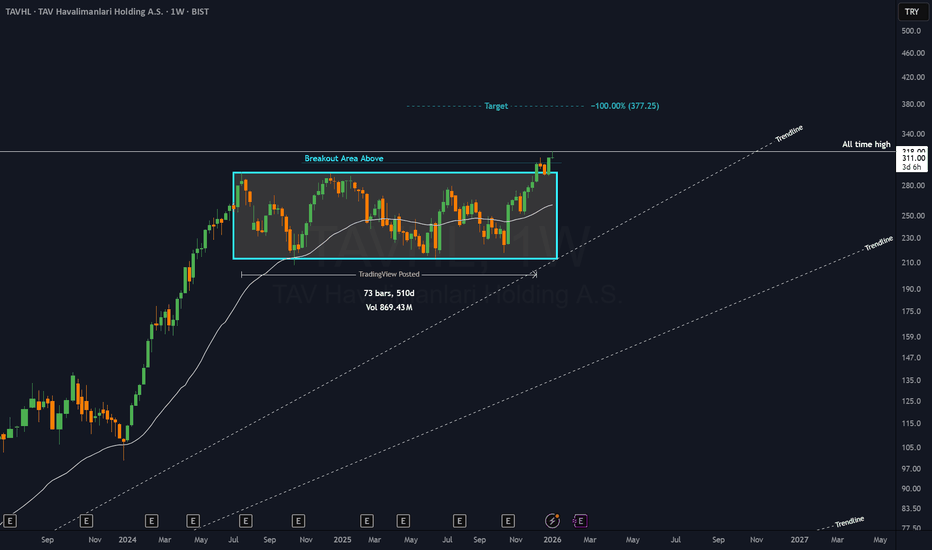
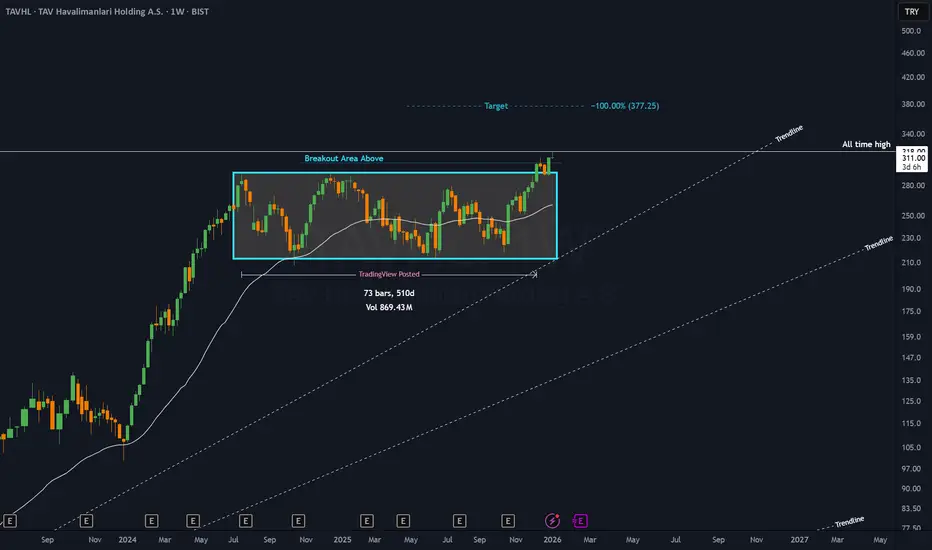
TAVHL - 17 months RECTANGLE══════════════════════════════
Since 2014, my markets approach is to spot
trading opportunities based solely on the
development of
CLASSICAL CHART PATTERNS
🤝Let’s learn and grow together 🤝
══════════════════════════════
Hello Traders ✌
After a careful consideration I came to the conclusion that:
- it is crucial to be quick in alerting you with all the opportunities I spot and often I don't post a good pattern because I don't have the opportunity to write down a proper didactical comment;
- since my parameters to identify a Classical Pattern and its scenario are very well defined, many of my comments were and would be redundant;
- the information that I think is important is very simple and can easily be understood just by looking at charts;
For these reasons and hoping to give you a better help, I decided to write comments only when something very specific or interesting shows up, otherwise all the information is shown on the chart.
Thank you all for your support
🔎🔎🔎 ALWAYS REMEMBER
"A pattern IS NOT a Pattern until the breakout is completed. Before that moment it is just a bunch of colorful candlesticks on a chart of your watchlist"
═════════════════════════════
⚠ DISCLAIMER ⚠
The content is The Art Of Charting's personal opinion and it is posted purely for educational purpose and therefore it must not be taken as a direct or indirect investing recommendations or advices. Any action taken upon these information is at your own risk.
GBPJPY: Classic Bullish Pattern 🇬🇧🇯🇵
GBPJPY violated a horizontal resistance of a narrow
accumulation range on a daily time frame.
It provides a strong bullish signal.
Expect a rise to 212.5 level.
❤️Please, support my work with like, thank you!❤️
I am part of Trade Nation's Influencer program and receive a monthly fee for using their TradingView charts in my analysis.
EUR/CAD: Bullish Continuation After ConsolidationThe EURCAD pair had been accumulating within a horizontal range on the 4-hour timeframe for over a week.
Today, its resistance was breached with a strong bullish movement.
The price may experience further growth. The nearest resistance level is at 1.6174.
BSOFTBirlasoft Ltd., incorporated in the year 1990, is a Small Cap company (having a market cap of Rs 11,799.08 Crore) operating in IT Software sector.
Birlasoft Ltd. key Products/Revenue Segments include Software Development Charges for the year ending 31-Mar-2025.
For the quarter ended 30-09-2025, the company has reported a Consolidated Total Income of Rs 1,350.93 Crore, up 2.50 % from last quarter Total Income of Rs 1,318.00 Crore and down 3.61 % from last year same quarter Total Income of Rs 1,401.57 Crore. Company has reported net profit after tax of Rs 116.10 Crore in latest quarter.
The company’s top management includes Mrs.Amita Birla, Mr.Angan Guha, Mr.Ananth Sankaranarayanan, Mr.Manish Choksi, Ms.Nidhi Killawala, Ms.Satyavati Berera, Mr.Chandrakant Birla, Mrs.Kamini Shah, Ms.Sneha Padve. Company has BSR & Co. LLP as its auditors. As on 30-09-2025, the company has a total of 27.85 Crore shares outstanding.