What a clean breakout setup looks likeOn the 1-hour timeframe, BULL is showing a textbook transition from compression into expansion, supported by alignment across structure, momentum, and participation.
Structure (EMA Alignment):
Price is now trading above the 10 / 20 / 50 EMAs, all stacked above the 200 EMA
This reflects short-term trend control with higher timeframe support building underneath
Prior consolidation phase created a tight base → now resolving higher
Momentum (RSI):
RSI holding in the upper range (~80+)
Indicates
Relative Strength Index (RSI)
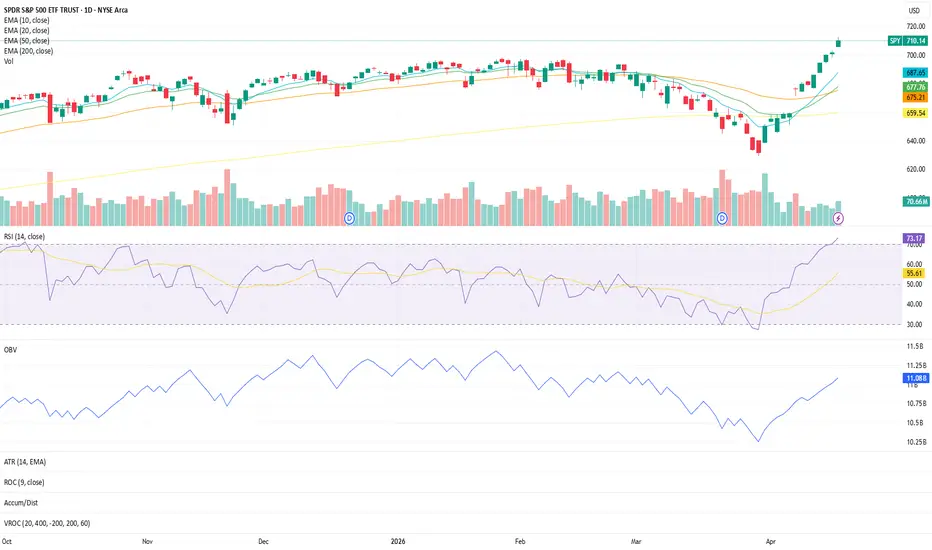
SPY Structure Update (Daily)10 and 20 EMAs have crossed above the 50 EMA and are now all trading above the 200 EMA, indicating strong short-term momentum within a confirmed bullish structure.
RSI is holding strong at 73, showing continued participation with upward momentum, but now getting into elevated territory.
OBV has been on a steady rise since late March, confirming accumulation and supporting the current move higher.
Structure remains healthy, but price is now becoming extended above short-term EMAs, which in
How To: Bearish Breakaway w/ Tools, Indicators & StrategyHey everyone, thanks for joining! Below is the Quick Notes for the audio:
What is a Bearish Breakaway?
A Rare Reversal Candlestick Pattern that consists of 5 Candles, broken up into 3 parts:
Pt 1) Large Bullish Candle
Pt 2) 3 Small Bullish Candles
Pt 3) Large Bearish Candle (Confirmation)
What indicators can be used to Confirm?
1) Volume - Dwindles after the first Large Bullish Candle then Increases after the Large Bearish Candle
2) RSI - The reversal is part of a Bullish Divergence
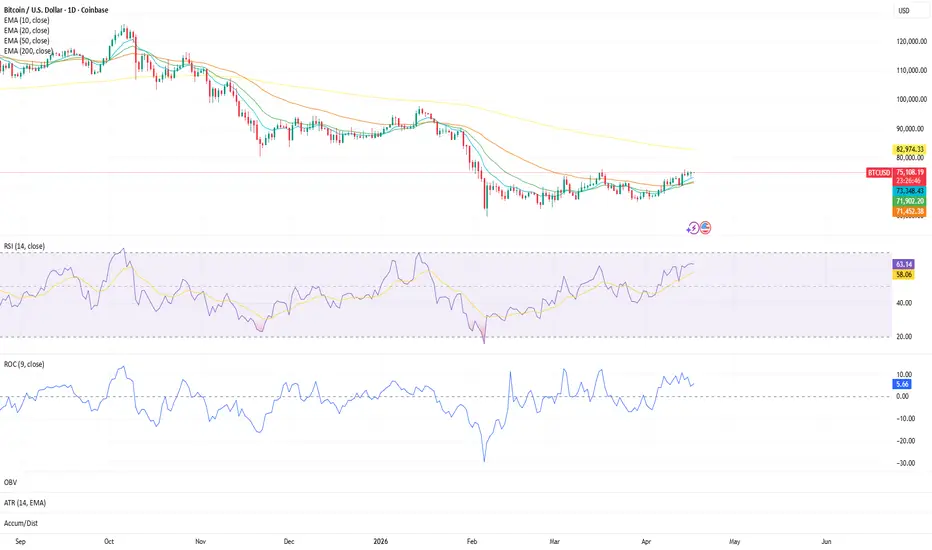
BTC Structure Update (daily)Bitcoin is starting to show signs of short-term strength as structure continues to improve.
Price has now reclaimed the 10, 20, and 50 EMAs, with the 10/20 crossing back above the 50. This shift signals building momentum in the near term and a transition away from the prior downside pressure phase.
However, zooming out, all key short-term EMAs are still positioned below the 200 EMA. That keeps the broader structure in a recovery phase rather than a fully confirmed long-term uptrend.
Momentum
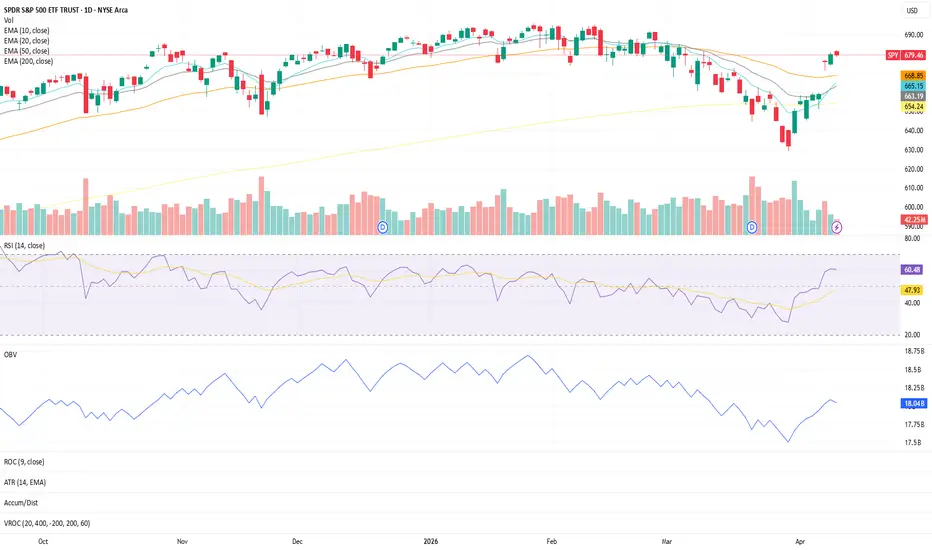
SPY Daily — Structure Holding StrongPrice continues to trade above the 10, 20, 50, and 200 EMAs, with short-term momentum building.
The 10 EMA and 20 EMA are both trending upward, showing continued short-term strength, while the 50 EMA remains flat but stable—acting as a base of support beneath price.
RSI is holding steady around 60, indicating controlled momentum without entering overbought conditions.
On the volume side, OBV has been trending higher since March 30th, suggesting underlying accumulation remains intact.
Overall
ETH – RSI Just Flipped Bullish… Déjà Vu?Looking at ETH on the higher timeframe, one thing stands out clearly:
Every time RSI prints a bullish crossover, price follows with a strong rally.
We’ve seen it multiple times before… and now it’s happening again.
RSI has just made a fresh bullish crossover from lower levels.
The question is simple:
Will history repeat itself?
⚠️ Disclaimer: This is not financial advice. Always do your own research and manage risk properly.
📚 Stick to your trading plan regarding entries, risk, and manage
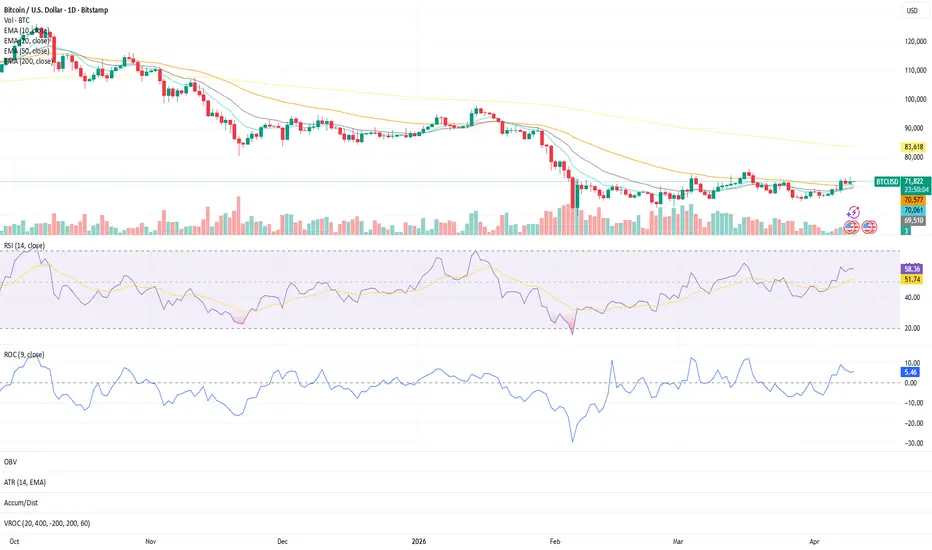
Bitcoin USD (Daily) — Structure UpdateStructure hasn’t flipped — but it’s no longer deteriorating.
Price remains below the 200 EMA, with the 10, 20, and 50 EMAs still positioned underneath it, keeping the higher timeframe trend unconfirmed.
Within that, behavior is beginning to shift.
The 10 EMA is starting to curl upward, signaling early short-term momentum. BTC has now logged two consecutive daily closes above the 50 EMA, marking a move from weakness into early stabilization.
Momentum aligns with the shift:
• RSI is holding i
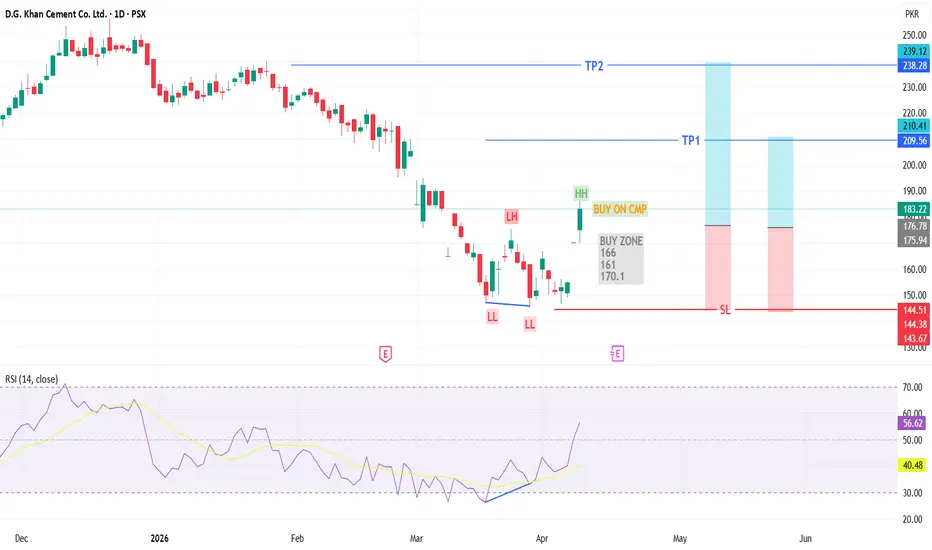
DGKCAfter a prolonged downtrend of LLs & LHs, DGKC has finally shown a market structure shift:
✅ Broke previous Lower High (LH)
✅ Strong candle close above resistance
✅ First Higher High (HH) printed
✅ Bullish divergence supporting upside
This signals a potential trend reversal / bullish continuation phase
🎯 Trade Plan
Entry Options:
Ideal: On break of LH (already triggered)
Alternative: Buy at CMP (Current Market Price)
Add positions on pullbacks / retracements
Stop Loss (SL):
Below last Lower L
Render: ready for the next leg? key levels and targets aheadRender, ready for the next leg or due a cooldown? Lately AI and GPU narratives are heating up again, and according to market chatter Render keeps popping up whenever traders talk “AI season 2.” Today price pulled back after a strong spike, but buyers stepped in fast, which tells me the dip is being hunted, not feared.
On the 4H chart price bounced off that 1.84 support block with solid reaction, while RSI cooled from overbought and curved back up above 60. Structure is still higher highs and
XRP Lovers… The Setup Is BrewingXRP is once again mirroring its previous cycle, and the structure is starting to look very familiar.
Back then, after a prolonged correction, price bottomed right as RSI dipped into oversold territory… followed by a reclaim above the signal line that kicked off a strong bullish move.
Now? We’re seeing a similar setup unfold.
Price is correcting, RSI is approaching oversold levels, and all eyes are on that signal line.
The trigger is clear:
Once RSI gets oversold and breaks back above the y
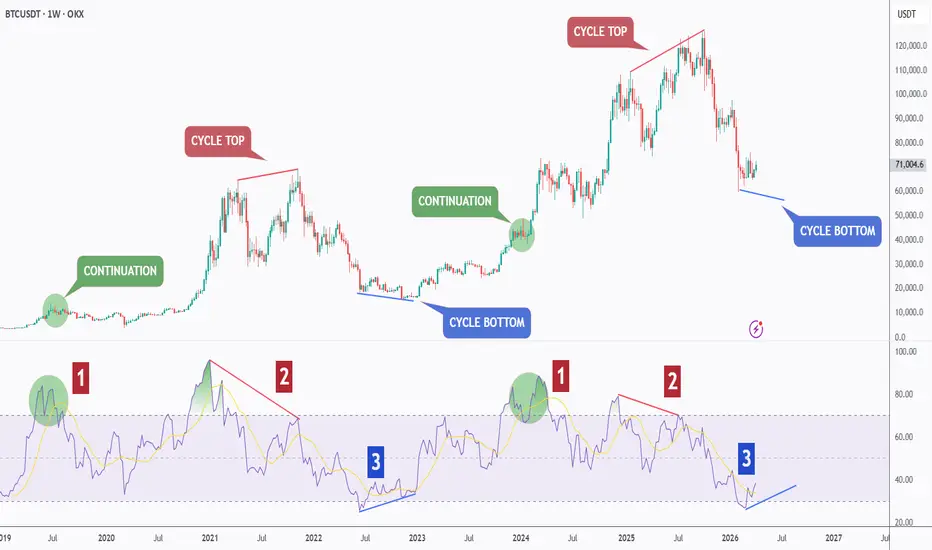
BTC Is Repeating Its Cycle… One More Move Left?Let’s keep this simple.
Bitcoin is not doing anything new.
It’s repeating.
The pattern
When you compare this cycle to the previous one…
The structure is almost identical.
• Continuation phase
• Cycle top
• Breakdown
• Corrective phase
And so far…
Price is following the same path step by step.
Where we are now
At this stage in the previous cycle:
Price didn’t bottom immediately.
It made one final move lower!
The signal to watch 🧠
RSI told the real story.
While price made a lowe
Trend + RSI Strategy - Refined (Live Example)This is a refined version of a simple trend + RSI strategy.
Core idea:
Use trend direction (EMA alignment) with RSI confirmation to improve entry quality.
What this demonstrates:
• Cleaner entry and exit signals
• More consistent structure
• Defined risk management
• Reduced noise in execution
This example shows how small structural improvements can significantly improve a basic strategy.
Key takeaway:
Most strategies don’t need to be replaced —
they need to be refined.
RSI + Trend Strategy — Refined (Better Risk & Structure)This is a real example of improving an existing trading strategy without changing its core logic.
The original strategy was functional, but had weaknesses in:
• Risk control
• Structural consistency
• Optimization balance
Instead of replacing the strategy, the goal was to preserve the original logic and improve how it performs.
🔍 What was improved:
• Cleaner entry/exit structure
• Better-defined risk handling
• More consistent execution logic
• Improved optimization profile
📊 Key takeaway:
Arbitrum: key targets and levels as demand zone holds strongArbitrum
Who’s watching this L2 while everyone chases memecoins? According to market chatter, Arbitrum keeps getting dev attention and ecosystem grants, but short term the token has been lagging majors. Today price dipped back into a key demand area while BTC volatility cooled, which is often where rotation plays quietly start.
On the 4H chart, ARB is sitting right on that green demand block around 0.90 where the volume profile shows a fat node of past activity. RSI has cooled off from overbo
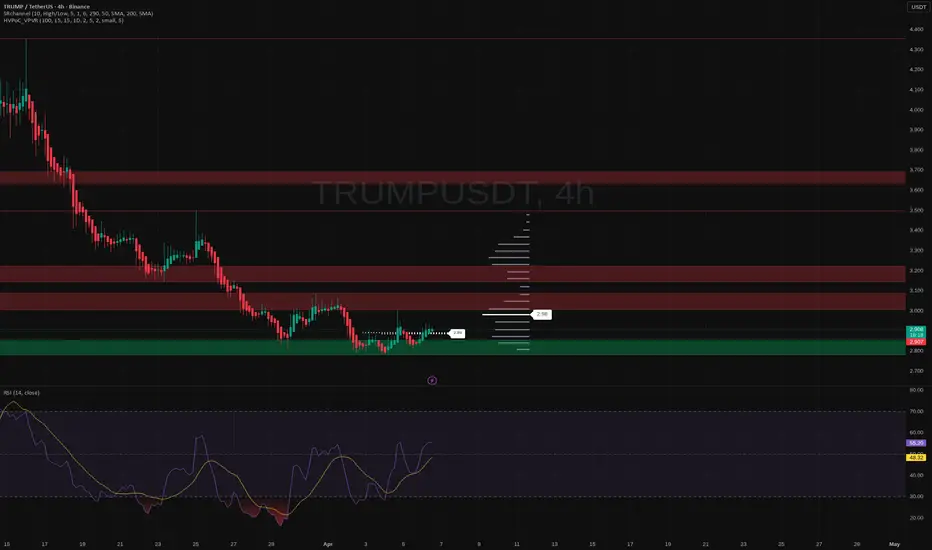
TRUMP: ready to ride the election wave? key levels to watch!TRUMPUSDT
Who’s ready to trade the election meme coin instead of reading polls all day? According to market chatter, politics‑related tokens are heating up again as headlines cycle around upcoming debates and legal drama, and TRUMP has started to attract fresh volume on Binance after that long bleed‑out.
On the 4H chart we’re sitting in a big green demand block after a brutal downtrend, with RSI curling up from oversold and pushing above the midline. Volume profile shows a fat liquidity gap a
POL: bounce potential or breakdown? key levels to observePOL – ready for one more bounce or about to fall through the floor? According to industry sources, rotation out of smaller alts has been picking up while onchain activity around POL stays modest, so price is basically drifting with overall market risk sentiment. Today we’re sitting right on that big orange demand block, so this is where bulls either wake up or surrender the range.
On the 4H chart, price is hugging the lower edge of the support zone around 0.089–0.09 while RSI is grinding near o
Kaspa: rebound or retreat? key levels and targets for todayKaspa, dip buyers still awake here or already rage-quit? Lately the project’s been in the news as one of the “fast L1s,” but price has been nuked together with the broader alt market as traders de-risk on macro fears. Today we’re parked right on a big 4H demand block where previous rallies launched, while sentiment is still washed out according to the market.
On the 4H chart I see a grind down into a green demand zone around the 0.03 area with RSI lingering near oversold and starting to curl up
Mina: chasing the breakout or waiting for a dip? Key levels aheaMina Protocol. Chasing the breakout or waiting for the dip? According to the market, Mina has been back in the spotlight after renewed interest in zero‑knowledge projects and fresh headlines about ecosystem building, and price reacted with a clean vertical rally. On this 4H chart we’ve just printed a local top near 2.8 while RSI is cooling down from heavy overbought territory.
On the 4H, price is stretched above the main value area and you can see those fat green demand zones left behind around
Ondo: cooling off or just reloading? key levels to watchOndo – is the airdrop hype finally cooling off or just reloading? After the recent buzz around tokenization narratives, price has been drifting lower while the market waits for the next headline. According to industry sources, appetite for “real world asset” plays is still there, but flows have clearly rotated into newer shiny coins this week.
On the 4H chart, ONDO is grinding down toward that green demand block around 0.25, with RSI sitting in a bearish zone but close to oversold. I’m leaning
ENA: rebound or further decline? key levels to watch todayENA
Who’s brave enough to catch this falling knife? ENA has been getting hammered after the recent listing hype cooled off, while the broader crypto market is digesting mixed headlines about liquidity and risk appetite according to industry sources. Today’s drop flushed late longs, and you can see the market clearly hunting stops below the prior range.
On the 4H chart, price is sitting in a fresh demand pocket with RSI buried around oversold, trying to curl up. I’m leaning toward a short term
Pi Network: could this be the bounce we’ve been waiting for?Pi Network. Tired of watching this bleed or hunting for that first real bounce? While the whole alt market is chopping on regulation headlines and ETF flows, Pi is quietly grinding at the lows, and according to industry sources the project is again popping up in community chatter around future listings. Volatility is crushed, which is usually when most traders look away right before something moves.
On the 4H chart, price is sitting right on that big orange demand shelf with a green “last line”
OKB: bounce or breakdown? key levels to watch this weekOKB
Who’s watching this dip into the demand zone and thinking “is this where the bounce starts?” According to industry sources, OKX ecosystem news and steady exchange volumes keep this token on the radar, even while the broader market chops around. Today price is parked right inside a big green support block after a multi‑day bleed, so this is where bulls either wake up or get steamrolled.
On the 4H chart I see a ranging structure with repeated wicks into the same support and RSI grinding jus
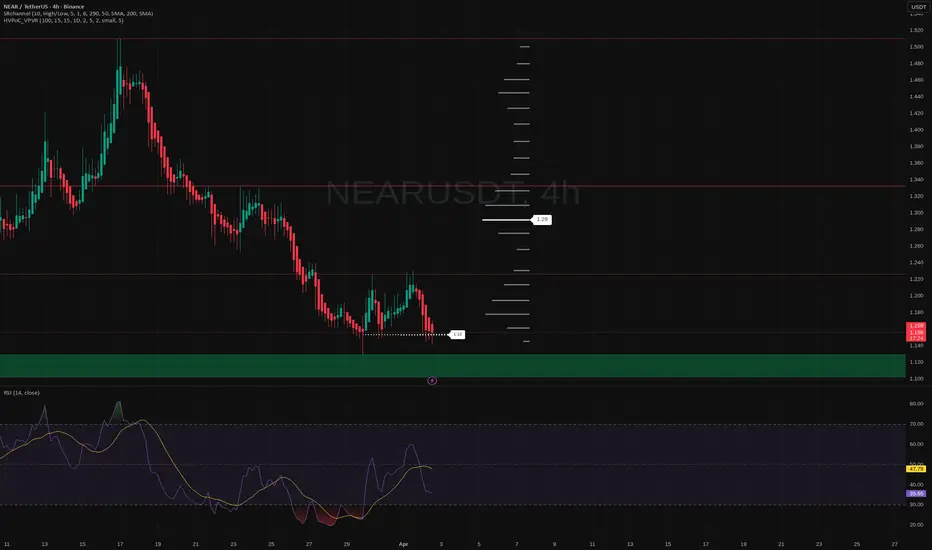
NEAR: is this the bounce we've been waiting for? key levels to wNEAR Protocol – who’s watching this support zone with me? According to industry sources, interest around layer‑1s is slowly waking up again, and NEAR keeps popping up in dev activity stats, even while price has been quietly bleeding. Today price tapped back into that big green demand block that last time kicked off a decent bounce, so this level matters.
On the 4H chart, NEARUSDT is grinding along local support around 1.15 with RSI trying to curl up from near oversold. Volume has been heavier o
BGBUSDT: ready for another dip? key levels to monitor todayBGBUSDT – ready for one more leg down before the real bounce? The token has been under pressure while traders digest the latest exchange headlines and overall risk-off mood in altcoins. According to industry sources, volumes on smaller exchange coins have cooled off, and you can see that lack of fresh buyers right here on the chart.
On the 4H chart price is stuck in that red demand zone around 1.90 with a clear series of lower highs after the last spike. RSI is hovering near oversold but with n