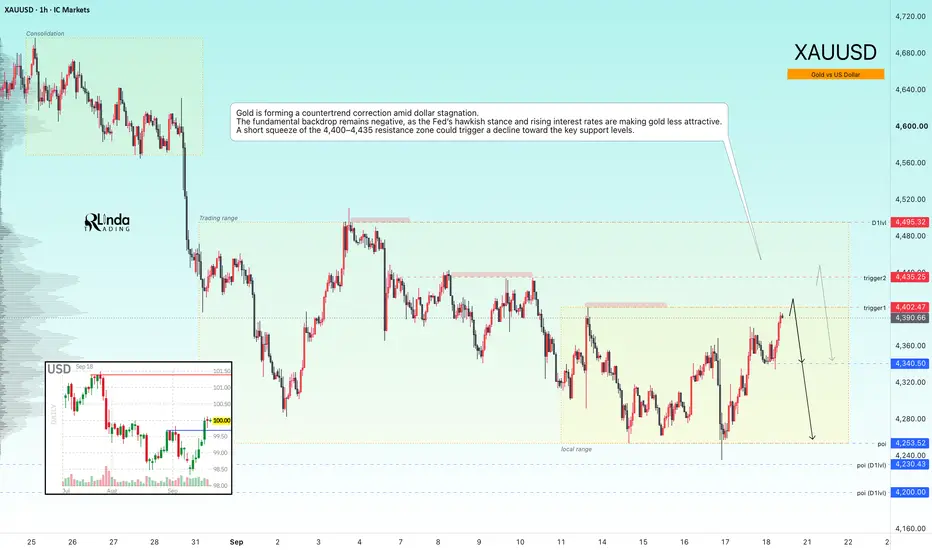
GOLD - A countertrend correction aimed at liquidity huntingICMARKETS:XAUUSD has been forming a countertrend correction toward the 4,400–4,430 liquidity zone since the session opened. The fundamental backdrop remains weak, and the market is still in a bearish trend
The dollar is stagnating after breaking through local resistance levels. The Fed’s hawkish stance and rising rates are supporting the Dollar Index, which is putting medium-term pressure on the metals market. However, the correction in oil prices is giving gold some room to recover as it tests key levels.
Gold is stabilizing, but further upside remains limited by the Fed’s hawkish outlook and geopolitical risks. The BOJ decision and developments in the Middle East will determine the short-term direction
Drivers:
Upside: further declines in oil prices and yields, de-escalation of the conflict, softer U.S. data, dovish BOJ.
Downside: escalation in the Middle East, higher oil prices, hawkish Fed stance, dollar strength
Resistance levels: 4,402, 4,435, 4,495
Support levels: 4,340, 4,253, 4,200
Gold is forming a countertrend correction amid dollar stagnation. A short squeeze of the 4,400–4,435 resistance zone — with the key focus on two triggers — could trigger a decline toward the key support levels. The formation of reversal patterns after the retest could provide a potential entry opportunity
Best regards,
R. Linda!  Short
Short
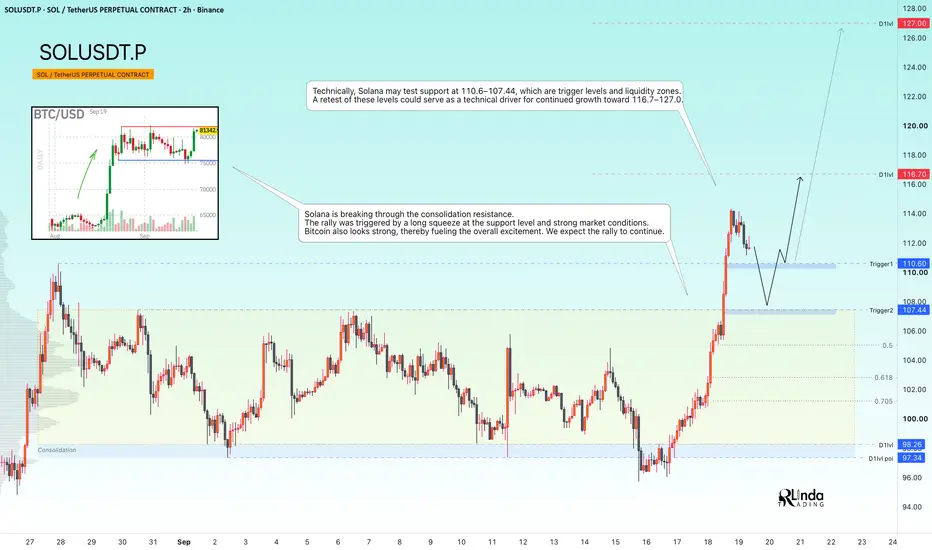
SOLUSDT - A hunt for liquidity ahead of the rally's continuationBINANCE:SOLUSDT confirms its bullish market structure. The long squeeze of support that we expected in the previous analysis played out perfectly. The bulls quickly took control of the situation and strengthened their positions...
Previously, we discussed how the market turned out to be stronger than expected: Bitcoin showed virtually no reaction to higher interest rates, the Fed’s hawkish stance, or the fact that the CLARITY Act was not passed. Consolidation continued, which further confirmed the strength of the market.
As for Solana, the altcoin is breaking through the consolidation resistance, suggesting that the coin is ready to continue its move higher. The rally was triggered by a long squeeze of support and the overall strength of the market
Resistance levels: 116.7, 127.0
Support levels: 110.6, 107. 44
Technically, Solana could retest the 110.6–107.44 support zone, which represents both key triggers and liquidity areas. A retest of these levels could become a technical catalyst for further upside toward 116.7–127.0
Best regards,
R. Linda!  Long
Long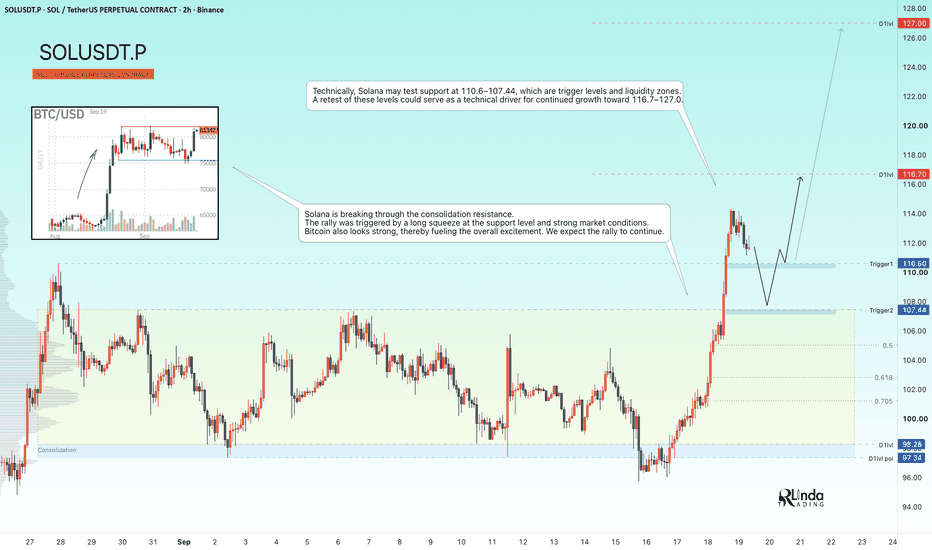
ETF POWER CAN GAIN BTC TO 92K + INTO 2026 BULLRUN ALREADY STARTThe ETF structure is one of the strongest structures Bitcoin can have. Based on the data, we are seeing steady ETF inflows into BTC, step by step. If this trend continues, our next target could be $84K. With strong ETF volume and continued institutional demand, Bitcoin could potentially reach $92K+ in the coming period.
Bitcoin is processing to create the 81K zone as support, which it make it as normally zone and high chance of increase to 84K, after 84K, the space trend is open to 92k+
After the 92K, the fomo can take BTC over, which the most will expect the bullrun is started, but the bullrun already started into AUG 2026  Long
Long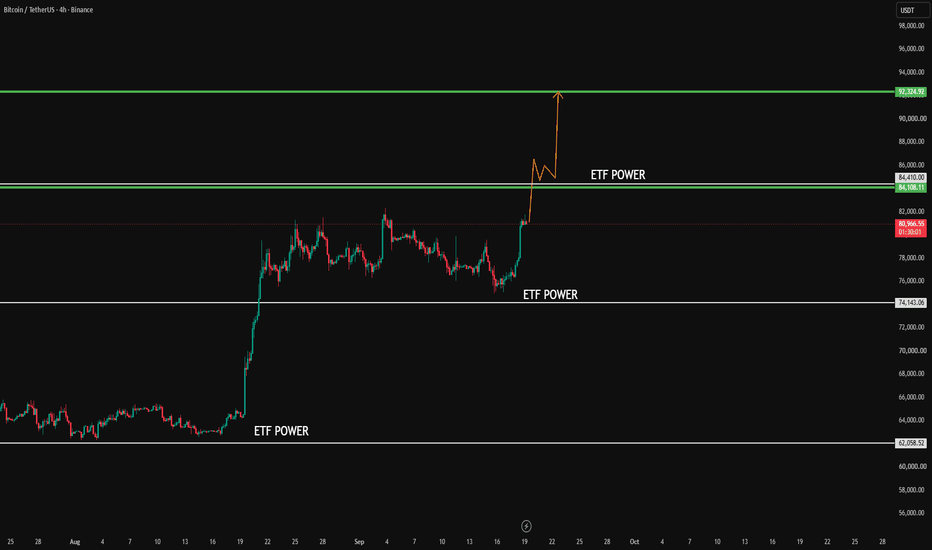
BTC/USD: Descending Trendline Breakout targeting $85,000Overview
Bitcoin ( BITSTAMP:BTCUSD ) on the 4-hour chart has broken out above a key descending trendline and reclaimed the major $81,000–$81,500 horizontal resistance zone. Price action is currently consolidating just above the breakout point, setting up two high-probability paths toward the major upside target at $85,000.
Technical Analysis Breakdown
1. Trendline Breakout & Consolidation
Descending Trendline Break: Bitcoin held dynamic resistance along a clear downward trendline throughout early September. The recent explosive bullish candle broke decisively above this line, indicating a shift in short-term market momentum.
100 EMA Support Dynamic: The 100-period Exponential Moving Average (100 EMA) provided continuous dynamic support during the recent mid-September dip near $76,200 (highlighted by the lower green circle), acting as a launchpad for the current leg upward.
2. Key Price Levels & Structure
Resistance Reclaimed as Support ($81,000 – $81,500): This gray box previously served as significant horizontal resistance and temporary support in late August and early September. Price is currently testing this zone from above.
Major Retest Zone ($78,000 – $79,000): Located near the conjunction of the 100 EMA and the top side of the broken descending trendline, this region represents a high-confluence pullback zone.
Key Invalidation / Major Support ($76,273): The recent local low near $76,270 marks the critical structural invalidation level for bullish setups.
Trade Scenarios & Potential Execution
Scenario A : Direct Continuation
Setup: Continuous 4-hour closes above $81,500 confirm immediate buying pressure without a deep pull back.
Target: $85,000 horizontal resistance.
Scenario B : Trendline & Horizontal Retest (High-Probability Entry)
Setup: A temporary corrective dip back into the Trendline Retest Zone ($78,000 – $79,000) to collect liquidity and confirm the broken trendline as new support.
Entry Region: $78,000 – $79,000 (watch for bullish reversal patterns on lower timeframes like 1h or 15m).
Target: $85,000
Stop Loss / Invalidation: Acceptance below $76,273.
Fundamental Context
Macroeconomic Drivers: Recent adjustments in interest rate policy by the Federal Reserve and fluctuating global liquidity have led to short liquidations, driving momentum across high-beta crypto assets.
Institutional & ETF Dynamics: Crypto markets continue to navigate shifts in spot ETF demand and regulatory discussions, contributing to heightened volatility around major technical thresholds.
Market Sentiment: A sustained push above $81,500 shifts near-term market sentiment back toward greed, encouraging sidelined capital to re-enter on healthy pullbacks.
Disclaimer
This trading idea is provided for informational and educational purposes only and does not constitute financial, investment, or trading advice. Cryptocurrency trading involves substantial risk of financial loss. Always practice strict risk management, use stop-loss orders, and do your own research (DYOR) before executing any trading plan. XAUUSD — 4,370 Retest Before 4,406?
Gold is trading around 4,386 after extending the M30 recovery above the rising trendline.
The short-term structure remains constructive, but price is now approaching an important resistance area.
The simple read
4,370 is the key breakout support.
If buyers defend this zone, Gold may continue toward 4,398–4,406.
A clean break above 4,406 could open the way toward the upper resistance around 4,437.
If 4,370 fails, the deeper structure support around 4,331 becomes the next important reaction area.
Key price zones
4,370 — breakout support
4,331 — key structure support
4,398–4,406 — major resistance
4,437 — upper resistance target
The M30 recovery is still healthy while price holds above the rising trendline.
But resistance is close.
Do not chase the candle.
Wait for the pullback.
Wait for reaction.
Can 4,370 hold and send Gold through 4,406? Long 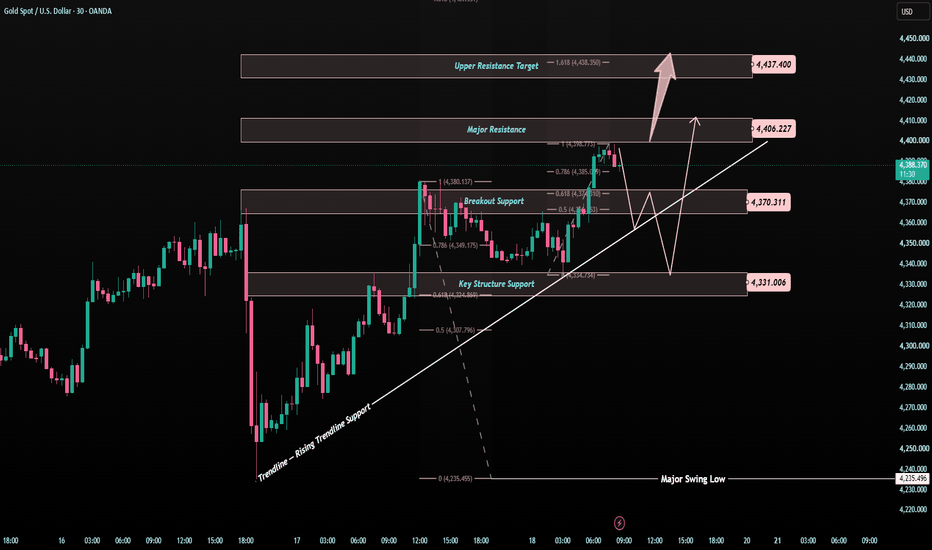
SOLUSDT - The Hunt for Liquidity Before Growth Resumes BINANCE:SOLUSDT.P continues to consolidate, just like the rest of the market. Technically, this is a favorable sign for further upside. However, important news is ahead...
Bitcoin is in consolidation, as is the rest of the market. Key news is ahead: the FOMC meeting and consideration of the cryptocurrency legislation.
Solana is also consolidating, while at the same time maintaining its local bullish trend amid expectations of upcoming news. Technically, a liquidity pool has formed below 97.34, which could be tested before a rally higher.
A long squeeze of the current range support could trigger further upside. However, a breakdown of the market structure on negative news could lead to a broader market decline
Resistance levels: 103.88, 107.4
Support levels: 98.3 - 97.3
A favorable fundamental backdrop, a false breakdown of support, and price consolidation above 98.3 could become a technical catalyst for further upside toward 103.88–107.4–110
Best regards,
R. Linda! Long 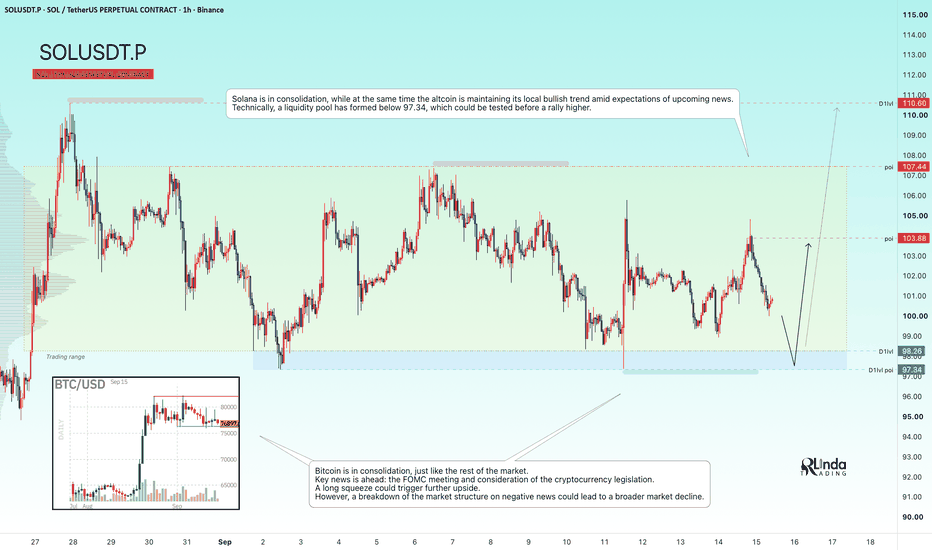
XAUUSD — Sell Pressure Below 4,300
Gold is still trading with a bearish intraday structure after failing to reclaim the upper liquidity zone. From Kelly’s view, the chart suggests that XAUUSD remains under selling pressure, and the current rebound is likely just a temporary pause before price continues lower.
The key idea is simple: as long as gold stays capped below the 4,290–4,300 sell zone, the market may continue rotating down toward the 4,254 support, then extend lower into the 4,235 area and possibly the final wave target near 4,160–4,170.
⟡ Market structure
Gold is currently trading around 4,290, right below the short-term liquidity sell zone. The recent price action keeps printing lower highs, which tells us that sellers still control the structure.
The area around 4,290–4,300 is important because it acts as immediate resistance. If price continues rejecting from this zone, the market may retest 4,254 first. A break below that support would likely expose the next reaction zone around 4,235–4,245.
From the Elliott Wave view, the chart still supports a bearish continuation. The current movement looks like a corrective wave before another downside leg develops. If sellers stay in control, the market may complete the next push lower toward the 4,160–4,170 target zone.
➤ Key levels
◌ Current price area: 4,290
◌ Sell zone liquidity: 4,288–4,300
◌ Intraday resistance: 4,300–4,310
◌ Strong support: 4,254
◌ Buy scalping wave 4 zone: 4,235–4,245
◌ Main bearish target: 4,160–4,170
◌ Bearish invalidation: above 4,310
⌁ Elliott Wave view
The chart shows a bearish Elliott Wave continuation structure.
Price is struggling below the sell liquidity zone, which may be the ceiling for the current recovery attempt.
If gold cannot break above 4,300, the next move may be a decline toward 4,254.
After that, a short rebound from the 4,235–4,245 wave 4 support zone may appear.
But if the broader bearish structure stays intact, the next selling leg could extend toward 4,160–4,170 to complete the downside wave sequence.
This is why Kelly is still prioritizing the bearish scenario while price remains below resistance.
▸ Trading scenario
Preferred bearish scenario
Entry: Sell around 4,288–4,300 if price shows bearish rejection
Stop Loss: Above 4,310
Take Profit 1: 4,254
Take Profit 2: 4,235–4,245
Take Profit 3: 4,160–4,170
Alternative scenario
If gold breaks above 4,300 and holds above that zone, short-term downside pressure may weaken. In that case, price could recover higher first before sellers return.
◌ Confirmation
Bearish confirmation comes if price continues rejecting below 4,300 and breaks down through 4,254.
◌ Invalidation
The bearish view becomes weaker if gold closes above 4,310 with strong momentum. That would suggest the market is no longer respecting the current sell zone.
⌁ Kelly’s view
Kelly’s main view remains bearish while gold stays below the 4,288–4,300 liquidity zone. The chart still favors selling rallies rather than chasing buys at the current level.
If sellers defend resistance, gold may continue lower toward 4,254, then 4,235–4,245. A deeper extension could later complete near 4,160–4,170.
Do you think gold will reject directly from this sell zone, or make one more small bounce before the next leg down? Short 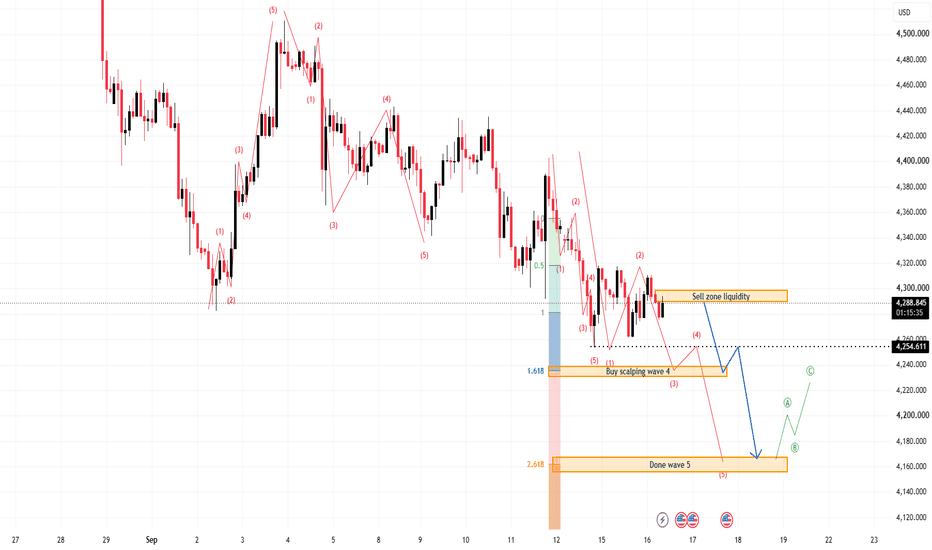
XAGUSD 4H | Demand Zone Reaction & Bullish Continuation SetupXAGUSD 4H — Smart Money Structure & Key Levels
Silver is currently trading around 64.63, with price reacting from the marked demand/support area around 62.40–61.90. The recent structure shows a recovery from the lower demand zone, while the chart is approaching important resistance levels.
Market Structure
Previous price action established multiple BOS and CHoCH formations, showing shifts in market structure.
The recent reaction from the 62.40–61.90 demand zone indicates that buyers are defending this area.
The current move is approaching 65.32, which is an important short-term structure/resistance level.
A confirmed break and close above 65.32 could provide additional bullish structure confirmation.
Key Resistance Zones
65.32 — Immediate resistance / confirmation level
68.20 — Major supply/resistance zone
71.04 — Higher-timeframe resistance / weak-high area
If price reaches the 68.20–71.04 region, watch the reaction carefully for rejection, liquidity sweep, or another structural shift.
Key Support / Demand
62.40–61.90 — Primary demand zone marked on the chart.
A sustained hold above this area keeps the recovery structure relevant. A decisive breakdown below the zone would weaken the bullish setup and require a fresh market-structure assessment.
Trade Plan
Rather than entering solely because price reaches a level, wait for confirmation such as CHoCH/BOS, rejection, or a valid retest on the lower timeframe. This can help reduce entries based only on anticipation.
Important: This is a technical analysis scenario, not a guaranteed trade signal. Always manage risk according to your own strategy and avoid risking more than you can afford to lose.  Long
Long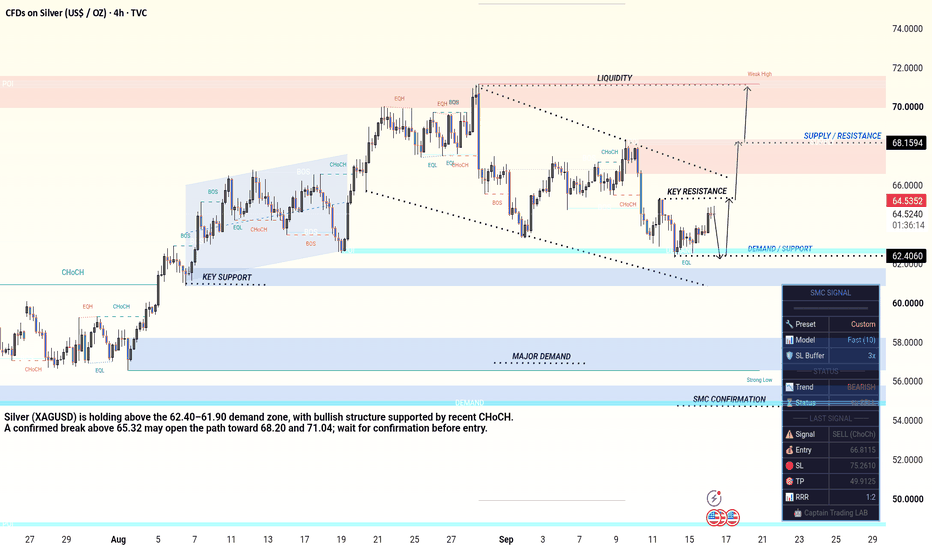
 Long
Long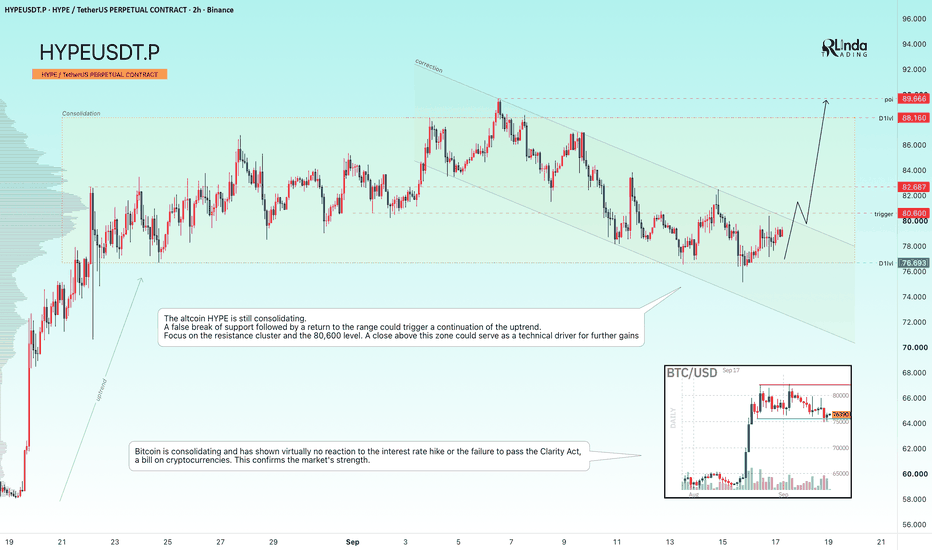
XAUUSD — 4,290 Retest Before the Next Push?
Gold is trading around 4,317 after a strong post-Fed recovery.
M30 structure is improving, but price is still sitting inside a near-term decision area.
A bounce is not enough.
The pullback will tell us more.
The simple read
The key zone today is 4,285–4,298.
If buyers defend this pullback area, Gold may recover toward 4,335 first, then challenge the major resistance around 4,357–4,367.
A clean breakout above that zone could open the way toward 4,396–4,399.
If 4,285 fails, the 4,277 OB becomes the next support.
Key price zones
4,285–4,298 — key pullback zone
4,277 — OB support
4,357–4,367 — major resistance
4,396–4,399 — upper target
4,236–4,245 — major support
The recovery structure is improving, but I prefer the pullback rather than chasing price.
Can 4,290 hold and send Gold toward 4,36x? Long 
XAUUSD — Bullish Recovery Toward 4,410Gold is showing a bullish recovery after reacting strongly from the lower liquidity area. From Kelly’s view, the chart suggests that XAUUSD may be forming a new upside Elliott Wave structure after breaking out from the lower side of the previous bearish channel.
The key idea is simple: if gold continues to hold above the Buy zone liquidity, the recovery structure can continue toward the next resistance levels.
⟡ Market structure
Gold is currently trading around 4,310–4,318, after bouncing from the Buy zone liquidity near 4,275–4,290. This reaction shows that buyers are trying to defend the lower support area and build a new bullish base.
The first resistance to watch is around 4,340–4,355, marked as the short-term sell scalping area. If gold breaks above this zone, the next important level is the strong resistance near 4,367.
A clean move above 4,367 would strengthen the bullish structure and open the way toward the 4,405–4,415 Resistance done wave 5 zone. If momentum continues, the larger upside target remains near 4,485–4,500.
➤ Key levels
◌ Current price area: 4,310–4,318
◌ Buy zone liquidity: 4,275–4,290
◌ Short-term resistance: 4,340–4,355
◌ Strong resistance: 4,367
◌ Main wave 5 target: 4,405–4,415
◌ Extended bullish target: 4,485–4,500
◌ Bullish invalidation: below 4,255
⌁ Elliott Wave view
The chart shows a possible bullish Elliott Wave recovery.
Wave (1) may have started from the lower liquidity area and pushed price toward 4,317.
Wave (2) may have completed after the retest near 4,275–4,290.
If this buy zone holds, wave (3) may continue toward 4,340–4,355 and 4,367.
Wave (4) could create a short pullback after testing resistance.
Wave (5) may then extend toward 4,405–4,415.
If buyers remain strong above that area, gold may later attempt the larger resistance zone around 4,485–4,500.
▸ Trading scenario
Preferred bullish scenario
Entry: Buy around 4,275–4,290 if price gives bullish confirmation from the liquidity zone
Stop Loss: Below 4,255
Take Profit 1: 4,340–4,355
Take Profit 2: 4,367
Take Profit 3: 4,405–4,415
Take Profit 4: 4,485–4,500
Alternative entry
If gold breaks above 4,340–4,355 and retests this area as support, buyers may look for continuation toward 4,367 and 4,405–4,415.
◌ Invalidation
The bullish view becomes weaker if gold breaks below 4,255 and fails to reclaim the buy liquidity zone. In that case, the recovery structure may fail and price could return to the lower bearish channel.
⌁ Kelly’s view
Kelly’s main view is bullish while gold holds above 4,275–4,290. The market is showing a strong reaction from the lower liquidity area, and the current pullback may only be preparation for the next upside wave.
If buyers defend the buy zone and price breaks above 4,340–4,355, gold may continue toward 4,367, then 4,405–4,415. The larger bullish target remains near 4,485–4,500 if momentum expands.
Do you think gold will break above 4,367 first, or retest the buy zone once more before the next rally? Long 
GOLD - A countertrend correction ahead of the news ICMARKETS:XAUUSD is bouncing from support ahead of the news and forming a countertrend correction amid the dollar’s stagnation following a five-day rally. The FOMC meeting and comments from the regulator are ahead...
Technically, most of the hawkish risks have already been priced in, but gold will remain vulnerable if the Fed signals that it intends to keep rates elevated for an extended period. Geopolitical risks and high energy prices are providing support. Gold is caught between expectations of tighter monetary policy and safe-haven demand.
Technically, the market is moving toward a liquidity zone, which could be tested before another decline within the local trend
Drivers:
Downside: hawkish Fed, strong dollar, rising yields.
Upside: dovish Fed, weak dollar, geopolitical support
Resistance levels: 4,355, 4,402
Support levels: 4,250, 4,230, 4,200
Gold, having failed to reach the key levels at 4,230–4,200, is forming a countertrend correction ahead of the upcoming news — the interest rate decision. A short squeeze of the 4,355–4,400 resistance zone could trigger a decline toward the key areas of interest
Best regards,
R. Linda! Short 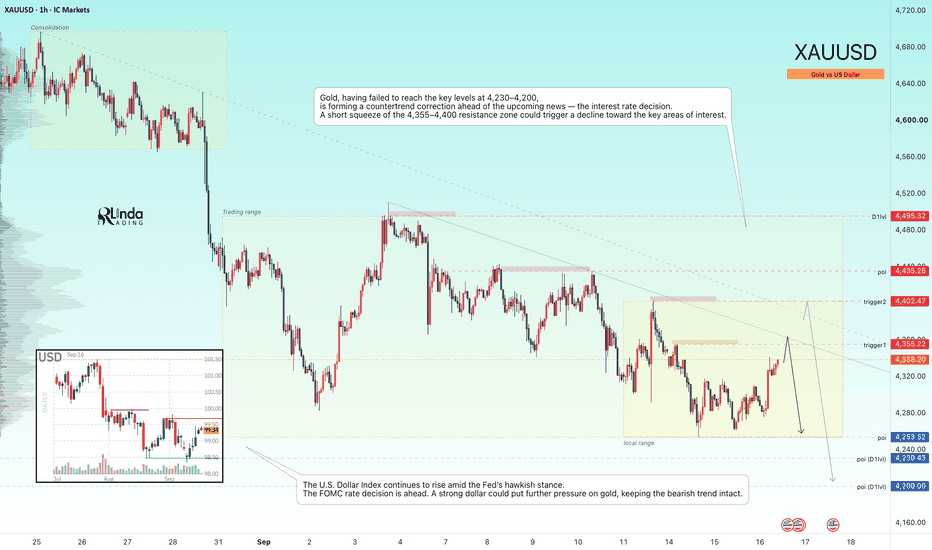
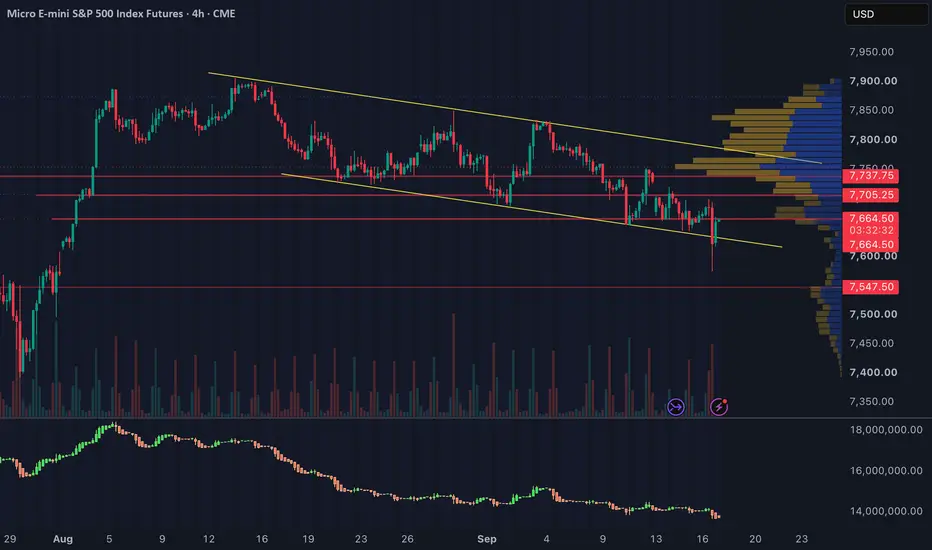
Post-FOMC Repricing Keeps MES in Tactical Risk-Off Post-FOMC Repricing Keeps MES in Tactical Risk-Off — Repair Rally Reaches Its First Test
Market Regime: Tactical Risk-Off / Hawkish Post-FOMC Price Discovery
Systemic Stress: Not confirmed
Confidence: High
Wednesday’s FOMC meeting produced a unanimous 25-basis-point rate increase, lifting the target range to 3.75%–4.00%. Policymakers’ projections also left another increase possible before year-end.
The market’s initial response was a sharp downside repricing followed by a meaningful after-hours recovery. That rebound has improved the immediate tape, but it has not repaired the broader structure.
MES is now pushing directly into its first major resistance area. Thursday’s question is whether buyers can convert the rebound into genuine acceptance—or whether former support becomes resistance again.
Index Structure and Breadth
SPY reacted cleanly around the 765, 761 and 757 areas, confirming that the market continues to respect established technical levels despite the FOMC volatility.
The broader structure remains mixed:
MES is trading below most of last week’s range.
RSP and SPY are approximately flat to slightly higher compared with similar levels from last week.
RSP is holding a major HVN/LVN decision area, but only narrowly.
RSP/SPY remains near an important support zone.
RTY and YM weakened materially.
ADD and VOLD finished negative, although not at capitulation readings.
Short- and intermediate-term S5 breadth gauges deteriorated sharply.
This is weak participation, but not yet an indiscriminate market breakdown. A decisive loss of the RSP HVN alongside further deterioration in RSP/SPY would provide much broader confirmation of downside continuation.
Volatility
Volatility delivered one of the session’s clearest warnings.
VIX strengthened, VIX1D was highly elevated around the event, and the front of the VX curve finished nearly flat—with VX1 and VX2 separated by very little.
That reflects strong immediate demand for protection. However, some of that demand may have been specific to the FOMC event.
Thursday’s confirmation test is whether volatility remains firm after the catalyst passes. If equities stabilize and VIX1D rapidly fades, the repair can continue. If MES rejects resistance while VIX and the front of the VX curve remain elevated, the bearish structure receives stronger confirmation.
Rates, Dollar and Inflation Pressure
The Treasury curve remains normally upward sloping, with the 30-year yield still the highest:
2-year: approximately 4.72%
5-year: approximately 4.85%
10-year: approximately 4.99%
30-year: approximately 5.33%
The concern is not curve inversion. It is the absolute level of rates and the continued weakness in longer-duration Treasuries.
DXY is simultaneously testing the major 100 level, while crude oil remains elevated around $102. Sustained dollar strength, long-end pressure and high oil prices would represent a difficult combination for equities by tightening financial conditions and keeping inflation concerns alive.
Leadership and Sector Structure
Leadership remains fragmented rather than completely abandoned.
Areas showing the greatest weakness include:
XLF and KRE, with regional banks remaining particularly vulnerable.
XLY, which continues to trade in a weak structure.
MSFT and AMZN after losing important support.
NVDA, which has not repaired its break below the major rising trendline.
Small caps and the Dow following their post-FOMC breakdowns.
Relative strength remains concentrated in selected names:
AAPL and META continue to act as relative leaders.
AMD and SMH showed better relative strength.
ORCL is attempting to stabilize.
AVGO and MU remain less convincing.
Semiconductors are mixed, and isolated megacap strength is not enough to establish a broad risk-on regime.
Credit, Funding and Futures Basis
Credit and funding remain the primary counterevidence against a systemic-stress call:
HYG/LQD softened but remained inside its established range.
Overnight reverse-repo usage remains minimal.
The Treasury General Account declined, providing a modest liquidity tailwind.
There is no confirmed transmission from equity weakness into credit disorder.
The displayed 3.90% IORB versus 3.63% EFFR and 3.64% SOFR primarily reflects a timing mismatch. IORB changes immediately with the new policy decision, while EFFR and SOFR remain backward-looking fixings until the next publication.
The sharp expansion in the December ES–SPX basis is worth monitoring, but higher policy rates mechanically increase futures carrying value. Without simultaneous funding or credit deterioration, the move currently resembles post-FOMC carry and roll repricing more than a market-plumbing failure.
Key MES Levels
Support:
7,628.50 — immediate downside decision level
Approximately 7,600 — major psychological and structural support
7,554.00 — next important lower shelf
Resistance:
7,660.75–7,680.75 — immediate repair and rejection zone
7,691.75–7,700.00 — stronger balance and acceptance test
7,716.25–7,724.25 — broader bullish structural repair
Thursday’s Primary Question
Can MES accept above 7,660–7,680 and then clear 7,700 with improving breadth, financials, semiconductors and declining volatility?
If yes, Wednesday’s FOMC breakdown may continue repairing.
If MES pushes into 7,660–7,680 or 7,692–7,700 and rejects while DXY holds near 100, volatility remains firm and banks continue weakening, that would create a strong SR rejection or Combination setup.
If MES instead loses 7,628.50 and accepts below 7,600, the path toward 7,554 becomes increasingly relevant.
For now, the after-hours move is a repair rally—not confirmation that the tactical risk-off regime has ended. XAUUSD Market Structure Support, Resistance & Breakout Scenario
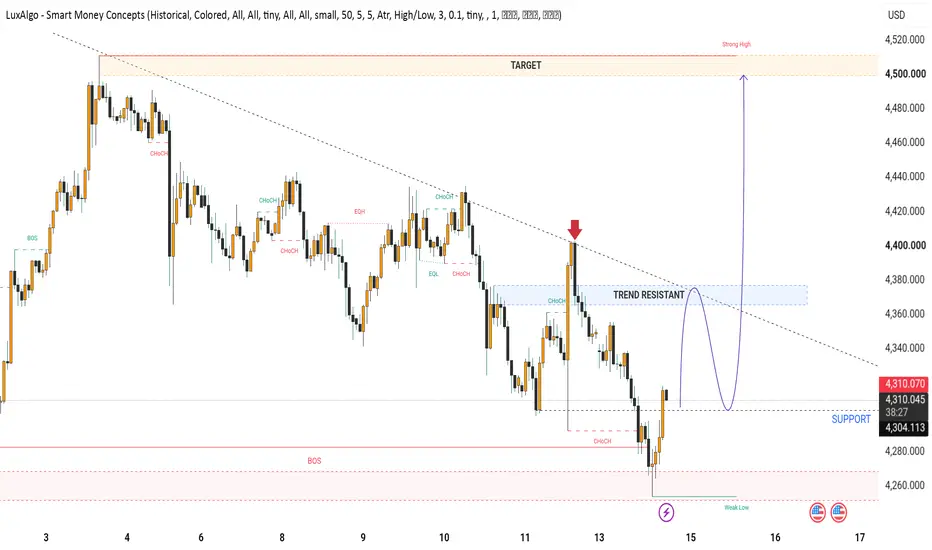
Gold is currently showing a recovery from the 4250–4275 support area after a strong bearish move. Price has bounced back toward the 4310 region, but the overall structure remains cautious because price is still trading below the descending trendline and the major 4365–4380 resistance zone.
Market Structure
The recent price action shows lower highs and lower lows, indicating that sellers still have control of the broader structure. The latest bounce from the 4250–4275 area suggests that buyers are defending the support zone, but this recovery should not automatically be considered a confirmed trend reversal.
The 4300–4310 region is currently an important short-term area. Holding above this zone could allow price to continue recovering toward the trend resistance.
Resistance
The primary resistance zone is approximately 4365–4380.
This area is important because it overlaps with the marked trend resistance and the descending trendline. A rejection from this region could bring sellers back into the market.
A sustained breakout above 4380, followed by confirmation and a successful retest, would provide stronger evidence that bullish momentum is developing. In that case, the next major upside objective shown on the chart is around 4500.
Support
The immediate support area is around 4300–4310.
Below this, the next important support is approximately 4275, followed by the major 4250 area.
A decisive break below 4250 would weaken the current bullish recovery and could indicate that the bearish structure is continuing.
Trading Scenarios
Bullish scenario:
Price holds above 4300–4310 and continues making higher highs and higher lows. The stronger confirmation would come from a breakout above 4365–4380 and a successful retest. Only after confirmation should traders consider continuation toward higher levels, with 4500 remaining the major chart objective.
Bearish scenario:
Price reaches the 4365–4380 resistance zone and shows a clear rejection, followed by bearish confirmation. Alternatively, a strong break below 4300 could increase the probability of a move toward 4275–4250.
The market should be allowed to confirm the direction rather than entering simply because price reaches a marked level.
Risk Management
Never risk a large portion of the account on a single XAUUSD trade. A conservative approach is to risk only a small, predefined percentage of account equity per trade.
The Stop Loss should be placed at a logical technical invalidation level rather than randomly or emotionally. Position size must be calculated according to the distance between entry and Stop Loss.
Do not increase lot size after a losing trade in an attempt to recover losses. Do not move the Stop Loss farther away simply because the trade is moving against you.
If the setup becomes invalid, accept the loss and wait for the next opportunity. Avoid revenge trading, overtrading and entering multiple correlated positions that create excessive exposure.
Discipline
The most important part of this setup is patience and execution discipline.
Do not enter before confirmation. Do not chase a candle after a large move. Do not change the trading plan because of fear or greed. If the market does not provide the planned setup, there is no obligation to trade.
A missed trade is better than a poorly planned trade.
Traders should define their entry conditions, Stop Loss, target and maximum acceptable risk before entering the market. Once those conditions are established, follow the plan consistently.
This analysis is for educational purposes only. It is not financial advice, and no price level or market direction is guaranteed. Always conduct your own analysis and manage risk according to your individual circumstances. Long 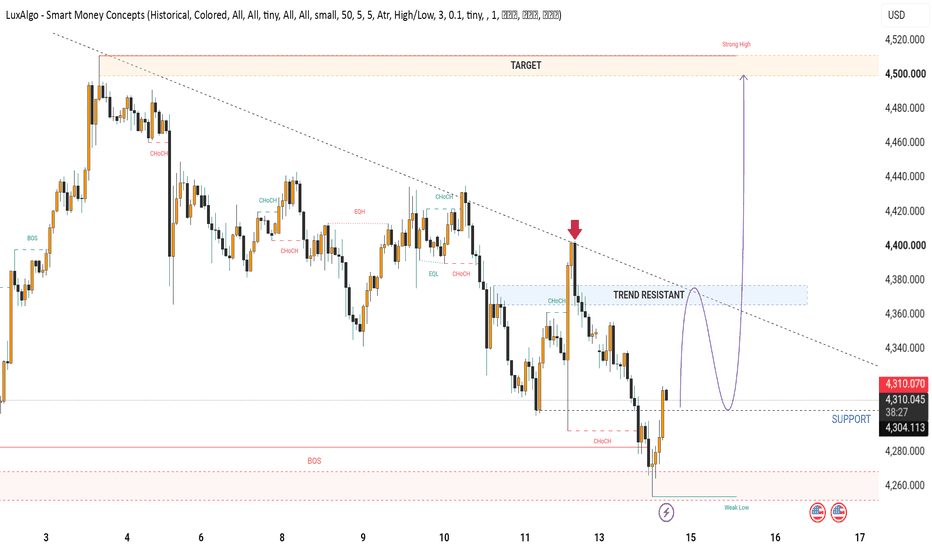
Market Concepts · Lesson 18 — Channels, Wedges & TrendlinesLesson 18 - Channels, Wedges and Trendlines: Trading Structured Price Patterns
Difficulty: Intermediate
Not every move happens in random chop. Sometimes price organizes itself into clean geometric patterns — channels, wedges, trendlines — that tell you exactly where reactions are likely. Learning to read these patterns adds a whole layer of structure to your chart.
🔵 TRENDLINES: THE FOUNDATION
A trendline is a diagonal line connecting two or more swing points that move in the same direction. In an uptrend, connect the higher lows. In a downtrend, connect the lower highs. The line becomes a diagonal support or resistance that price often respects.
The strongest trendlines share a few traits:
- Three or more clean touches
- Reactions that are decisive, not slow drifts
- Visible across timeframes — a trendline that shows up on both the 4H and daily carries more weight
Trendlines eventually break. When they do, the break itself is often the trade signal — a decisive close through a well-tested trendline usually marks a real shift in direction.
🔵 CHANNELS: TRENDLINES IN PAIRS
A channel is two parallel trendlines — one connecting the lows, one connecting the highs. Price bounces between them like a corridor.
Channels come in three flavors:
- Ascending — both lines slope up. Price is trending higher inside the channel
- Descending — both lines slope down. Price is trending lower inside the channel
- Horizontal — the classic range. Both lines are flat, and price oscillates between fixed support and resistance
Trading channels is often simple: buy near the lower line, sell near the upper line, until one side breaks. The break usually leads to a strong directional move — often a full "measured move" equal to the channel's height.
🔵 WEDGES: THE SQUEEZE PATTERN
A wedge is like a channel that's narrowing — the two lines converge instead of running parallel. This "squeeze" builds pressure, and when the wedge finally resolves, the breakout tends to be sharp.
Two main types:
- Rising wedge — both lines slope up, but the upper line rises slower than the lower. Often bearish (usually breaks down)
- Falling wedge — both lines slope down, but the lower line falls slower than the upper. Often bullish (usually breaks up)
Wedges are compression patterns. The tighter the pattern gets, the more explosive the resolution usually is. Trading them is about waiting for the break, not fading the pattern.
🔵 TRADING STRUCTURED PATTERNS
A few practical habits when trading these patterns:
- Wait for at least 3 touches before treating a line as reliable
- Trade the break, not the pattern itself — many wedges and channels get retested before breaking
- Use the pattern's height to project targets — a break usually travels a distance similar to the pattern's size
- Combine with confluence — a channel break that aligns with an order block, FVG, or key reference level is much stronger than the break alone
Structured patterns aren't magic. They're just visual representations of the same forces you've been learning about — where buyers and sellers agree on prices, where they disagree, and where the balance eventually shifts.
🔵 COMMON MISTAKES TO AVOID
- Drawing lines that require force to "fit" — if it takes work to make the trendline touch the swings, it's not really there
- Trading inside a channel without watching for the eventual break — sooner or later, every channel resolves
- Fading a wedge before it breaks — the safer trade is with the break, not against it
- Ignoring the higher-timeframe context — a bullish wedge inside a strong downtrend still fights the trend
🐳 PRO TIPS
- The cleanest patterns are the ones you can spot in three seconds — if you have to squint, it's probably not there
- Higher-timeframe patterns are more reliable than lower-timeframe ones — a daily channel matters much more than a 5-minute one
- Watch for volume on the break. A break with real volume behind it is far more likely to follow through than a quiet drift through the line
- Failed breaks (a break that reverses quickly) are often powerful reversal signals in themselves — the trapped side becomes fuel for the opposite move
Structured price patterns are one of the older tools in trading — but they still work, because the human behavior behind them hasn't changed. Learn to read them, and you add another lens to your chart.
Market Concepts — All Lessons
Lesson 01 — What Order Blocks Are
Lesson 02 — Zone Strength Isn't About Size
Lesson 03 — Entering Trades With Order Blocks
Lesson 04 — Old Order Blocks As New S/R
Lesson 05 — Breaker Blocks
Lesson 06 — HTF Blocks With LTF Entries
Lesson 07 — BOS vs Change of Character
Lesson 08 — Structure Quality: Strong vs Weak
Lesson 09 — Fair Value Gaps
Lesson 10 — Order Blocks + FVG Confluence
Lesson 11 — Swing Failure Patterns (SFP)
Lesson 12 — Buyside & Sellside Liquidity
Lesson 13 — SFP + Liquidity Combo
Lesson 14 — Building A Solid S/R Map
Lesson 15 — Reading Volume Profiles
Lesson 16 — Combining Key Levels & Zones
Lesson 17 — Opening Range Breakouts
Best Regards, BigBeluga 🐳  Education
Long 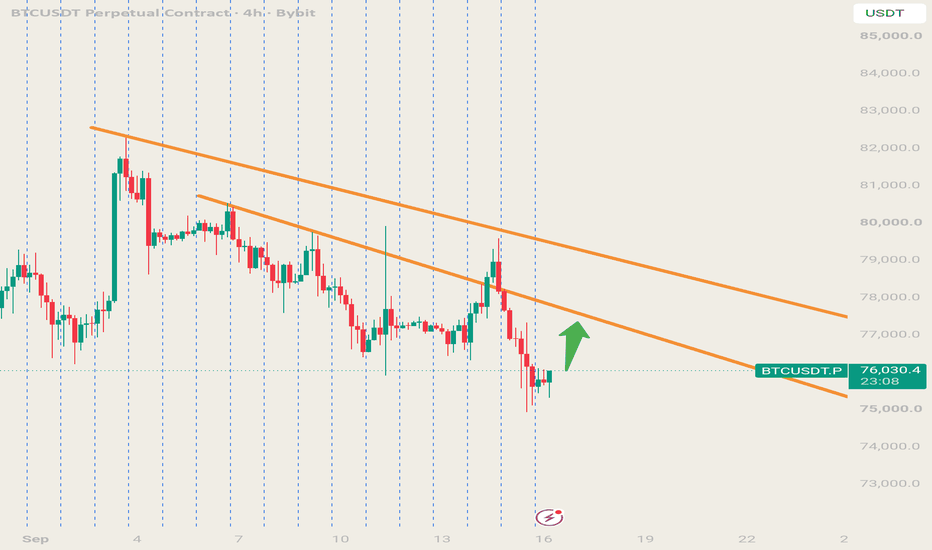
XAUUSD — Bearish Wave Toward 4,160
Gold is still moving inside a clear bearish channel after failing to break above the descending trendline. From Kelly’s view, the current chart suggests that XAUUSD remains under downside pressure, and the latest recovery may only be a short correction before another bearish Elliott Wave leg continues.
The key idea is simple: gold is trading below the FVG sell zone, and if buyers cannot reclaim this resistance, sellers may continue pushing price toward the lower support and final target area.
⟡ Market structure
Gold is currently trading around 4,283, still inside the descending channel. The short-term recovery is being capped below the 4,288–4,300 FVG sell zone, which is now the key resistance area.
The market is still forming lower highs, and price action remains weak below the trendline. If gold rejects from the sell zone again, the first downside area to watch is the strong support near 4,255–4,265.
A clean break below this support may open the next bearish move toward 4,225–4,235. If sellers keep control, the final Elliott Wave target remains around 4,155–4,165.
➤ Key levels
◌ Current price area: 4,283
◌ FVG sell zone: 4,288–4,300
◌ Short-term resistance: 4,300–4,320
◌ Strong support: 4,255–4,265
◌ Buy reaction zone: 4,225–4,235
◌ Main bearish target: 4,155–4,165
◌ Bearish invalidation: above 4,320
⌁ Elliott Wave view
The chart shows a possible bearish Elliott Wave continuation.
Wave (1) started after gold rejected from the upper channel area.
Wave (2) created a short corrective rebound into the FVG sell zone.
If price fails below 4,300, wave (3) may continue lower toward 4,225–4,235.
Wave (4) may create a small recovery from the lower reaction zone.
Wave (5) may complete the bearish structure near 4,155–4,165.
This is why Kelly is not chasing buys at the current price. The cleaner plan is to wait for price to reject the FVG sell zone or break below strong support with clear bearish momentum.
▸ Trading scenario
Preferred bearish scenario
Entry: Sell around 4,288–4,300 if price gives bearish rejection
Stop Loss: Above 4,320
Take Profit 1: 4,255–4,265
Take Profit 2: 4,225–4,235
Take Profit 3: 4,155–4,165
Alternative entry
If gold breaks below 4,255 and retests this level weakly, sellers may look for continuation toward 4,225–4,235 and then 4,155–4,165.
◌ Invalidation
The bearish view becomes weaker if gold breaks above 4,320 and holds above the descending trendline. In that case, the current bearish wave structure may be delayed, and price could attempt a stronger recovery first.
⌁ Kelly’s view
Kelly’s main view remains bearish while gold stays below the 4,288–4,300 FVG sell zone. The structure still favors selling rallies rather than chasing short-term rebounds.
If sellers defend the sell zone, gold may continue toward 4,255–4,265, then 4,225–4,235. The larger bearish target remains near 4,155–4,165 if wave (5) extends.
Do you think gold will reject from the FVG sell zone first, or break strong support directly? Short 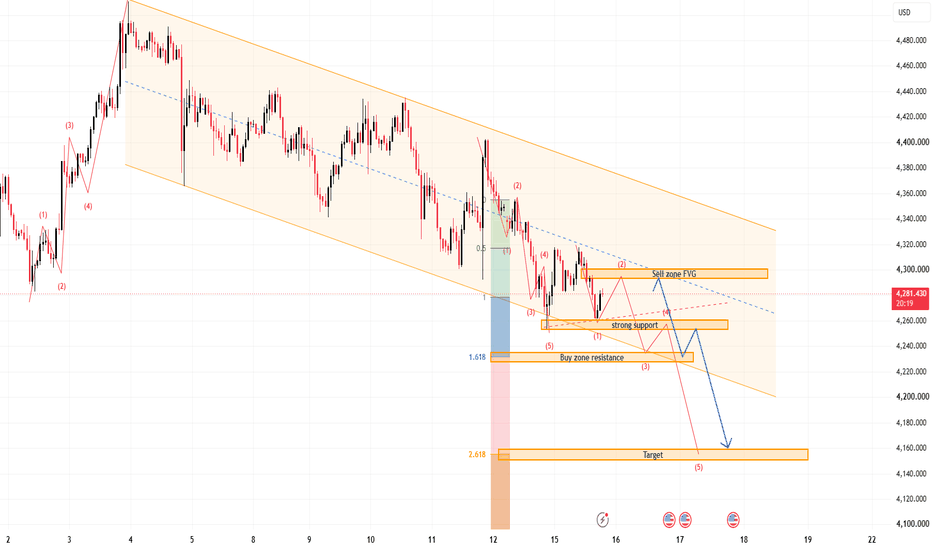
GOLD - A bounce off support before falling to 4,200 ICMARKETS:XAUUSD remains under pressure from the Fed’s hawkish stance and a strengthening dollar. In the medium term, the market may maintain its bearish trend; however, this week, all attention is focused on the Fed’s rate decision and the regulator’s comments
The dollar is forming a countertrend correction but remains locally bearish. The dollar’s rise is putting additional pressure on the metals market. Gold is maintaining its bearish market structure amid the Fed’s hawkish stance, while the market is also pricing in a high probability of a rate hike. Yields at their highest levels since 2023 are reducing the attractiveness of non-yielding gold. Trump’s rhetoric, including his calls for lower rates while acknowledging uncertainty, as well as support for Warsh’s independence, have so far failed to change the overall hawkish stance.
Technically, gold could remain within the current range ahead of the news. A false breakdown of support could trigger a correction toward the liquidity zones before the downtrend resumes.
Resistance levels: 4,345, 4,389, 4,435
Support levels: 4,287, 4,230, 4,200
The market is aiming to test the 2,292–2,287 liquidity pool. As an initial reaction to the retest, the market could trigger a rebound toward the 4,345–4,389 areas of interest and liquidity, followed by another move lower toward 4,200
Best regards,
R. Linda! Short 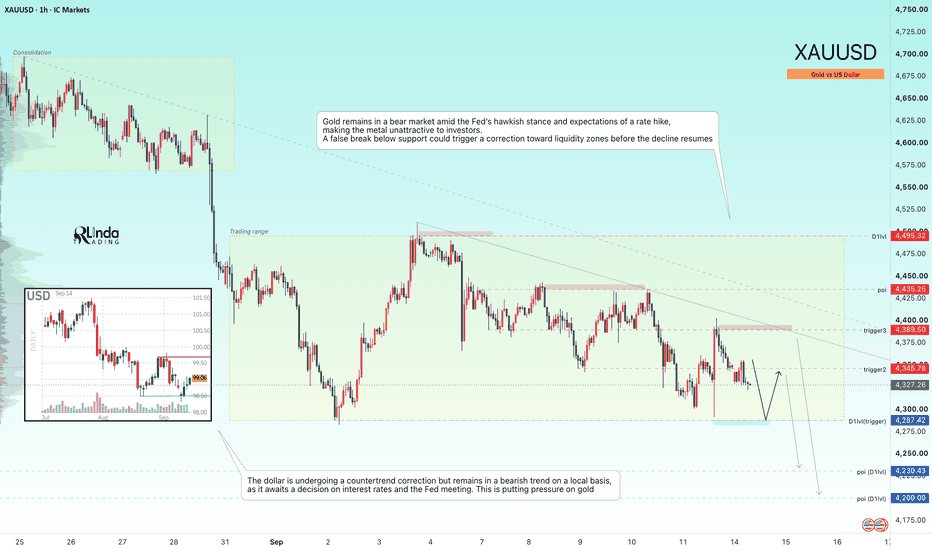
BTCUSD 1H — Bullish Rebound From SupportBTCUSD is showing a potential bullish reversal from the strong **$76,400–$76,700 support zone**. Price has reacted positively from this area, suggesting buyers are stepping in. A sustained move above the nearby **$77,200–$77,600 resistance** could strengthen the bullish setup and open the way toward higher levels.
**🎯 Target:** **$79,150**
**📍 Support:** $76,400–$76,700
**📈 Confirmation:** Break and hold above $77,600
**⚠️ Invalidation:** Strong breakdown below $76,400
Long 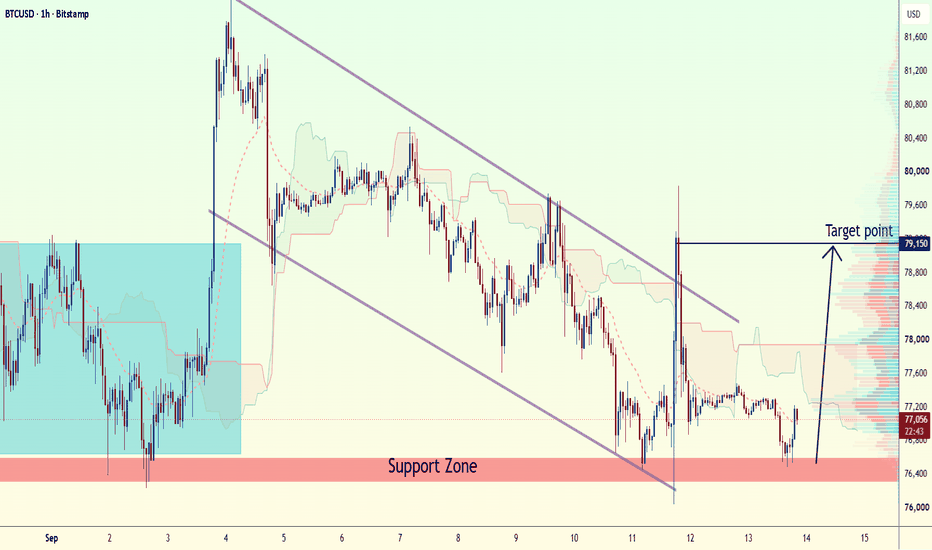
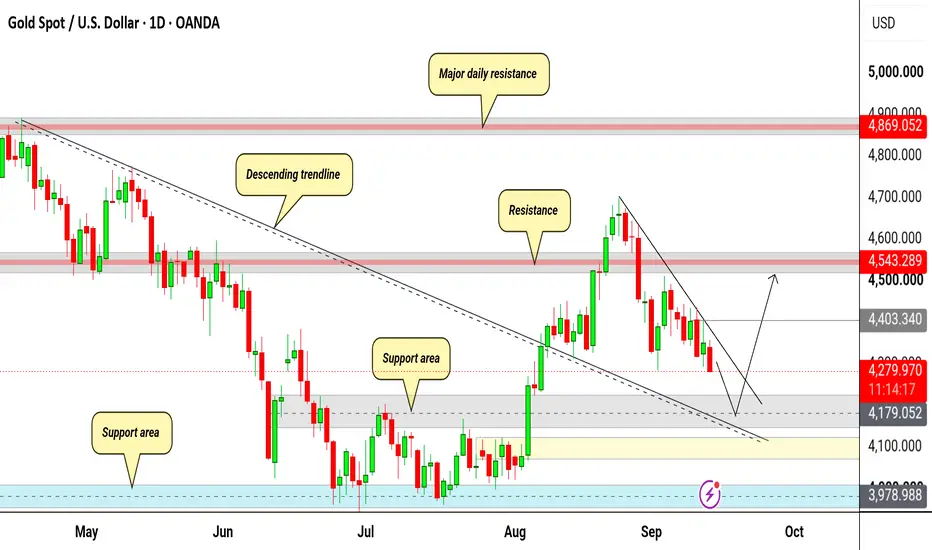
XAUUSD: Major Support Confluence & Descending Liquidity RetestTechnical Analysis
Market Structure & Trendline Retest: Gold (XAUUSD Daily) completed a major structural breakout above its long-term Descending Resistance Trendline in August, accelerating toward the $4,600 supply zone. The subsequent pull-back represents a textbook descending liquidity sweep and retest of the broken trendline acting as new dynamic support.
Support Confluence Zone ($4,179 – $4,287): Price is compressing directly into a high-confluence demand cluster formed by:The top boundary of the breached Descending Trendline (dynamic support).The primary horizontal Demand / Support Zone anchored around $4,179.05 (historical structure low).
Key Technical Levels:
Immediate Demand / Support: $4,287.38 (Current pivot area) to $4,179.05 (Major Structural Floor)
Invalidation / Lower Demand: $3,978.98 (Key swing low support)
Upside Resistance Targets: $4,543.28 (Prior Lower-High Supply Zone), $4,869.05 (Major Daily Resistance)
Execution Strategy: Monitor lower-timeframe price action for bullish confirmation signals (e.g., liquidity absorption, bullish engulfing candles, or market structure shifts) within the $4,179 – $4,230 zone before anticipating a secondary leg higher toward the $4,543 resistance.
Fundamental Context
Federal Reserve Monetary Policy: Precious metals remain heavily anchored to real yields and Federal Reserve interest rate expectations. Any dovish guidance or hints of future rate cuts lower the opportunity cost of holding non-yielding bullion, fueling upside momentum.
Central Bank Accumulation & ETF Flows: Institutional central bank reserve allocation and steady gold ETF inflows continue to provide structural underlying demand, keeping price dips well-bid near key support levels.
Macro Risk & Safe-Haven Flows: Global geopolitical tensions and sovereign debt expansions sustain a consistent floor of safe-haven hedging across key financial markets.
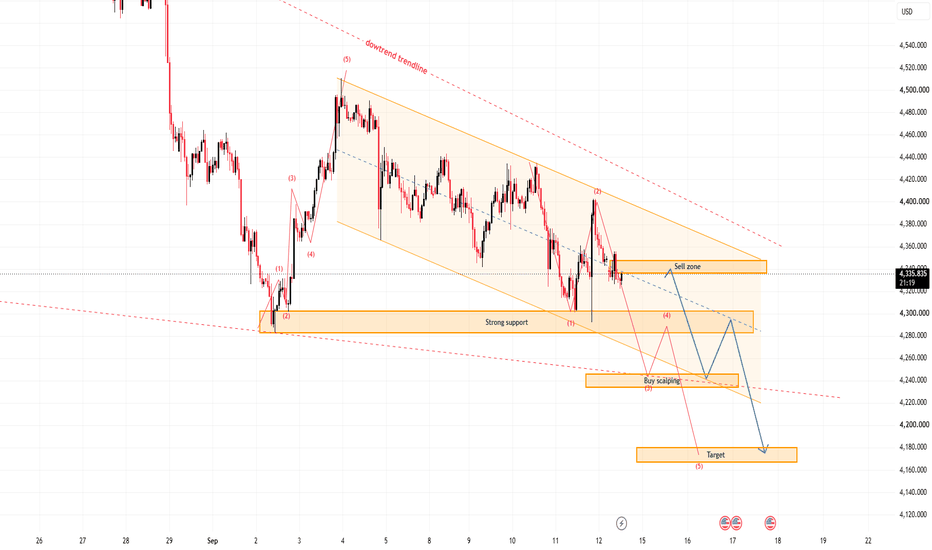
Disclaimer: This analysis is strictly for educational and informational purposes and does not constitute financial, investment, or trading advice. Always conduct independent research, implement strict risk management, and utilize proper position sizing. XAUUSD — Bearish Channel Toward 4,175
Gold is still moving inside a clear bearish channel after failing to reclaim the upper resistance trendline. From Kelly’s view, the chart suggests that XAUUSD remains under downside pressure, and the current recovery may only be a short correction before the next bearish wave continues.
The key idea is simple: gold is trading near the sell zone, and if buyers fail to break above this area, sellers may push price back toward lower support and the final target zone.
⟡ Market structure
Gold is currently trading around 4,333, right below the short-term sell zone near 4,335–4,350. This area is important because it sits close to the descending trendline and may act as the next rejection zone.
The broader structure is still bearish. Price is forming lower highs inside the downtrend channel, while each recovery remains limited under resistance. If gold rejects from the current sell zone, the first downside area to watch is the strong support zone around 4,285–4,300.
A clean break below this support may open the next move toward the 4,235–4,245 buy scalping area. If bearish momentum continues, the final target remains near 4,170–4,180.
➤ Key levels
◌ Current price area: 4,333
◌ Sell zone: 4,335–4,350
◌ Strong support: 4,285–4,300
◌ Buy scalping zone: 4,235–4,245
◌ Main bearish target: 4,170–4,180
◌ Bearish invalidation: above 4,360–4,380
⌁ Elliott Wave view
The chart shows a possible bearish Elliott Wave continuation.
Wave (1) may have started after price rejected from the upper channel area.
Wave (2) created a corrective rebound but failed below the downtrend resistance.
Wave (3) may now continue lower toward 4,235–4,245.
Wave (4) could create a short recovery from the buy scalping area.
Wave (5) may complete the bearish structure near 4,170–4,180.
This is why Kelly is not chasing buys at the current price. The cleaner plan is to watch the sell zone and wait for bearish confirmation before following the next downside leg.
▸ Trading scenario
Preferred bearish scenario
Entry: Sell around 4,335–4,350 if price gives bearish rejection
Stop Loss: Above 4,380
Take Profit 1: 4,285–4,300
Take Profit 2: 4,235–4,245
Take Profit 3: 4,170–4,180
Alternative entry
If gold breaks below 4,285 and retests it weakly, sellers may look for continuation toward 4,235–4,245 and then 4,170–4,180.
◌ Invalidation
The bearish view becomes weaker if gold breaks above 4,360–4,380 and holds above the descending trendline. In that case, the current bearish wave structure may be delayed, and price could attempt a stronger recovery first.
⌁ Kelly’s view
Kelly’s main view remains bearish while gold stays below the 4,335–4,350 sell zone and the descending trendline. The market is still moving inside a downward structure, so rebounds are more likely to be watched for rejection than chased as bullish continuation.
If sellers defend the sell zone, gold may continue toward 4,285–4,300, then 4,235–4,245, with the larger target near 4,170–4,180.
Do you think gold will reject from the sell zone first, or retest strong support before the next wave lower? Short