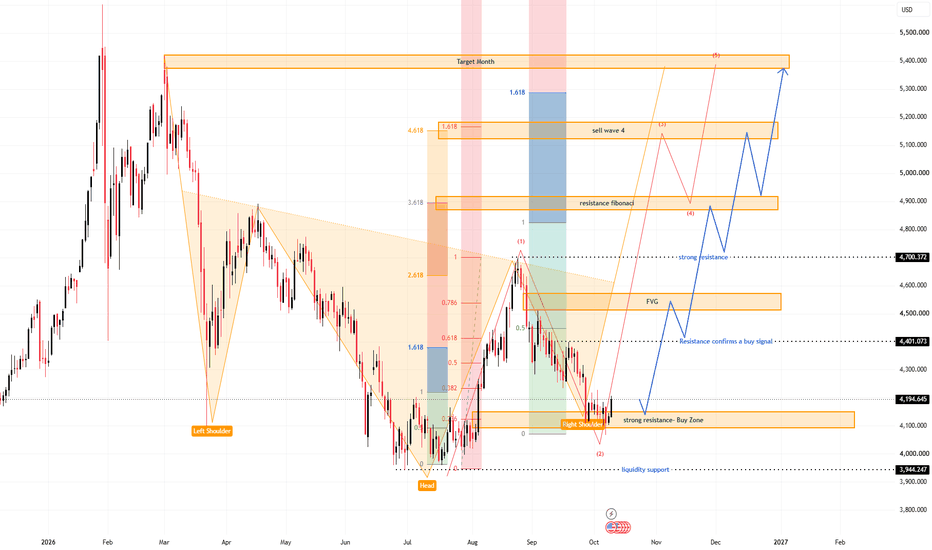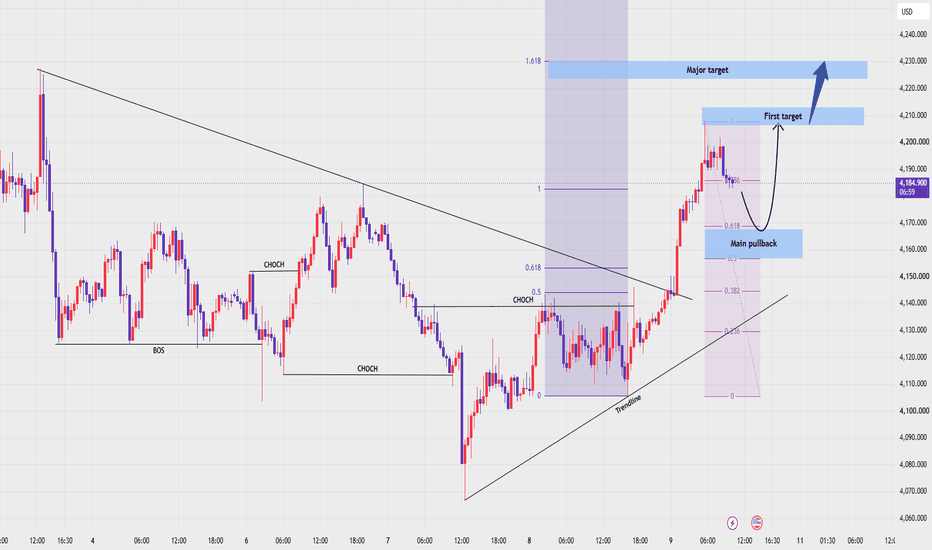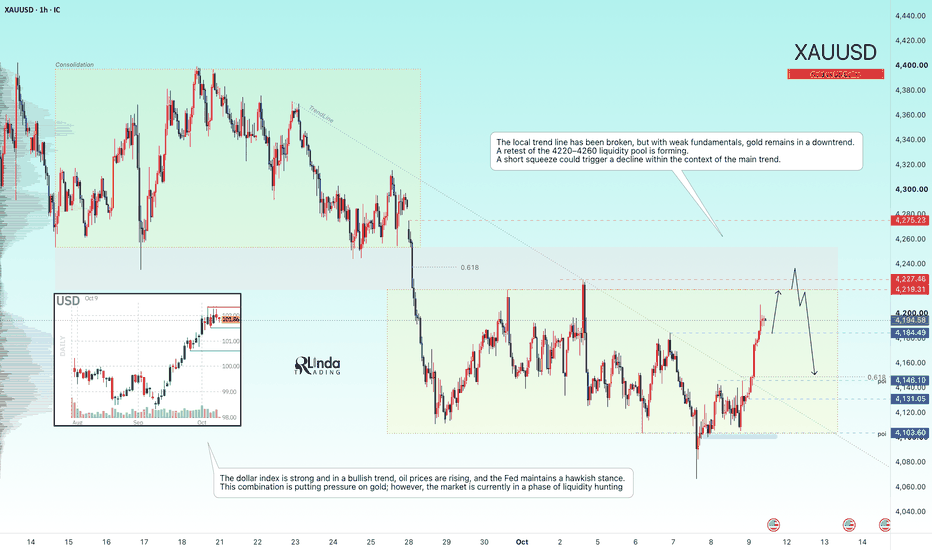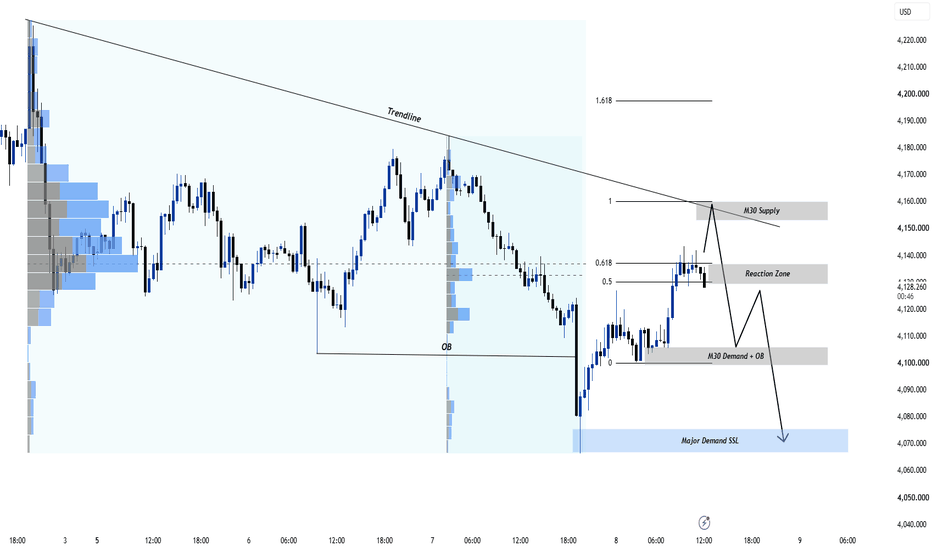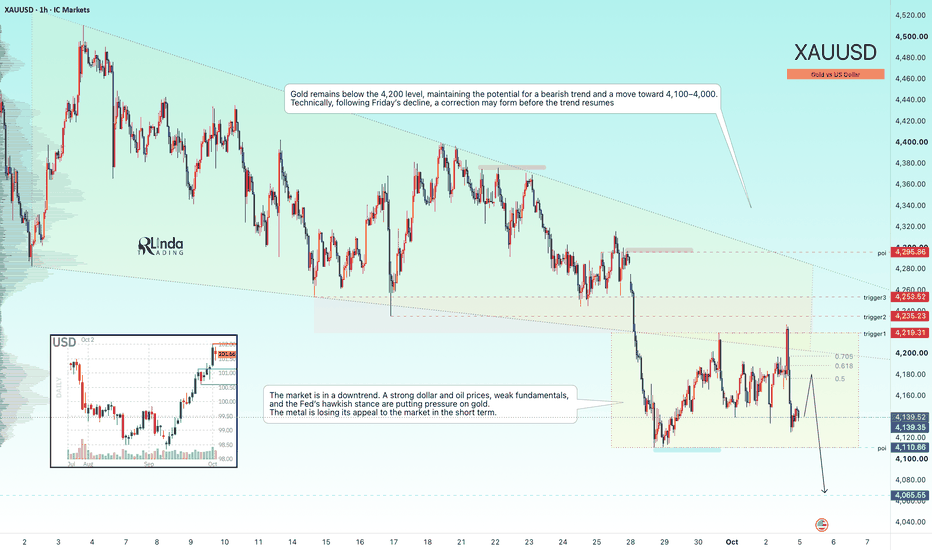
GOLD - A false breakout of resistance within a bearish trendICMARKETS:XAUUSD has broken out of its short-term descending channel within the current distribution phase and is now testing the 4134 liquidity zone while printing fresh intermediate highs. Despite the technical recovery, the broader fundamental backdrop remains weak
Gold remains caught between geopolitical support and pressure from hawkish Federal Reserve expectations and elevated real yields. Analysts note that a sustainable recovery would likely require lower oil prices, declining bond yields, and softer expectations for further monetary tightening. Until then, the upside potential is expected to remain limited.
At the moment, oil prices continue to rise, while the U.S. dollar has strengthened for a fifth consecutive session, maintaining its broader bullish trend.
Bullish drivers: Geopolitical de-escalation, Falling oil prices, A weaker U.S. dollar, Softer expectations for Fed rate hikes
Bearish drivers: Escalation of geopolitical tensions, Rising oil prices, Hawkish Fed rhetoric, Continued U.S. dollar strength
Resistance levels: 4124, 4134, 4195
Support levels: 4103, 4067, 4028
Technically, the market is testing a key liquidity pool within the current distribution phase and may be forming a short squeeze. If bears manage to keep price below the 4124–4134 resistance zone, it could trigger another leg lower in line with the broader daily bearish trend
Best regards,
R. Linda
Trend Line Break
NZDJPY - Long squeeze before a rally. Bullish trendFX:NZDJPY is consolidating following a distribution phase, while the broader trend remains bullish. The continued weakness of the Japanese yen is providing medium-term support for the pair
The Japanese yen remains under pressure, which continues to favor the New Zealand dollar. From a technical perspective, NZDJPY is maintaining its bullish structure while consolidating within the 94.59–95.35 range. A false breakout below support could shift the short-term imbalance back in favor of buyers and trigger the next leg higher
Resistance levels: 95.19, 95.35
Support levels: 94.59, 94.45
A false break below the 94.58–94.45 support zone, followed by a recovery back into the range and sustained consolidation above this key area, could become the technical catalyst for a continuation of the primary bullish trend
Best regards,
R. Linda
XAUUSD Buy-Side Liquidity Taken, Sellers Target Lower LiquidityGold (XAUUSD) on the 1-hour timeframe is showing a potential bearish continuation setup after rejecting from the weak high liquidity area around 4,165. Price created a bullish expansion earlier, but after collecting buy-side liquidity, the market formed a CHoCH (Change of Character) indicating a possible shift in short-term order flow.
Currently, price is retracing toward the marked Selling Zone / Supply Area, where institutional sellers may defend their positions and push price toward lower liquidity.
Technical Analysis:
Price swept liquidity near the weak high before showing rejection.
A bearish CHoCH confirmed the shift from bullish momentum to seller control.
Current price is approaching the Selling Zone around 4,090–4,100.
The recent bearish BOS confirms downside pressure.
Key support/liquidity target remains around 4,023 and 3,960 strong low area.
Bearish Scenario:
If price rejects the selling zone:
Target 1: 4,023 (previous liquidity level)
Target 2: 4,000 psychological level
Target 3: 3,960 Strong Low liquidity zone
Invalidation:
A strong breakout and acceptance above the selling zone can invalidate the bearish setup and may lead to another move toward the weak high.
SMC Logic:
Market sequence:
Buy-Side Liquidity Sweep → CHoCH → Bearish BOS → Retracement Into Supply → Sell-Side Liquidity Hunt
The current structure suggests that smart money may be targeting lower liquidity after collecting highs.
Fundamental Overview:
Gold remains sensitive to:
US Dollar strength
Federal Reserve interest rate expectations
Inflation data
Global risk sentiment and safe-haven demand
A stronger USD can pressure Gold lower, while USD weakness may support recovery.
Conclusion:
XAUUSD is currently reacting from a premium area after liquidity collection. If sellers maintain control from the selling zone, the next institutional objective remains the downside liquidity around 4,023–3,960.
Note:
Market collected buy-side liquidity near the weak high, then shifted structure with CHoCH. The current selling zone is the key area to watch for continuation toward lower liquidity.
GOLD - The Hunt for Liquidity (Correction) Before the Drop ICMARKETS:XAUUSD is recovering after Thursday's sharp decline, trading around $4,060 on Friday. This rebound may represent nothing more than a liquidity-building move before the broader downtrend resumes
The U.S. dollar continues to strengthen, while gold remains under selling pressure, reinforcing the prevailing bearish market structure. The broader trend remains firmly bearish.
From a technical perspective, gold continues to face pressure from geopolitical uncertainty and hawkish Federal Reserve expectations. The current recovery appears to be a countertrend correction toward key liquidity zones, potentially building momentum for another decline toward the 4000–3983 support area. The next directional move will largely depend on the U.S. dollar, oil prices, PMI data, and developments surrounding the geopolitical conflict.
Bearish drivers: Stronger hawkish Fed expectations, Rising oil prices, Continued U.S. dollar strength, Profit-taking, Bearish technical structure
Bullish drivers: U.S. dollar weakness triggered by new tariff developments, Geopolitical de-escalation, Weaker-than-expected PMI data
Resistance levels: 4061, 4067, 4109
Support levels: 4021, 4000, 3983
Within the current countertrend correction, gold is testing the first trigger zone at 4061–4067. A short squeeze around this area could trigger another reversal and send price back toward support. However, a deeper correction toward the 4109–4134 liquidity zone before the next bearish leg cannot be ruled out
Best regards,
R. Linda
XAUUSD: Wave 5 Sell Setup Targets 3,993
Gold is still trading under bearish pressure after breaking below the previous uptrend trendline. From Kelly’s view, the current structure suggests that the market may still be moving inside a bearish Elliott Wave sequence, with wave 5 aiming towards the lower Fibonacci target area.
The key idea is simple: gold may rebound slightly first, but as long as price stays below the sell zone and strong liquidity resistance, the downside structure remains active.
⟡ Market structure
The chart shows gold completed a strong recovery earlier, but that bullish structure weakened after price rejected from the upper area and broke below the rising trendline.
After the breakdown, gold created a clear bearish sequence with lower highs and lower lows. Price is now trading around 4,026, sitting directly under the 4,028–4,032 sell zone.
This area is important because it may act as the wave 4 retest before wave 5 continues lower. If sellers defend this zone, gold may rotate back towards the 4,000 support, then the 3,993 Fibonacci 2.618 target zone.
The strong liquidity zone around 4,045–4,052 is the key resistance above. If gold cannot reclaim this area, the bearish wave structure remains in control.
➤ Key levels
◌ 4,028–4,032: sell zone and wave 4 retest area
◌ 4,045–4,052: strong liquidity resistance
◌ 4,026: current price reaction area
◌ 4,000: first support and downside checkpoint
◌ 3,990–3,995: Fibonacci 2.618 target / possible wave 5 end
◌ Above 4,052: area where the bearish setup starts to weaken
⌁ Elliott Wave view
From an Elliott Wave perspective, gold appears to be developing the final bearish leg of a 5-wave decline.
Wave 1 started after price lost bullish momentum from the upper area.
Wave 2 created a corrective rebound but failed to change the structure.
Wave 3 delivered the stronger bearish push below the trendline.
Wave 4 may now be forming around the 4,028–4,032 sell zone.
If this zone holds, wave 5 may continue lower towards 3,990–3,995.
The Fibonacci 2.618 level near 3,993 is important because it aligns with the projected wave 5 completion zone. This makes the lower support area a key target for sellers, but also a zone where a short-term reaction may appear.
▸ Trading scenario
Preferred scenario: wait for price to retest the sell zone and show bearish confirmation.
Sell zone: 4,028–4,032 if rejection appears
Stop loss: above 4,052 or above the confirmed rejection high
Take profit 1: 4,000
Take profit 2: 3,993
Take profit 3: 3,980 if wave 5 extends strongly
Alternative scenario: if gold breaks above 4,052 and holds with strong acceptance, the bearish wave 5 setup weakens. In that case, price may move into a larger corrective recovery before the next structure becomes clear.
⌁ Kelly’s view
For Kelly, this is still a bearish Elliott Wave setup. Gold has already broken the uptrend line, and the recovery attempts are still happening below resistance.
The cleanest plan is to wait for price reaction around 4,028–4,032. If sellers defend this zone, the next move may continue towards the Fibonacci wave 5 target near 3,993.
Gold remains weak below the sell zone.
If resistance holds, wave 5 may continue lower before a stronger reaction appears.
Share your view below.
XAUUSD: ABC Pullback May Prepare the Next Bullish Wave
Gold is still holding a constructive bullish structure after the strong recovery from the lower base. From Kelly’s view, the market has already created an impulsive move higher, and the current pullback may simply be an ABC correction before price attempts another upside continuation.
The key idea is simple: gold may correct first, but the bullish structure remains active while price holds above the trendline and the main buy zone.
⟡ Market structure
The chart shows gold recovering strongly from the 3,960 area, then building higher lows along the rising trendline. Price pushed into the 4,130–4,140 region before slowing down, which is normal after a strong bullish leg.
Gold is now trading around 4,118, close to the short-term support area. The first reaction zone sits around 4,100–4,105, where a small buy scalping setup may appear.
The more important zone is the 4,068–4,075 area. This is marked as the possible end of the ABC correction. If buyers defend this zone, gold may start a new upward wave towards the upper trendline and the 4,150–4,160 target area.
➤ Key levels
◌ 4,100–4,105: buy scalping zone and short-term reaction area
◌ 4,068–4,075: main buy zone and possible ABC completion
◌ 4,118–4,123: current price reaction area
◌ 4,130–4,140: nearest resistance zone
◌ 4,150–4,160: upside target and trendline target area
◌ Below 4,068: area where the bullish setup starts to weaken
⌁ Elliott Wave view
From an Elliott Wave perspective, gold appears to have completed a short bullish wave sequence from the lower base. After that, the current movement may be forming an ABC correction.
Wave A is the first pullback from the recent high.
Wave B may form a small rebound around the 4,100 zone.
Wave C may complete around 4,068–4,075 if price continues to correct deeper.
If wave C ends inside this buy zone and a bullish confirmation candle appears, gold may begin the next continuation phase. The next target would be 4,130–4,140 first, then 4,150–4,160 if momentum expands.
▸ Trading scenario
Preferred scenario: wait for gold to complete the ABC correction around the buy zone before looking for continuation.
Entry zone: 4,068–4,075 if bullish confirmation appears
Scalping entry zone: 4,100–4,105 only if price reacts strongly
Stop loss: below the confirmed wave C low or below 4,060
Take profit 1: 4,130–4,140
Take profit 2: 4,150–4,160
Take profit 3: higher trendline area if bullish momentum continues
Alternative scenario: if gold breaks below 4,068 with strong bearish pressure, the ABC bullish setup weakens. In that case, price may need to form a deeper base before the next recovery becomes reliable.
⌁ Kelly’s view
For Kelly, this is a bullish continuation structure, but the market needs a healthy correction before the next strong move. Buying directly after a strong push is not the cleanest plan.
The better setup is to wait for gold to pull back into support, then watch whether buyers defend the ABC completion zone.
Gold is correcting inside a bullish structure.
If the buy zone holds, the next upside wave may continue towards 4,150–4,160.
Share your view below.
XAUUSD — Bullish Retest AheadGold remains sensitive to the US dollar, Treasury yields and interest-rate expectations. Softer yields or renewed USD weakness could support the bullish structure, while stronger US data may trigger a temporary correction.
Technical View
On the H2 chart, XAUUSD has broken above the descending trendline and confirmed a bullish CHOCH around 4,080. The strong displacement toward 4,130–4,140 shows that buyers currently control the short-term structure.
However, RSI is trading near 70, suggesting that price may be temporarily extended. I would prefer to see a controlled retracement before considering further bullish continuation.
Key Levels
Immediate resistance: 4,135–4,145
Primary demand: 4,040–4,055
Deeper support: 4,018–4,030
Higher liquidity: 4,190–4,200
Trading Scenario
My bias remains bullish while price holds above the broken trendline and the 4,018–4,055 demand area.
A pullback into 4,040–4,055, followed by bullish confirmation, could support another expansion toward 4,190–4,200. A deeper retracement into 4,018–4,030 may still preserve the bullish structure, but a decisive break below this region would weaken the scenario.
Overall View
The trendline breakout and bullish CHOCH support further upside, but the overbought RSI suggests patience may be needed before the next expansion.
Do you expect XAUUSD to retest demand first or continue directly toward 4,200?
XAUUSD: Bullish Wave 5 May Start After Pullback
Gold is showing a clear recovery structure after completing the previous bearish cycle near the lower area. From Kelly’s view, the chart is now shifting into a bullish Elliott sequence, but price may still need one corrective pullback before wave 5 continues higher.
The key idea is simple: gold is bullish in the short term, but the better setup may come from a clean retest of the buy zone, not from chasing the current push.
⟡ Market structure
The chart shows gold has reacted strongly from the lower base near 3,960 and created a sequence of higher lows. Price has already broken back above the descending pressure line, which is an important sign that sellers are losing control in the short-term structure.
Gold is now trading around 4,075 after a strong recovery move. However, price is approaching the 4,090–4,100 sell wave 4 zone, so a short correction from this area would be normal.
The main support to watch is the 4,040–4,050 buy zone wave 5. If gold pulls back into this area and buyers defend it, the next upside leg may continue towards the Fibonacci 2.618 target near 4,145–4,155.
➤ Key levels
◌ 4,040–4,050: buy zone wave 5 and key pullback area
◌ 4,075: current price reaction area
◌ 4,090–4,100: sell wave 4 / short-term resistance
◌ 4,138: previous Fibonacci reference zone
◌ 4,145–4,155: final wave 5 completion area
◌ Below 4,030: area where the bullish setup starts to weaken
◌ Below 4,000: area where the wave count needs reassessment
⌁ Elliott Wave view
From an Elliott Wave perspective, gold appears to be building a bullish 5-wave recovery after the previous bearish structure ended.
Wave 1 created the first upside reaction from the low.
Wave 2 corrected back but held above the base.
Wave 3 expanded strongly and pushed gold back above the broken trendline.
Wave 4 may now form as a controlled pullback into the 4,040–4,050 buy zone.
If that zone holds, wave 5 may begin and aim for the 4,145–4,155 completion area.
This is why Kelly would not chase the current price directly into resistance. The stronger setup is to wait for wave 4 to finish, then look for confirmation that wave 5 is starting.
▸ Trading scenario
Preferred scenario: wait for gold to pull back into the buy zone wave 5 and show bullish confirmation.
Entry zone: 4,040–4,050 if bullish confirmation appears
Stop loss: below the confirmed wave 4 low or below 4,030
Take profit 1: 4,090–4,100
Take profit 2: 4,138
Take profit 3: 4,145–4,155
Alternative scenario: if gold breaks above 4,100 without a pullback and holds strongly, price may continue directly towards the wave 5 target. In that case, a retest of 4,090–4,100 as support would become the cleaner continuation setup.
⌁ Kelly’s view
For Kelly, the bullish recovery structure is improving, but the market is now close to a short-term resistance zone. That means the best plan is patience.
If gold corrects into 4,040–4,050 and buyers defend the zone, the next wave 5 move may continue towards the higher Fibonacci target.
Gold is building a bullish Elliott structure.
A controlled pullback may prepare the next move higher.
Share your view below.
XAUUSD 1H | Bearish Market Structure & Order Block AnalysisXAUUSD continues to respect the overall bearish market structure on the 1-hour timeframe, with price trading below a descending trendline while consistently creating lower highs. The recent recovery appears to be a corrective move into an area where multiple technical factors align, making this a key decision zone for the next directional move.
The first Order Block (OB) is located around 4035–4042, where previous selling pressure originated. Above that, the major Order Block is positioned near 4060–4068, which also aligns closely with the Previous Day High (PDH). These zones may act as potential resistance if price continues to retrace.
The immediate support level is around 4002.70, which is currently acting as short-term structure support. Below this, the next important liquidity level is the Previous Day Low (PDL) near 3959.10, marked as the primary downside objective if sellers regain control. The Strong High around 4100 represents the major invalidation area for the current bearish structure.
From a market structure perspective, previous Break of Structure (BOS) and Change of Character (CHoCH) formations continue to favor sellers. As long as price remains below the descending trendline and fails to establish acceptance above the highlighted order blocks, the bearish bias remains valid. A rejection from either supply zone with bearish confirmation would strengthen the probability of another move toward lower liquidity.
The projected path on this chart illustrates one possible technical scenario based on the current structure. It is intended to demonstrate a potential market reaction rather than predict future price movement. Traders should always wait for confirmation through price action before making any trading decisions.
Key Technical Levels
Major Resistance: 4100 (Strong High)
Order Block 1: 4060–4068
Order Block 2: 4035–4042
PDH: Around 4020
Immediate Support: 4002.70
PDL / Main Downside Liquidity: 3959.10
Disclaimer: This analysis is provided for educational and informational purposes only. It reflects a personal interpretation of price action and market structure and should not be considered financial or investment advice. Always perform your own analysis and use appropriate risk management before entering any trade.
BITCOIN - A distribution toward 67K before a decline?BINANCE:BTCUSDT.P has transitioned from consolidation into a distribution phase following the breakout above resistance and is now advancing toward a key resistance zone within the broader bearish trend
The fundamental backdrop remains relatively weak for the cryptocurrency market. However, spot Bitcoin ETFs have recorded inflows for five consecutive trading sessions, providing short-term support for the current rally.
From a technical perspective, Bitcoin has broken above the 65,600 resistance level, and the momentum built during consolidation could drive price toward the 67,250 resistance zone. Nevertheless, given the prevailing higher-timeframe bearish trend, this area may act as a significant barrier and halt the advance
Resistance levels: 67,250
Support levels: 65,600, 63,800, 61,800
The broader market trend remains bearish. Price is approaching the key 67,250 resistance zone, where a short squeeze could shift momentum back in favor of sellers. If bears regain control at this level, Bitcoin could reverse and resume its primary downtrend toward 65,600, 63,800, and 61,800
Best regards,
R. Linda
What’s the Next Plan for Gold?Market Outlook
Trend
* The short-term trend is bullish after price broke above the descending trendline and established a Higher High – Higher Low market structure.
* However, price is currently undergoing a pullback after reaching a major resistance zone. The reaction around the breakout area should be monitored closely to confirm whether the bullish momentum will continue.
Resistance Level
🔵 4,105 – 4,107 – Major resistance, aligned with a key supply zone and the 1.618 Fibonacci extension.
* An H1 candle close above 4,105 would confirm the bullish continuation and open the door for further upside.
* If price is rejected at this level, a pullback toward the support zone is likely to build additional bullish momentum.
Support Level
🟢 4,030 – 4,032 – Immediate support, serving as both the breakout zone and a key demand area.
* Holding above 4,030 will maintain the short-term bullish structure.
* An H1 candle close below 4,030 would weaken the bullish momentum and increase the probability of a deeper pullback toward lower support levels.
⸻
Trading Plan
🟢 BUY GOLD
* Entry: 4,030 – 4,032
* Stop Loss: 4,020
* Take Profit: 200 / 500 / 1000 pips
🔴 SELL GOLD
* Entry: 4,105 – 4,107
* Stop Loss: 4,117
* Take Profit: 200 / 500 / 1000 pips
Risk Management
* Risk no more than 1–2% of your account equity per trade.
* Wait for confirmation before entering any position.
* Consider moving your Stop Loss to breakeven once the trade reaches a reasonable profit level to protect your capital and reduce risk.
ETHUSDT - The Battle for a Key Support Zone BINANCE:ETHUSDT.P is showing local bullish momentum and appears stronger than Bitcoin in the current market environment. Price action is focused on the 1800–1850 zone, where buyers and sellers are competing for control
Bitcoin remains in consolidation between 61,000 and 65,000, while the broader market trend is still bearish. The lack of both fundamental and technical support continues to weigh on the crypto market as a whole.
From a technical perspective, Ethereum has broken above resistance, confirming a short-term bullish structure. During the ongoing correction, price is respecting the local trendline while testing the 1808–1848 area of interest
Resistance levels: 1848, 1946, 1966
Support levels: 1833, 1807, 1774
The key trigger remains 1848. If bulls can establish sustained consolidation above this level, it could become the technical catalyst for a move toward 1945–1966
Best regards,
R. Linda
GOLD - A short squeeze before the decline continues toward 3900ICMARKETS:XAUUSD is hovering around the $4,000 mark on Monday, caught between bullish and bearish pressure as markets digest the ongoing escalation of tensions between the U.S. and Iran, while this week's U.S. economic calendar remains relatively light
The U.S. dollar remains in consolidation, although the Dollar Index (DXY) continues to maintain its broader bullish trend. Gold remains under pressure, and the daily technical outlook continues to favor the bears, limiting the potential for a sustained recovery. At this stage, there are few signs that this scenario will change in the near term.
Bearish drivers: Escalation of the U.S.–Iran conflict, supporting both the U.S. dollar and oil prices, Hawkish Federal Reserve rhetoric, Bearish technical market structure
Bullish drivers: Geopolitical de-escalation, Weaker-than-expected U.S. macroeconomic data, Profit-taking after recent declines
Resistance levels: 4028, 4043, 4065
Support levels: 3960, 3943, 3900
Gold remains under selling pressure due to a combination of technical and fundamental factors. The broader trend is still bearish. Technically, the market is confirming resistance around 4028.6, and a short squeeze into the 4028.6–4065 liquidity zone remains possible before the broader downtrend resumes toward 3940–3900
Best regards,
R. Linda
XAUUSD — Sell the 4,020–4,030 Retest
Fundamental Analysis
Gold remains sensitive to USD momentum, Treasury yields, and shifts in Fed rate expectations. Softer U.S. data could support a short-term recovery, but renewed dollar strength may keep the broader pressure tilted to the downside.
Technical Analysis
On the 1H chart, XAUUSD is trading near 4,004.55 below the marked 4,020–4,030 resistance zone. This area previously acted as support and may now become a sell zone after the breakdown. If price recovers into this region and fails to reclaim it, bearish continuation could target the strong support at 3,982.80 before extending toward the descending trendline near 3,925–3,930.
Important Key Levels
Current price: 4,004.55
Main sell zone: 4,020–4,030
Short-term support: 3,982.80
Short-term resistance: 4,020–4,030
Liquidity area: 4,090–4,108
Main target: 3,925–3,930
Invalidation: above 4,044.50
Trading Scenario
Main Sell Setup
Entry: 4,020–4,030
Stop Loss: 4,044.50
Take Profit 1: 3,982.80
Take Profit 2: 3,960
Take Profit 3: 3,925.80
Sell Condition
Wait for price to retest the 4,020–4,030 zone and show bearish rejection. A long upper wick, bearish engulfing candle, failed reclaim, or 1H close back below the zone may confirm seller pressure. If price breaks and holds above 4,044.50, the sell setup is no longer valid.
Overall View
The main bias remains bearish while XAUUSD stays below the former support zone and continues to respect the broader descending structure. The preferred plan is to wait for a recovery into 4,020–4,030 rather than chase price near current levels, with 3,982.80 as the first reaction area and 3,925.80 as the main downside target.
Do you also see 4,020–4,030 as the key sell zone, or are you waiting for a deeper liquidity sweep first?
GTYR — Spring After a Seven-Year Winter: Long-Term Accumulation Ghandhara Tyre and Rubber Company Limited has spent approximately seven years declining from its previous major cycle peak. The prolonged downtrend has now been broken, while price continues to stabilize inside a broad three-year accumulation structure.
Significant fundamental catalyst
On July 15, 2026, GTYR announced that it had obtained certification from the United States Department of Transportation, confirming compliance with applicable US vehicle-safety standards and enabling the company to export tyres to the United States. This development may support export diversification and access to a substantially larger international market.
Technical Structure
The weekly chart shows three important developments:
• The seven-year descending trendline has been broken.
• Price has repeatedly attracted demand within the approximately PKR 20–35 buying zone.
• A multi-year accumulation range is developing below the PKR 55–60 resistance area.
The recent recovery may represent the early stage of a structural transition from long-term accumulation into a potential markup phase.
Bullish Confirmation
The bullish thesis would gain strength if GTYR:
• Produces a sustained weekly close above PKR 55–60
• Retests the breakout area successfully as support
• Develops a sequence of higher highs and higher lows
• Breaks resistance with expanding volume
A confirmed breakout could initially expose PKR 75–90, followed by PKR 115–125. Under a full long-term re-rating scenario, the previous cycle-high region around PKR 165–175 could eventually become relevant.
Risk and Invalidation
The projected 400% upside represents a long-term potential scenario, not an immediate or guaranteed target.
Failure to break the accumulation ceiling may keep GTYR range-bound. The setup would weaken if price loses the PKR 25–30 area on a sustained weekly closing basis, while a decisive breakdown below the long-term buying zone would invalidate the present accumulation thesis.
Conclusion
After a seven-year structural decline and nearly three years of base-building, GTYR may be entering an important transition period. The break of the long-term downtrend, combined with the new US export certification, creates a constructive long-term narrative.
However, confirmation still requires a decisive breakout and successful retest of the accumulation range. Until then, this remains a developing bullish thesis rather than a confirmed expansion.
This analysis is for educational purposes only and does not constitute financial advice.
XAUUSD: Weekly Downside Still Targets the Final Wave 5 Zone
Gold is still trading inside a broader bearish structure, and the weekly outlook continues to favour downside continuation. From Kelly’s view, the latest recovery looks more like a corrective rebound into resistance, while the main Elliott structure still suggests that wave 5 may extend lower.
The key idea is simple: as long as gold remains below the descending trendline and the sell wave B zone, the bearish weekly scenario stays active.
⟡ Market structure
The chart shows gold has been respecting a clear descending trendline, with repeated lower highs forming across the structure. Each recovery attempt has been capped under resistance, showing that buyers still lack strong control.
Price recently tested the lower support around 3,955–3,970 and bounced slightly, but the rebound is still weak. The nearest sell area is around 4,017–4,025, where the chart marks the sell wave B zone.
If gold retests this zone and fails to break above it, sellers may continue pushing price lower towards the final Elliott wave target near 3,845–3,855.
➤ Key levels
◌ 3,955–3,970: recent low and done test area
◌ 4,017–4,025: sell wave B zone and short-term resistance
◌ 4,050–4,075: higher resistance if the rebound expands
◌ 3,845–3,855: final wave 5 target area
◌ Above 4,075: area where the bearish weekly setup starts to weaken
⌁ Elliott Wave view
From an Elliott Wave perspective, gold appears to be developing the final bearish phase of a larger 5-wave decline.
Wave 1 started from the upper structure.
Wave 2 formed a corrective rebound but failed below trendline resistance.
Wave 3 pushed price lower with stronger bearish pressure.
Wave 4 may now be forming as a small recovery into the sell wave B zone.
If this resistance holds, wave 5 may continue lower towards the 1.618 Fibonacci extension area near 3,845–3,855.
This is why Kelly would not treat the current bounce as a full reversal yet. The market is still below the descending trendline, and the structure continues to favour sell reactions from resistance.
▸ Trading scenario
Preferred scenario: wait for gold to retest the 4,017–4,025 sell zone and show bearish confirmation.
Sell zone: 4,017–4,025 if rejection appears
Stop loss: above the confirmed rejection high or above 4,075
Take profit 1: 3,955–3,970
Take profit 2: 3,900
Take profit 3: 3,845–3,855
Alternative scenario: if gold breaks above 4,075 and holds with strong acceptance, the bearish wave 5 setup weakens. In that case, the market may shift into a larger corrective recovery before the next weekly direction becomes clear.
⌁ Kelly’s view
For Kelly, the weekly structure still favours selling the rebound. Gold has reacted from support, but the bounce remains corrective while price stays below the sell wave B zone and the descending trendline.
The cleaner plan is not to chase the low. Wait for price to retest resistance, then watch whether sellers defend the structure.
Gold may still have one more bearish leg ahead.
If the sell zone holds, the final wave 5 target remains open for next week.
Share your view below.
How Will Gold React After the Major Economic News?Market Outlook
Trend
* The medium-term trend remains bearish, with price continuing to trade within a descending channel and still unable to break the Lower High market structure.
* Price is currently reacting from the 3,963 support zone, but it must break above the descending trendline to confirm a bullish reversal.
Resistance Levels
🔵 4,095 – Immediate resistance, aligned with the descending trendline and a key supply zone.
🔵 4,200 – Major resistance and the next upside target if a successful breakout occurs.
* An H4 candle close above 4,095 would confirm a breakout from the descending channel and open the door for further gains toward 4,200.
* If price is rejected at this level, the bearish trend is likely to resume.
Support Levels
🟢 3,963 – Immediate support and a key demand zone currently supporting price.
🟢 3,850 – Strong support and the next downside target if the current support is broken.
* Holding above 3,963 keeps the short-term recovery scenario intact.
* An H4 candle close below 3,963 would confirm a bearish breakout and increase the probability of a decline toward 3,850.
⸻
Trading Scenarios
📈 Bullish Scenario: Price holds above 3,963 and breaks above 4,095, opening the way toward 4,200.
📉 Bearish Scenario: An H4 candle closes below 3,963, targeting 3,850. Alternatively, if price rallies to 4,095 but is rejected, the preferred strategy remains to sell in line with the prevailing downtrend.
Gold 4H Outlook — 3960 Support Holds, 4360 Resistance in focus XAUUSD is currently reacting from the key 3940–3970 support zone, where buyers have shown strong interest and defended the area multiple times.
Price remains below a descending trendline, so a confirmed breakout and bullish market structure shift could strengthen the upside scenario. Initial liquidity targets sit around 4080–4200, while the major upside objective remains the 4360–4380 resistance zone.
A short-term liquidity sweep near support is still possible before a larger bullish expansion. As long as the key support holds, the broader bullish scenario remains in focus.
Not financial advice.
XAUUSD — OB Reaction, Trendline Break Can Confirm Recovery
Gold is trading around $4,017 after reacting strongly from the lower OB and buy zone liquidity around $3,985–$3,992. This is an important area on the medium-term structure because price has already tested the lower reaction zone several times, and sellers failed to create a clean continuation below it.
From an SMC perspective, gold is still moving inside a broad corrective structure, but the reaction from the lower OB shows that buyers are starting to defend the discount area. The key point now is the descending trendline. If gold can stay above this trendline and build acceptance above the current range, the recovery structure can become stronger.
The current market is not a place to chase. The clean plan is to wait for price to respect the $3,985–$3,992 buy zone or confirm strength above the trendline. If buyers continue to defend this area, gold may recover toward the VL zone first, then the upper OB area around $4,100–$4,125.
Buy setup 1
Condition:
Gold holds the buy zone liquidity around $3,985–$3,992 and forms bullish rejection with lower timeframe MSS / CHOCH.
Entry: $3,985–$3,992
SL: below $3,950
TP1: $4,030
TP2: $4,060
TP3: $4,100–$4,125
TP4: $4,175
Buy setup 2
Condition:
If gold breaks above the descending trendline and retests it as support, bullish recovery becomes stronger.
Entry: above $4,030–$4,040 after breakout retest
SL: below $3,985
TP1: $4,060
TP2: $4,100–$4,125
TP3: $4,175
TP4: $4,220
Buy setup 3
Condition:
If gold sweeps below $3,985 but quickly reclaims the buy zone, this can create a stronger liquidity-trap buy setup.
Entry: after reclaim above $3,985–$3,992
SL: below the sweep low
TP1: $4,030
TP2: $4,060
TP3: $4,100–$4,125
Sell setup
Condition:
Selling is not the main priority while price is reacting from the lower OB. A sell setup is only valid if gold fails to hold above $3,985–$3,992 and breaks the lower structure clearly.
Entry: below $3,950 after breakdown retest
SL: above $3,985
TP1: $3,920
TP2: $3,880
TP3: $3,830–$3,850
Sell scalping setup
Condition:
If gold reaches the upper OB around $4,100–$4,125 and shows clear bearish rejection, a short-term sell scalp may appear.
Entry: $4,100–$4,125 after rejection
SL: above $4,150
TP1: $4,060
TP2: $4,030
TP3: $3,985–$3,992
Key levels
Current price area: $4,017
Buy zone liquidity: $3,985–$3,992
Strong reaction OB: $3,950–$3,970
Trendline confirmation area: $4,030–$4,040
Short-term resistance: $4,060
VL reaction zone: $4,090–$4,105
Upper OB target zone: $4,100–$4,125
Bullish continuation confirmation: clean hold above the descending trendline
Stronger bullish confirmation: clean break above $4,125
Bearish continuation confirmation: clean break below $3,950
Bearish target zone if structure fails: $3,830–$3,850
My current view is that gold is reacting from a medium-term OB support area, and the recovery can become stronger if price holds above the descending trendline. The Prime Gold plan is to avoid selling directly into the lower OB and wait for confirmation around $3,985–$3,992 or a clean breakout above the trendline. If buyers defend this structure, gold can continue toward $4,060, $4,100–$4,125 and potentially higher liquidity.
No confirmation, no trade.
MASON XAUUSD – Medium-Term Recovery Setup
Gold is trading around 4,017 after reacting near the lower part of the descending channel. The main medium-term idea for next week is a bullish correction, but confirmation is still needed because price remains inside the larger bearish channel.
Technical View
On the H4 chart, gold is still moving inside a wide descending channel, but price is now reacting from the lower channel area and liquidity zone. This suggests sellers may start losing momentum in the short term.
The recent structure also shows a possible recovery base after price swept liquidity around 3,950–4,000. If gold can hold above this area and reclaim the 4,100–4,120 zone, the bullish correction scenario becomes stronger.
The first important upside level is 4,203, marked as strong liquidity. A clean break above this zone could open the way toward the higher resistance area around 4,350–4,380, where the chart shows the next major supply zone.
Key Zones
Current price: 4,017
Main liquidity support: 3,950–4,000
Key buy/reclaim zone: 4,100–4,120
Strong liquidity target: 4,203
Major resistance: 4,350–4,380
Invalidation: below 3,950
Trading Plan
Priority Buy Scenario – Medium-Term Correction
Entry zone: 4,100–4,120 after reclaim and retest
Confirmation: H4 candle holds above the zone with bullish price action
Stop loss: below 3,950
Take profit 1: 4,203
Take profit 2: 4,350
Take profit 3: 4,380
Alternative Scenario
If gold drops once more into 3,950–4,000 and shows a clear rejection, this area can become a lower buy reaction zone. The first target would be 4,100–4,120, then 4,203 if momentum improves.
Sell View
Selling is not the priority for this plan. A sell view only becomes stronger if gold loses 3,950 and fails to recover back above the liquidity zone.
Final View
The main view for next week is a bullish correction from the lower channel area. Gold needs to reclaim 4,100–4,120 first, then 4,203 becomes the key level to watch for stronger upside continuation. No confirmation means no trade.
XAUUSD – Bearish Continuation Toward Fibonacci Target
XAUUSD is trading around 3,990 after failing to recover above the short-term downtrend structure. Price remains below the previous support area, and the current reaction still looks like a weak correction inside the bearish trend.
The priority view remains sell with the trend, especially if gold retests the 4,020–4,040 reaction zone and fails to break above the psychological sell order area.
Technical View
Gold is still moving under bearish pressure after the strong breakdown from the previous consolidation zone. The market failed to hold above the old support, and price is now trading below the short-term downtrend trendline.
The 4,020 area is the first reaction zone to watch. This level was marked on the chart as an important area for price reaction. If gold pulls back into this zone and shows rejection, it may confirm that buyers are still weak.
The 4,035–4,040 area is the main psychological sell order zone. This zone is important because it aligns with the Fibonacci reaction area and the previous breakdown structure. If price reaches this area and fails to continue higher, it may confirm another lower high before the next bearish leg.
The 3,969 support is the nearest downside level. If gold breaks below this area, the bearish structure may continue toward the Fibonacci 1.618 target around 3,945–3,950.
The main idea is simple: as long as gold stays below 4,020–4,040, the market remains under selling pressure, and recovery attempts should be treated as corrective.
Key Zones
Current price: 3,990
Price reaction zone: 4,020–4,025
Psychological sell order zone: 4,035–4,040
Downtrend resistance: 4,000–4,020
Nearest support: 3,969
Fibonacci 1.618 target: 3,945–3,950
Invalidation: above 4,045
Trading Plan
Sell Priority: 4,020–4,040
Condition: wait for bearish rejection, failed recovery above the downtrend trendline, or price staying below the psychological sell order zone.
SL: above 4,045
TP1: 3,969
TP2: 3,945–3,950
TP3: 3,920–3,930
Alternative Scenario
If gold breaks below 3,969 directly, wait for a retest of this level as resistance before looking for sell continuation toward the Fibonacci 1.618 target around 3,945–3,950.
Buy View
Buy is not the priority while price remains below the downtrend trendline and below the 4,020–4,040 resistance area. A short-term buy reaction may appear near 3,945–3,950, but it needs clear bullish confirmation first.
Final View
Overall, gold remains in a bearish continuation structure. The cleaner plan is to wait for price to retest the 4,020–4,040 sell zone and watch for rejection. As long as this area holds as resistance, the downside path toward 3,969 and the Fibonacci target around 3,945 remains in focus.
Will gold reject from the psychological sell zone first, or break below 3,969 directly toward the Fibonacci target?
EURUSD — Bullish Channel Retest Setup
Fundamental Analysis
EURUSD is still reacting to USD momentum and upcoming macro data. For now, the short-term structure remains positive while price continues to respect the rising channel.
Technical Analysis
On the 2H chart, EURUSD is trading around 1.1437 and holding inside a clear bullish channel. The key buy zone is around 1.1415 - 1.1420, where the 0.382 Fibonacci area, FVG support, and lower channel reaction align. If price holds this value zone, buyers may push EURUSD back toward 1.1487, then the resistance and Fibonacci target around 1.1519 - 1.1526.
Important Key Levels
Current price: 1.1437
Main buy zone: 1.1415 - 1.1420
Short-term support: 1.1403
Liquidity area: 1.1487
FVG resistance: 1.1490 - 1.1510
Main target: 1.1519 - 1.1526
Invalidation: below 1.1403
Trading Scenario
Main Buy Setup
Entry: 1.1415 - 1.1420
Stop Loss: 1.1403
Take Profit 1: 1.1487
Take Profit 2: 1.1510
Take Profit 3: 1.1519 - 1.1526
Buy Condition
Wait for EURUSD to retest the 1.1415 - 1.1420 buy zone and show bullish rejection. A clean hold above this area keeps the bullish channel valid. If price breaks above 1.1487, upside momentum may extend toward the Fibonacci resistance zone at 1.1519 - 1.1526. If price breaks and holds below 1.1403, the buy setup is invalid.
Overall View
EURUSD remains bullish while price stays inside the rising channel and holds above the 0.382 Fibonacci value zone. The preferred plan is to wait for confirmation around 1.1415 - 1.1420, then look for continuation toward 1.1487 and 1.1519 - 1.1526.
Do you share the same bullish view on EURUSD, or are you waiting for a cleaner retest of the buy zone first?