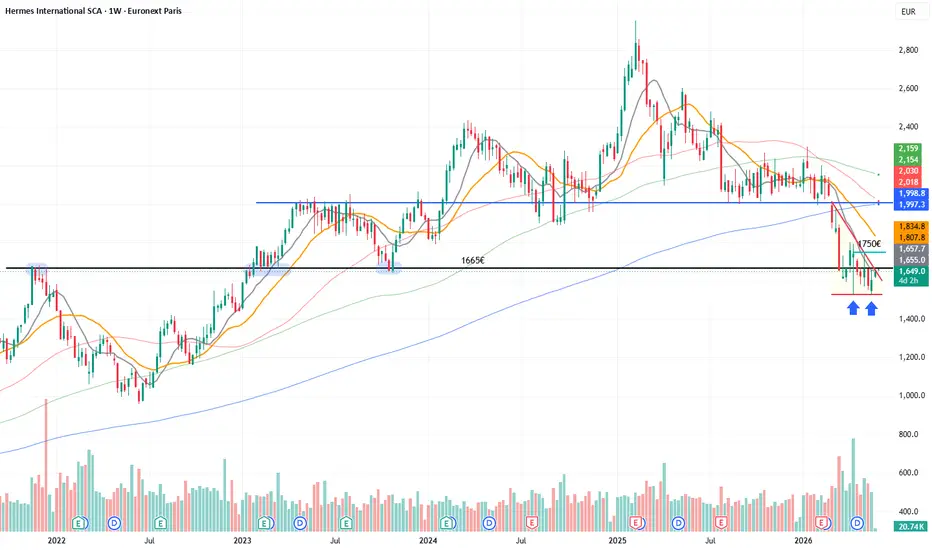
Red triangleAn interesting chart structure with two possible outcomes yet to be determined.
The price is moving within the red triangle and is currently near the upper boundary.
A bullish view suggests a potential breakout followed by the completion of a double bottom pattern, with the neckline at €1,750.
Conversely, in a bearish scenario, the price has just been rejected by the weekly SMA10 near the upper edge, with a probable return toward the bottom of the triangle, where a bearish breakout could follow.
I’ve noticed that many stocks in the luxury sector are currently sitting just below major resistance levels awaiting a breakout... what is about to happen?
This is just food for thought, as I believe the best move is to place some alert, wait and see which side of the triangle breaks first.
Keep a close eye on the volumes!
Triangle
EURUSD - Consolidation above key resistanceFX:EURUSD opened the week with a bullish gap amid hopes for a U.S.-Iran peace deal, erasing the previous week’s decline to a low of 1.1575
The euro is caught in a stagflation trap: weak PMIs and the risk of recession are causing the market to doubt the ECB’s ability to tighten policy, despite inflation above 3%. Technically, the focus is on the 1.16357–1.1660 range. Continued optimism regarding the situation in the Middle East could support further gains (the market may strengthen from 1.1635 toward 1.168–1.1722)
Resistance levels: 1.1635, 1.168, 1.1722
Support levels: 1.1627, 1.1583
Technically, there are attempts to break the local structure; the reason is a gradual shift in the geopolitical backdrop and a weakening dollar, which presents opportunities for the euro.
If the bulls keep the price above 1.1635, this could become a technical driver for growth
Best Regards, R. Linda!
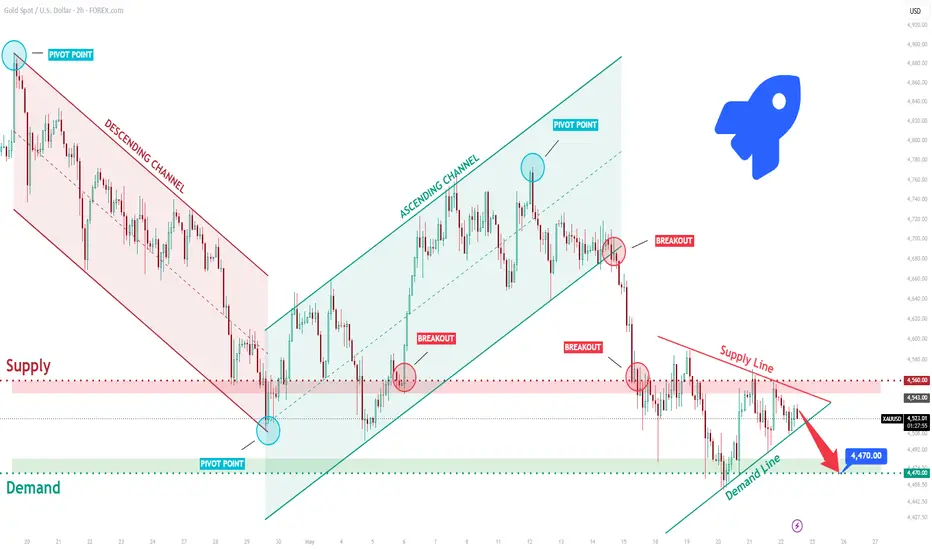
XAUUSD Short: Pressure Below Key Supply Zone - 4,470 Next TargetHello traders! Here’s my technical outlook based on the current XAUUSD (2H) chart structure. XAUUSD previously traded inside a descending channel before forming a major pivot point near the 4,470 demand zone. After that reversal, price entered an ascending channel and attempted to recover bullish momentum.
Currently, XAUUSD is trading below the 4,560 supply zone while forming a lower high structure under the descending supply line. Recent breakout attempts near resistance failed to hold, confirming that sellers remain active.
As long as XAUUSD remains below the 4,560 resistance zone and continues to respect the descending supply line, the bearish scenario remains valid. A continuation lower could push price toward the 4,470 demand zone (TP1). Manage your risk!
GOLD - The geopolitical backdrop is changing ICMARKETS:XAUUSD closed Friday’s session near 4,500 and looks fairly weak, with a bearish bias. However, the geopolitical backdrop is shifting over the weekend, which could trigger a gap or a locally positive tone in the market
Following a phone call between Middle Eastern countries and the U.S., Trump stated: “The agreement is largely agreed upon and awaits final approval between the United States of America, the Islamic Republic of Iran, and various other countries.”
On May 22, the new Fed Chair Kevin Warsh was officially sworn in, promising a “reformist” approach but emphasizing independence from the White House. Key catalysts for the coming week: U.S. GDP data (Q1), core PCE (the Fed’s inflation indicator, May 28), as well as developments in the Iran negotiations.
Resistance levels: 4540, 4589, 4646
Support levels: 4500, 4488, 4465
Technically, the market may react quite positively to the shift in the geopolitical backdrop. Bulls may hold the 4500 area, and at the session open, the price may open with an upward gap or continue its movement sharply; a breakout of the local trend line could strengthen the momentum.
There is a possibility of growth to 4589 - 4646 - 4734
Best regards, R. Linda!
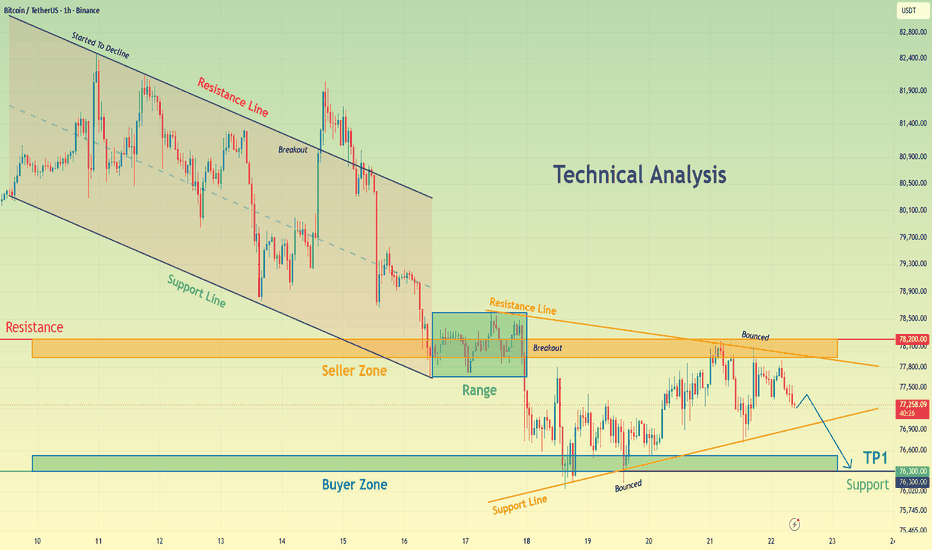
BTCUSDT Triangle Breakdown Setup - Bears Eye 76,300 SupportHello traders! Here’s my technical outlook based on the current BTCUSDT (1H) chart structure. BTCUSDT previously traded inside a descending channel, confirming bearish market pressure. Currently, BTCUSDT is trading below the 77,800 seller zone while holding above the 76,300 buyer zone, which acts as the key support area. Price recently formed a tightening triangle structure and failed to break above the descending resistance line, signaling that sellers remain active and bearish momentum is still dominating the market. As long as BTCUSDT remains below the 77,800 resistance zone and continues to respect the descending resistance structure, the bearish scenario remains valid. A continuation lower could push price toward the 76,300 support zone (TP1). Please share this idea with your friends and click "Boost" 🚀
EJ Forms "Symmetry" but Signals A Breakout Soon This year, OANDA:EURJPY has found itself quite Consolidated between a 181 and 187 price range, while currently trading around 184.
Within the past couple weeks, we can see an even tighter Consolidation happening in the form of what is called a Symmetrical Triangle!
Now a Symmetrical Triangle forms when a balance is found between the Buyers (Bulls) and Sellers (Bears) with a Falling Resistance and a Rising Support into a fairly tight Price Point where typically we see price make an extreme Breakout of either the Resistance or Support leg of the Pattern, verifying either the Bulls or Bears have won out.
Now respectfully, either scenario is possible so it is important to wait for a Valid Breakout and Successful Retest with added Confirmation.
- Indicators like Volume, RSI and the MACD all show tells that this pair is truly in a Consolidation Phase and with a Breakout, will exhibit strong fluctuations in data strengthening the Bullish or Bearish Breakout!
Fundamentally, we seen a great deal of Bullish outcomes in the month of May for the JPY like:
- M2 Money Stock y/y posting a .3% increase from 2% to 2.3% meaning more money is circulating in the Japanese economy meaning consumers and businesses have greater access to finances.
- PPI y/y increasing 2% from 2.9% to 4.9% meaning the expectations of Interest Rate hikes could rise given the Producers Price Index is typically found as a good warning tool for early Inflation.
Also lets not forget the serious Intervention we witnessed with the JPY talked about by Japan Finance Minister to help "prop up" and stabilize the falling Japanese Yen!
This week EUR and JPY will have market moving news events so stay vigilant!
GBP/JPY — Ascending Channel + BOS Recovery | Targeting 215.01–21GBP/JPY has been trading within a well-defined ascending channel since the April lows, printing a series of higher lows and higher highs. The pair has respected the channel's lower boundary multiple times, confirming trend integrity. After a sharp May selloff that swept equal lows (EQL) and triggered stops below the prior BOS level near 213.00, price is now showing signs of recovery from within the demand zone (green box) just above the strong low at 210.857.
The Break of Structure (BOS) to the upside earlier in the cycle confirmed bullish intent, and the current pullback into the 213.25–213.45 zone represents a classic retracement into the last point of structure before the next leg higher. Price has also formed an EQL (equal lows) around 213.25, creating a liquidity pool that smart money may now be using as a springboard.
Above, a $$$$ liquidity cluster at 215.012 and a clearly marked weak high near 215.80–216.00 form the primary targets. Beyond that, the supply zone at 216.498–216.641 (visible as the red shaded area) is the ultimate draw — a zone where the May spike originated and where institutional sell orders are likely clustered.
The Bank of England event flagged on the chart (2 days ago) has already passed without derailing the bullish structure, supporting the case that GBP remains fundamentally underpinned. Price continuing above the ascending channel lower boundary keeps the long bias firmly intact.
Entry: 213.25–213.45 — demand zone / EQL support
Stop Loss: 210.857 — below the strong low (full invalidation)
TP1: 215.012 — $$$$ liquidity cluster
TP2: 215.80 — weak high
TP3: 216.498–216.641 — supply zone (origin of May spike)
Risk/Reward: ~5.8R to TP2 | extends to ~8R at TP3
Confluences:
Ascending channel lower boundary holding as support
BOS structure intact — higher highs, higher lows confirmed
EQL sweep complete — demand zone now active
Stacked liquidity pools at 215.01, 215.80, and 216.50 acting as upside magnets
Bank of England event already passed — GBP structure undisrupted
Trade management: Take 50% off at TP1, move stop to breakeven, let the rest run to supply zone.
Invalidation: 4H close below 210.857 (strong low) = full thesis failure. Early warning on a close below 212.29.
GBPUSD - Short squeeze at a key resistance levelFX:GBPUSD is forming a correction toward the resistance zone, where bears are aggressively attempting to hold their ground. Fundamental factors are creating downward pressure
The Bank of England’s rate remains at 3.75% for the third consecutive quarter. Inflation in the UK has slowed more than expected. Pressure on the dollar persists: the minutes of the April FOMC meeting showed that most Fed members are open to raising rates.
Technically, the British pound is under pressure. Bears are aggressively holding the resistance zone at 1.3447–1.3483, while speculators are building up short positions. Market participants remain predominantly bearish on the British currency
Resistance levels: 1.3447, 1.3483
Support levels: 1.3305, 1.3173
A short squeeze and consolidation below resistance could serve as a technical driver for a further decline toward 1.33
Best Regards, R. Linda!
BITCOIN - The hunt for liquidity ahead of the fall BINANCE:BTCUSDT.P has hit a new low of $76K and is testing local support; due to a lack of liquidity, the market may form a correction toward the imbalance zone...
Bitcoin’s global trend is bearish, within which a local bullish channel is forming, aimed at consolidation. A break of the local upward support returns the market to a bearish environment.
Technically, the price is testing the 76,100 support level and forming a correction aimed at seeking liquidity. Key levels to watch include 78,300, 78,700, and 79,460. A short squeeze and the formation of a reversal pattern could return the price to a downward trend
Resistance levels: 77,600, 78,700, 79,460
Support levels: 76,100, 75,600
Focus on the 77,600 consolidation resistance; a breakout could trigger an upward impulse toward the 78,700 imbalance zone in a liquidity hunt. A short squeeze in the resistance zone could return Bitcoin to a downtrend.
Best Regards, R. Linda!
US Oil - Corrective OpportunityThe US Oil chart formed its high on the 9th of March and has been in a sideways corrective since then. The chart clearly shows that Wave A of the corrective was quick and strong, making a low of 76 (from a high of 119) within a day. Following this move, Wave B began its upward/sideways journey in the form of a triangle (which usually follows such quick and strong moves) The market has been slotted and has completed a perfect triangle pattern ending on the 18th of May. The final C wave is now pending providing traders with a great opportunity as we have a defined stop loss and a high probability of a quick downside move back to 75 levels.
EURUSD Weekly: Symmetrical Triangle Breakdown Setup Facing 200 SThe EUR/USD is presenting a highly structured macro setup on the Weekly Chart ($W1$), signaling a major volatility expansion as price action approaches the apex of a long-term symmetrical triangle.
As a swing and position chartist, looking at higher timeframes filters the noise and highlights where big institutional moves are preparing to unfold.
### Key Technical Elements:
* **Weekly Triangle Compression:** The exchange rate has been consolidating within a large triangle structure, respecting the upper descending trendline (LTB) and the lower ascending trendline (LTA).
* **The 200-Period Simple Moving Average (200 SMA):** The purple line currently sits around the crucial macro support zone of **1.12180**. This serves as our ultimate target if the bearish breakdown triggers.
### Strategic Scenario (The Break & Retest Plan):
The red arrow perfectly illustrates the high-probability price path I am actively monitoring:
1. **The Breakdown:** We wait for a clean weekly candle close below the lower ascending trendline support.
2. **The Retest:** Following the breakdown, we anticipate a corrective bounce back to retest the broken LTA (which should now act as a new resistance area). On lower timeframes (such as Daily or H4), this move will likely respect the short-term descending market structure.
3. **The Target:** Once the retest fails and confirms institutional selling pressure, the momentum should accelerate downward toward the **200 SMA target region at 1.12180** (highlighted by the orange circle).
### Execution Note:
Patience is paramount. This is a macro weekly study, so we do not chase the market. We wait for the structural break and confirmation before looking for position entries.
---
📊 **ProData Chart** | By Rogerio Zaglia
*12+ years of daily global market technical analysis.*
⚠️ **Disclaimer:** This analysis is for educational and informational purposes only. It does not constitute financial advice or an investment recommendation. Past performance is not indicative of future results.
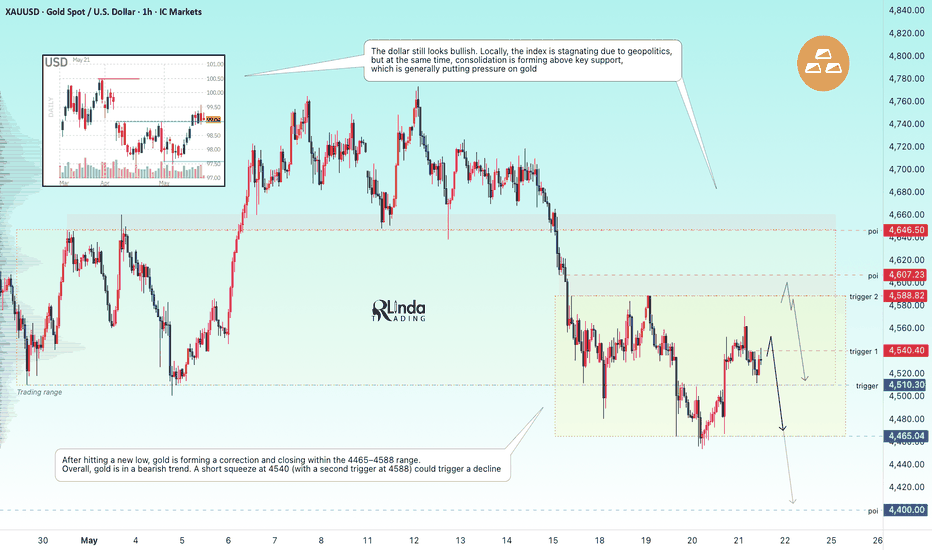
GOLD - The pressure of the global bearish trendICMARKETS:XAUUSD is trading near the key daily support level of 4,510; the reaction within the long squeeze is weak, and the market continues to maintain a bearish structure. Meanwhile, the dollar is stagnating
Gold received support from geopolitical optimism on Wednesday, but the Fed’s hawkish stance and the possibility of a breakdown in negotiations are holding back gains. Today’s PMI data and developments regarding Iran will determine whether gold can hold above $4,600
Technically, the market is under pressure from bears within the medium-term trend. Locally, the focus is on two key triggers: the control point and the liquidity zone at 4,540. The second key zone is the resistance of the current local range at 4,588–4,607.
Resistance levels: 4,540, 4,588, 4,607
Support levels: 4,510, 4,565, 4,400
Locally, the dollar is stagnating due to geopolitics, but at the same time, consolidation is forming above key support, which is generally putting pressure on the metal. After hitting a new low, gold is forming a correction and closing within the 4465–4588 range; the reaction from the bulls is relatively weak. A short squeeze at 4540 (second trigger at 4588) could trigger a decline. A close below 4510 could trigger a drop to 4400
Best Regards, R. Linda!
Crude Oil (WTI) Daily: Symmetrical Triangle Compression and Key Crude Oil (WTI Futures - CL1!) is presenting a highly strategic technical setup on the Daily Chart, characterized by structural compression and strong horizontal resistance zones.
After hitting a major peak, the asset has entered a consolidation phase, forming a well-defined Symmetrical Triangle pattern (highlighted by the orange circle).
### Key Technical Factors:
* **The Compression Zone (Orange Circle):** Price action is currently trapped within a symmetrical triangle. This pattern reflects a period of market indecision, with volatility compressing. A powerful breakout is looming as the price approaches the apex.
* **Major Overhead Resistance (105.17):** The red horizontal line at 105.17 stands as a critical barrier. Higher institutional supply zones are clearly mapped above at 109.74, 116.06, and 118.89.
* **The 200-Period Simple Moving Average (200 SMA):** The purple line (currently around the 78.00 area) represents the ultimate long-term baseline support.
### Scenario / Strategy (If / Then Approach):
The arrows inside the triangle illustrate the short-term ping-pong behavior before a definitive directional breakout occurs.
* **Bearish Breakout Scenario:** If WTI breaks down from this triangle and clears the immediate horizontal support, the path opens for a deep corrective move. The primary macro target for this downside scenario is the rising **200 SMA near the 78.00 region**, which would offer a massive institutional buying test.
* **Bullish Breakout Scenario:** A strong daily close above the upper trendline of the triangle—and subsequently breaking the major **105.17 resistance**—would invalidate the bearish thesis and signal a continuation of the macro rally toward 109.74 and higher.
Patience is key while the price remains inside the indecision zone. We wait for the confirmed breakout.
---
📊 **ProData Chart** | By Rogerio Zaglia
*12+ years of daily global market technical analysis.*
⚠️ **Disclaimer:** This analysis is for educational and informational purposes only. It does not constitute financial advice or an investment recommendation. Past performance is not indicative of future results.
Gold Running Out of RoadDespite falling bond yields, a slight softening in dollar and buoyant risk appetite, gold hasn’t been able to capitalise in this much friendlier market environment; perhaps there’s a message in that?
The price finds itself coiling within a compression structure having entered it from above, warning that if there is to be an eventual breakout, it may be to the downside rather than upside. However, with the oscillators more neutral than bearish in their messaging on the H4 timeframe, price action carries greater weight on when and if to act.
Should we see a clean downside break of the structure, shorts could be set with a tight stop above the former uptrend for protection, targeting $4544 where the structure originally formed. A break of that level would open the door for a more pronounced unwind towards the April 27 swing low of $4352.
But if the price stages a bullish breakout of the structure, it would also allow for longs to be set with a tight stop beneath the former downtrend, targeting $4587 initially with $4640 another option after that.
Beyond technicals, gold continued to demonstrate a tighter relationship with riskier asset classes than havens when it comes to directional movements, meaning the chances of a breakout sticking would likely be improved by complementary risk appetite across broader markets.
Good luck!
DS
COIN Ascending Triangle Setup—Watching for Breakout ContinuationWe already caught a strong earnings move in our previous Coinbase analysis, where NASDAQ:COIN surged nearly 44%. Now, the chart is presenting another interesting setup as price forms a clean ascending triangle pattern on the higher timeframe.
COIN has now reached the apex of the triangle, which means the market is getting closer to a potential breakout decision. As long as buyers continue defending the structure, this setup favors a possible long trade continuation toward the next resistance zones.
The plan is to look for a long entry near the current support area and ride the move toward the breakout zone. However, proper risk management is important because a breakdown below support would invalidate the bullish setup.
Trading Levels
Entry Zone: Around $190
Take Profit 1: $205
Take Profit 2: $216
Stop Loss: $179
Risk Management: If COIN breaks below $179, the bullish structure becomes invalid, and the trade should be avoided or closed.
M/USDT Short Setup!Hey Traders! 👋
If you’re enjoying this analysis, smash that 👍 and hit Follow for high-accuracy trade setups that actually deliver! 💹🔥
M is showing a clear bearish structure with price breaking down from a converging trendline pattern and continuing lower.
📉 Market Structure:
• Trendline breakdown confirmed
• Lower highs forming
• Weak price action after breakdown
🎯 Trade Plan:
👉 Entry: CMP + add up to $2.96
👉 Stop Loss: $3.08
👉 Target: $1.55 area
⚠️ As long as price stays below the resistance zone, downside remains in control.
💡 Clean breakdown + continuation structure = strong short bias
📌 Follow the trend. Manage risk. Stay disciplined.
💬 What’s Your Take?
Drop your analysis and predictions below—let’s navigate this together and secure those gains! 💰
WTI on the verge of a breakoutIn the commodities space, oil prices remain the dominant driver of market sentiment. From a technical perspective, there are two symmetrical triangles (‘coils’) in play right now – the larger of the two is taken from US$119.42 and US$76.74, while a smaller formation can be seen between US$117.54 and US$79.01. The reason I have not labelled these as pennant patterns is simply the asymmetry between the ‘pole’ and the pattern; I believe they are symmetrical triangles.
Regardless of the name behind the pattern, you will note that the smaller formation has price fast approaching its apex, thereby highlighting a potential breakout play, with the larger formation's boundaries serving as logical targets.
Written by FP Markets Chief Market Analyst Aaron Hill
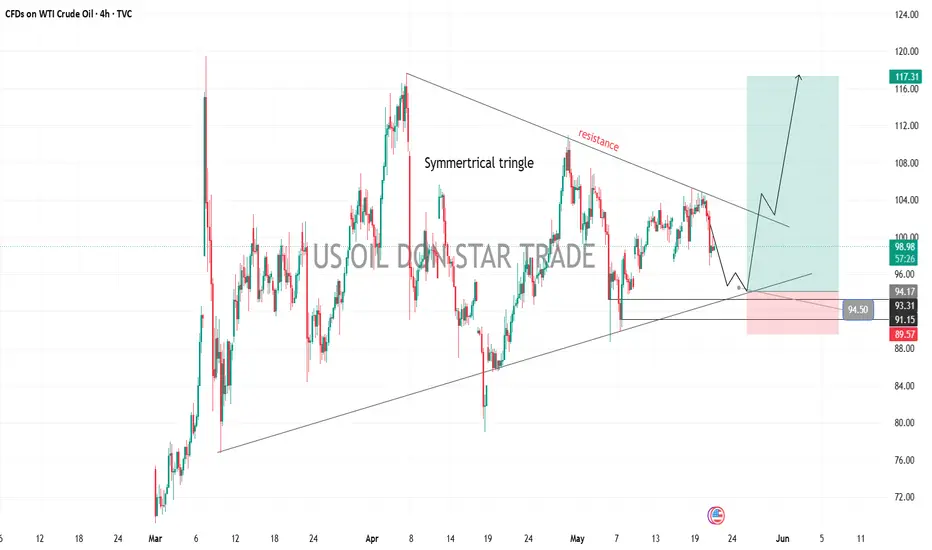
US OIL Symmetrical tringle Setup USOIL on the 4H timeframe is currently trading inside a well-respected symmetrical triangle pattern, showing clear compression between descending resistance and ascending support.
Price is now approaching a critical support zone near 95, where buyers may step in for a potential bullish continuation. The current structure suggests that a fake breakdown followed by a strong breakout above resistance could trigger an impulsive bullish move.
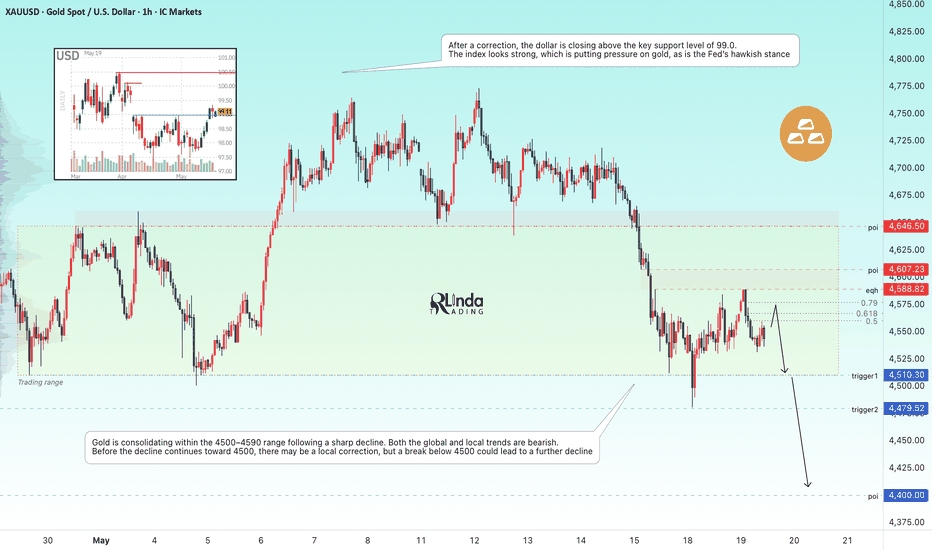
GOLD - Pre-break consolidation around 4500 ICMARKETS:XAUUSD is under pressure from a bearish trend on both the local and global scales. The strong dollar is attracting capital. The market is digesting the latest developments surrounding the U.S.-Iran conflict
The market did not buy into the “TACO” narrative, remaining cautious. Geopolitics is at an impasse, which is also putting pressure on gold through high oil prices.
The inflation shock on May 12–13 (CPI 3.7% y/y, PPI 6.0% y/y) has completely ruled out expectations of rate cuts in 2026, triggering a flight to safe-haven assets (the dollar).
Gold’s next move depends on developments in the Middle East. If stagflation risks return to the forefront, U.S. bond yields may resume their rise, putting further pressure on the non-yielding yellow metal
Resistance levels: 4588, 4607, 4646
Support levels: 4510, 4479, 4400
Globally, the focus is on the key support level at 4510. A break below this level could trigger a further decline toward 4400. However, locally, gold is consolidating between 4510 and 4588 and may remain within these boundaries for some time, testing resistance before falling.
Best Regards, R. Linda!
Talbros Automotive Components Ltd – Weekly Breakout Investment Talbros Automotive Components Ltd is showing a strong long-term bullish setup on the weekly timeframe after breaking out from a large symmetrical triangle structure.
Key Highlights:
Multi-year consolidation breakout on weekly chart
Strong breakout from symmetrical triangle pattern
Price sustaining above key moving averages
Higher low structure intact, indicating long-term strength
Momentum expansion suggests possibility of a major rally phase
Investment Perspective:
The overall structure looks suitable for a long-term investment-style opportunity with potential upside of nearly 100%, with projected targets around ₹600 over time.
Risk Management:
Stop Loss: Below the upper band of the symmetrical triangle
Important support zone near ₹280
Exit if weekly closing falls decisively below this level
Overall, the stock looks structurally strong for long-term continuation as long as it sustains above the breakout zone.
EURUSD Trading Idea: Pullback to 1.1680 Before Next MoveHello traders! Here’s my technical outlook based on the current EURUSD (1H) chart structure. EURUSD was trading inside a range after bouncing from the descending trendline. After breaking below the range support, price continued lower and confirmed a bearish shift in market structure. Currently, EURUSD is trading above the 1.1610 buyer zone, which acts as key support, while remaining below the 1.1680 seller zone that now serves as the main resistance area. As long as EURUSD remains below the 1.1680 resistance level and fails to reclaim the broken support structure, the bearish scenario remains valid. A corrective bounce could retest the 1.1680 resistance zone (TP1) before sellers potentially regain control. Please share this idea with your friends and click "Boost" 🚀