USDCAD - Breakout and consolidation above the level...FX:USDCAD breaks through consolidation resistance amid a strong dollar and is poised for an uptrend; it is important to wait for confirmation...
After a false breakout of the 100.0 psychological level, the dollar formed a minor pullback and entered a consolidation phase. Retests of resistance will indicate that the market is preparing to continue its upward movement. The session open index is strengthening, thereby providing support to the currency pair.
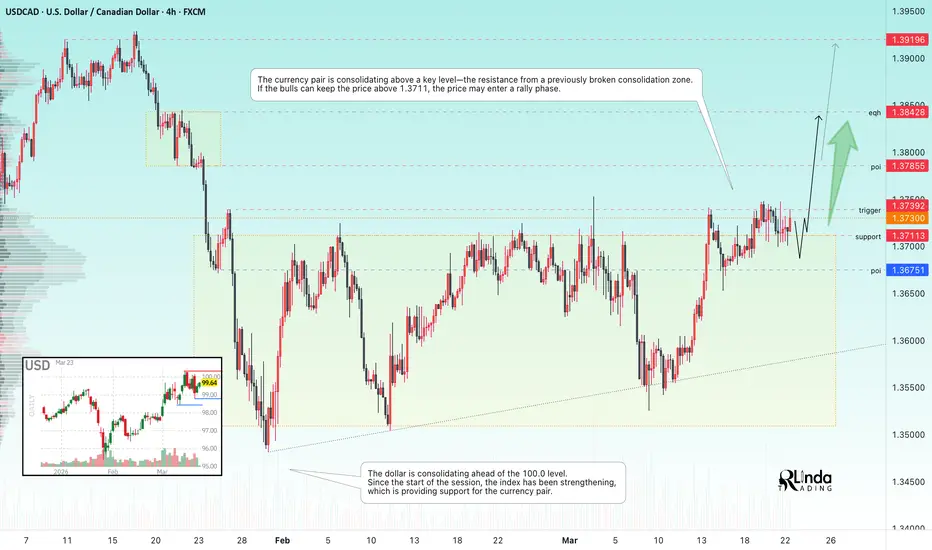
The currency pair is consolidating above a key level—the resistance of the previously broken consolidation. If the bulls hold the price above 1.3711, the price may enter a rally phase.
Resistance levels: 1.37392, 1.3785
Support levels: 1.3711, 1.3675
Consolidation above the key support level of 1.3711 would be a good signal of readiness for growth, supported by strong bulls
Best regards, R. Linda!
Triangle
Dollar Index (DXY): Accumulation Stage?!
I see a contraction in the price action on Dollar Index.
It suggests a highly probable ongoing bullish accumulation.
Our strong signal will be a breakout and a daily candle close
above a falling trend line.
It will push the index at least to the current high 100.5
❤️Please, support my work with like, thank you!❤️
I am part of Trade Nation's Influencer program and receive a monthly fee for using their TradingView charts in my analysis.
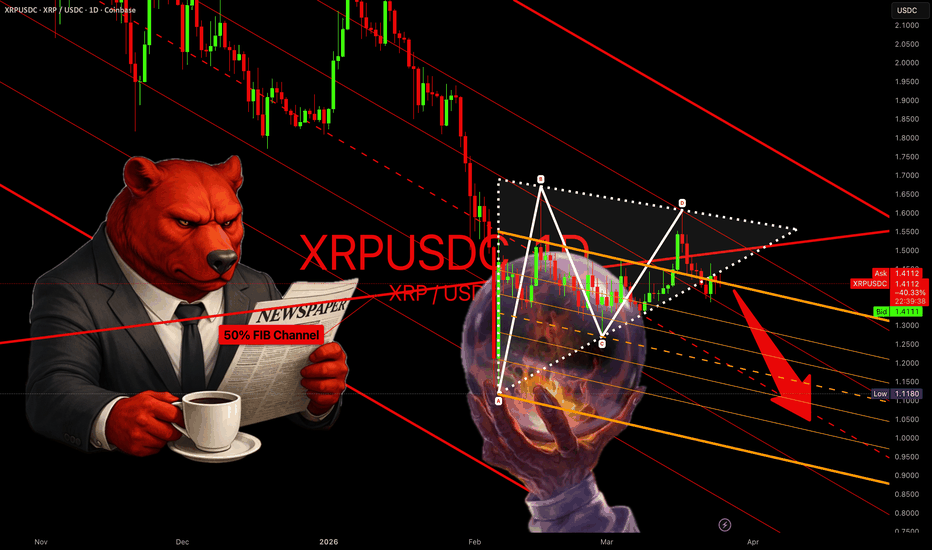
XRP - Under the glass
XRP continues to face major resistance below the 50% Fibonacci Channel level from the previous Wave 1 bullish cycle. It is currently being rejected within a triangle pattern and is once again entering the parallel channel that formed on February 6th. Ultimately, it's just a matter of time before the bulls turn bearish upon this realization.
XRP - Still no bottom found
XRP continues to face major resistance below the 50% Fibonacci Channel level from the previous Wave 1 bullish cycle. It is currently being rejected within a triangle pattern and is once again entering the parallel channel that formed on February 6th. Ultimately, it's just a matter of time before the bulls turn bearish upon this realization.
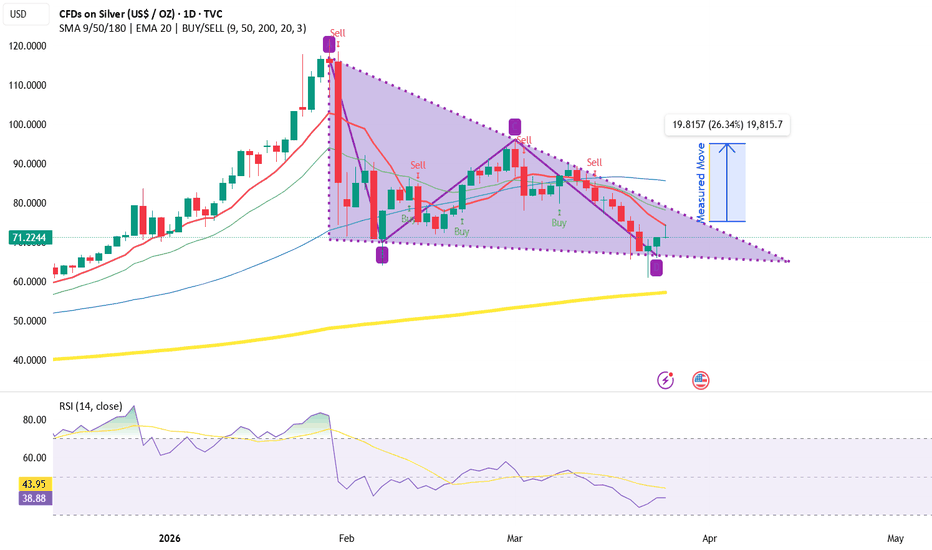
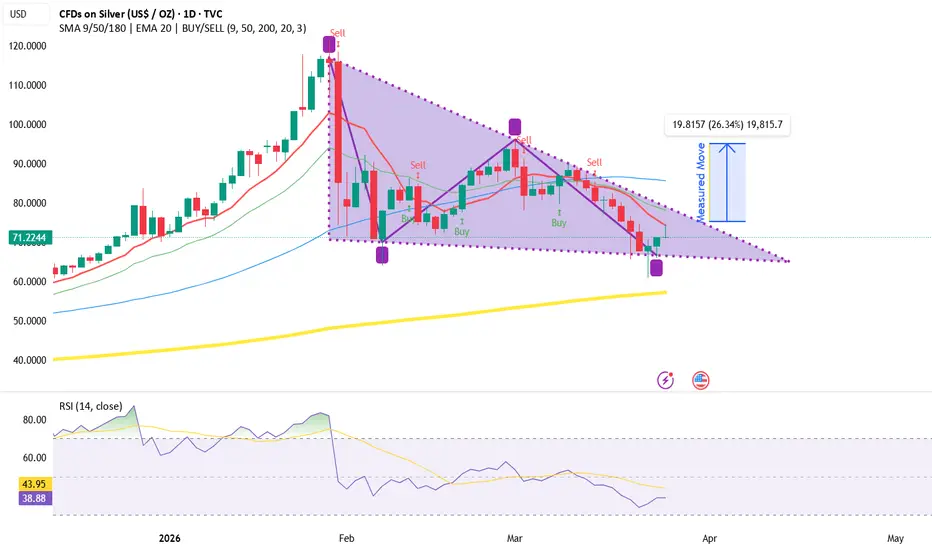
Silver Bounce UpwardsSilver has started to coil for a nice move upwards on the daily chart. Candles bounced off the 200 week moving average and forming a triangle. If the candles break to the upside of the triangle we can see about a 26% average move upwards. 1 candle close above the 9 day moving average which is represented by the red line will also confirm a bullish run.
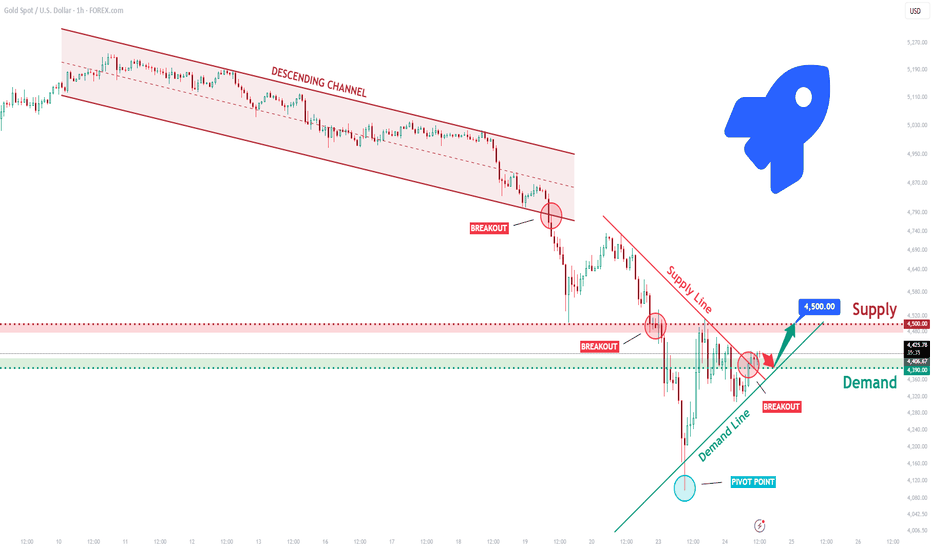
XAUUSD Long: Stabilizes Above Support, Eyes 4,500 RetestHello traders! Here’s my technical outlook based on the current XAUUSD (1H) chart structure. Gold previously traded inside a descending channel, forming consistent lower highs and lower lows, confirming sustained bearish pressure. After a breakdown below the channel support, price accelerated to the downside, signaling strong momentum from sellers.
Currently, price is trading below the 4,500 supply zone after a failed attempt to reclaim it, confirming it as a key resistance level. At the same time, gold is holding above the 4,390 demand zone, which aligns with a rising demand trend line and acts as short-term support.
As long as XAUUSD holds above the 4,390 demand zone and respects the ascending demand line, a corrective bullish move remains possible. A bounce from this area could push price back toward the 4,500 supply zone, which is the main upside target. Manage your risk!
AUDUSD - False breakdown and formation of a reversal patternFX:AUDUSD is forming an intermediate bottom and a series of support levels. The overall bullish trend and the dollar’s correction could present an opportunity for growth
The dollar is forming a correction, which offers growth opportunities for the Australian dollar, which looks relatively strong compared to other major pairs. A retest of 0.70576 would also open the door for the correction to end.
A long squeeze and confirmation of the key support level at 0.6944 are forming a reversal pattern. The global trend is bullish, the local trend is neutral. The market may push the price toward the area of interest at 0.7057.
Support levels: 0.6978, 0.6944
Resistance levels: 0.7057, 0.712
If the bulls keep the currency pair above the key support zone, we will have a chance for growth toward the intermediate zone of interest
Best regards, R. Linda!
GBPJPY: Waiting For Breakout 🇬🇧🇯🇵
I see an ongoing bullish accumulation on GBPJPY on a daily time frame.
The price formed a classic ascending triangle pattern.
A bullish breakout of its resistance and a daily candle close above 213.33
will provide a strong confirmation.
A price rise is expected to reach 214.2 level then.
❤️Please, support my work with like, thank you!❤️
I am part of Trade Nation's Influencer program and receive a monthly fee for using their TradingView charts in my analysis.
USDCAD: Confirmed Breakout & More Growth Ahead 🇺🇸🇨🇦
As I predicted earlier, USDCAD successfully violated a major
daily resistance cluster.
I expect more growth now.
Expect a test of 1.38 soon with a potential continuation higher.
❤️Please, support my work with like, thank you!❤️
I am part of Trade Nation's Influencer program and receive a monthly fee for using their TradingView charts in my analysis.
Bullish breakout risk as markets fade escalationWe can see EUR/JPY has been coiling within a compression structure for more than a month, with downtrend resistance from the January 23 highs now marginally overhead after the price moved back above the influential 50DMA earlier this week. With ATR (14) declining to the lowest level since late January as the structure narrows, it gives a sense that if and when we do see a breakout, it could be powerful.
With the price continuing to trade well above longer-term moving averages which are still sloping higher, and having entered the structure following an extended bullish trend, it feels like the more likely outcome is a bullish rather than bearish breakout, putting a potential retest of the January highs in play. Standing in the way of that outcome, swing highs of 184.80 and 186.23 sit beyond the January trendline, making them reference points of note for bulls. Should the pair take out the January high of 186.90, it would signal a resumption of the prior bullish trend.
If the price is rejected at the downtrend once again, the 50 and 100DMAs are the levels to watch before the February uptrend comes into view. A break of the latter would put 182 support and the double bottom of 181.80 in play for shorts.
The oscillators are more neutral than anything, although they marginally favour an upside bias. RSI (14) is setting higher lows and higher highs and is now back above 50, while MACD has confirmed the marginally bullish signal by staging a bullish crossover above zero.
Liquidity Grab Below Triangle Before ExpansionXAUUSD — Liquidity Grab Below Triangle Before Expansion
1. Macro Catalyst Layer
Primary driver: Corrective compression under macro pressure (firm USD + elevated real yields) → limits clean upside continuation without liquidity reset.
USD Channel: Dollar stability continues to cap gold upside; no structural weakness yet to support sustained rally.
Real Yields Channel: Elevated real yields remain a headwind; gold requires either yield compression or liquidity event to expand higher.
Risk Sentiment Channel: Geopolitical tension exists but is not translating into aggressive gold buying → weak safe-haven transmission.
Liquidity Channel: Market is compressing below supply, indicating pending liquidity event rather than immediate directional continuation.
Classification: Short-term corrective / liquidity-driven, not trend-confirmed bullish.
2. Sentiment & Cross-Asset Flow
Equities: Not in full risk-off → no aggressive defensive allocation into gold.
USD: Holding strength; move driven by rate expectations rather than panic.
Flow Type: Positioning equilibrium → likely to resolve via liquidity sweep.
Gold Behavior: Underperformance relative to geopolitical backdrop confirms lack of strong bid-side commitment.
3. Chart Structure & Liquidity Read
Structure: Triangle compression after downside impulse → classic pre-expansion environment.
Key Supply: 4425.8–4453.9 (first red zone).
Upside Targets: 4613.6 → 4726–4751.
Key Demand: 4187–4256 (major liquidity pool).
Liquidity Map:
- Equal highs inside triangle → buy-side liquidity above.
- Weak lows + compression → sell-side liquidity resting below.
Order-flow: No displacement → buildup phase; expansion expected from liquidity event.
4. Structural Bias
Intraday bias: Bearish-leaning within compression due to repeated failure at supply.
Swing bias: Corrective → still inside post-impulse repair phase.
Narrative bias: Market likely needs downside liquidity grab before sustainable upside attempt.
Structural confirmation: Lower highs intact + no acceptance above supply.
Invalidation (bearish idea): Acceptance above 4453.9.
5. Primary Scenario — Downside Liquidity Grab → Long From Demand
Trigger: Breakdown from triangle with displacement below ~4320–4300.
Confirmation:
- Strong bearish impulse (not wick-only).
- Continuation into lower liquidity without immediate reclaim.
Path:
- Sweep sell-side liquidity below triangle.
- Expand into 4187–4256 demand zone.
Execution Logic:
- Do NOT chase breakdown late.
- Wait for liquidity completion at demand.
- Look for reclaim / displacement / LTF structure shift for long entry.
Why this scenario is primary:
- Triangle compression under supply typically resolves via liquidity sweep.
- Macro environment does not support immediate clean bullish expansion.
- Downside move likely to be liquidation-driven rather than true bearish continuation.
Invalidation:
- Failure to reach demand and immediate reclaim of triangle.
- Acceptance back above 4425 without completing downside liquidity.
6. Alternative Scenario — Direct Upside Expansion
Trigger: Clean break and acceptance above 4425.8–4453.9.
Confirmation:
- Strong bullish displacement.
- Hold above supply (no rejection wicks).
Path:
- Immediate expansion toward 4613.6.
- Extension toward 4726–4751 if momentum persists.
Logic:
- Break above supply triggers short squeeze + repositioning.
Invalidation:
- Failure to hold above 4425.
- Return inside triangle → false breakout.
7. Tactical Conclusion
Primary driver: Liquidity compression under supply.
Secondary driver: Macro headwinds (USD strength + real yields).
Market regime: Liquidity buildup → expected sweep before expansion.
Tactical stance:
- Primary plan: Wait for downside sweep into 4187–4256 → then position long.
- Secondary plan: If supply breaks and holds, shift bias to upside continuation toward 4613 and higher.
Execution rule: Trade the liquidity event, not the midpoint of compression.
Note
Downside break should be treated as a liquidity event unless there is clear acceptance below demand.
Upside breakout is valid only if accompanied by acceptance, not exhaustion.
GOLD - A correction ahead of a potential declineICMARKETS:XAUUSD is correcting from yesterday’s euphoria over a possible de-escalation. But that was merely manipulation. The market may form a short squeeze before a decline
A dubious ceasefire (manipulation of the situation): Trump announced “productive talks” and a possible 5-day pause in attacks. Iran’s Foreign Ministry denied any contact with the U.S. during the war.
Gold and oil prices made sharp reversals, recouping some of their losses, but then came back under pressure.
Return to risk-off: Oil resumed its rise on expectations of “high prices for the long term.”
Fed rates: Inflation risks due to high oil prices are reviving hopes for a Fed rate hike.
Gold has entered a new reality: the escalation of the war no longer automatically pushes it higher, as markets are focusing on Fed rates rather than geopolitics per se.
Gold is under pressure from a downtrend, a strong dollar, oil, and high inflation...
Resistance levels: 4448, 4502, 4578
Support levels: 4320, 4219
The hunt for liquidity and a short squeeze could trigger a reversal and a decline within the main bearish trend.
Sincerely, R. Linda!
HYPEUSDT - Consolidation above key support$BINANCE:HYPEUSD.P has been in a bullish trend since late January, indicating the presence of interested buyers in this altcoin. As part of a correction, the price is retesting the 37.0 support level, but at the same time, it is poised for an uptrend
Bitcoin is under pressure from a downtrend but is forming a rebound from 67K, thereby supporting the altcoin market. HYPE looks strong compared to other altcoins, maintaining a local trend over the past few weeks.
HYPE is testing trend support, forming an intermediate bottom and a rebound. If the bulls keep the asset above 36.7–38.3, the price may find support for further growth toward 43.75
Resistance levels: 40.5, 43.75
Support levels: 38.35, 36.77, 35. 88
Consolidation above the key support zone will confirm the bullish market’s intentions. The medium-term outlook is favorable, and growth could be directed toward 43.75–50.0
Best regards, R. Linda!
Entero Healthcare: Triangle Breakout SetupFundamental Analysis
Entero Healthcare Solutions Ltd is a rapidly growing healthcare distribution company, operating in a highly fragmented industry where scale plays a crucial role. The company has built a technology-driven supply chain platform, enabling efficient delivery of pharmaceutical products across hospitals and pharmacies.
The business has shown strong revenue growth, crossing multi-thousand crore levels, which reflects its aggressive expansion strategy and increasing market share. This positions Entero as a key emerging player in India’s healthcare distribution ecosystem.
However, despite strong top-line growth:
Profit margins remain thin and volatile, typical of distribution-led businesses
Earnings have shown inconsistency, raising concerns on sustainability
Return ratios like ROE are moderate, indicating efficiency is still improving
Balance sheet remains healthy with low debt, supporting future scalability
👉 In essence, Entero is a high-growth, execution-driven story, where future upside depends on margin expansion and operational efficiency.
🧠 Fundamental Verdict
Strong industry tailwinds + scalable model
Growth visibility remains intact
Profitability is the only key concern
Best suited for long-term accumulation on dips
📉 Technical Analysis — Triangle Pattern Breakdown
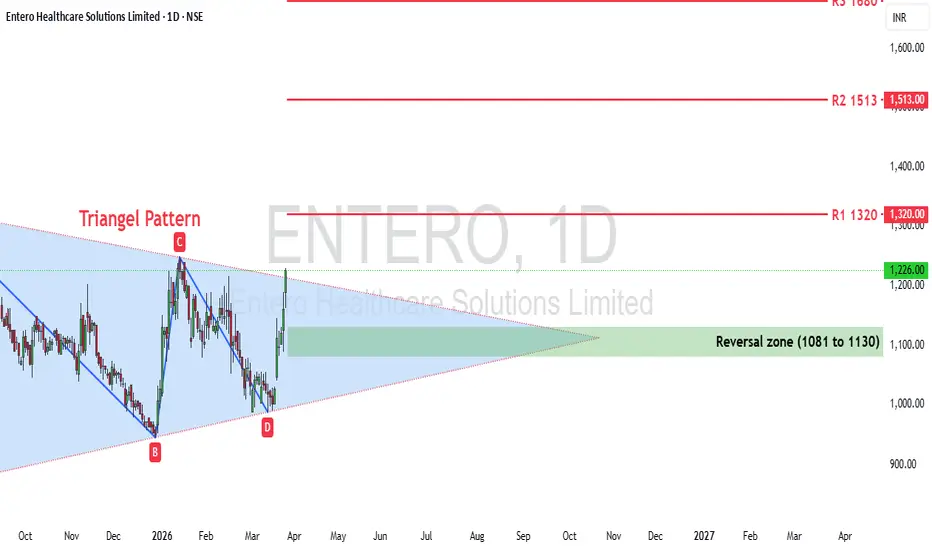
Now coming to your chart — the structure clearly reflects a Symmetrical Triangle Pattern, which is a classic volatility contraction setup before a breakout.
🔺 Pattern Structure
Lower highs forming a descending trendline (A → C)
Higher lows forming an ascending trendline (B → D)
Price is getting compressed into an apex, indicating energy build-up
👉 This confirms a triangle consolidation phase, typically followed by a sharp breakout move
📌 Key Zones from Chart
🔹 Reversal / Demand Zone: ₹1081 – ₹1130
Strong base where buyers are stepping in
Acts as support for the triangle
🔹 Current Price: ~₹1226
Trading near the upper boundary of the triangle
🚧 Resistance Levels
₹1320 (R1): Immediate breakout confirmation
₹1513 (R2): Strong supply zone
₹1683 (R3): Extended bullish target
🔥 Final Techno-Fundamental View
Entero Healthcare is currently at a perfect confluence of fundamentals and technical structure:
📈 Strong growth-driven business model
📉 Price consolidating in a symmetrical triangle
⚡ Breakout pending — volatility expansion expected soon
Disclaimer: aliceblueonline.com/legal-documentation/disclaimer/
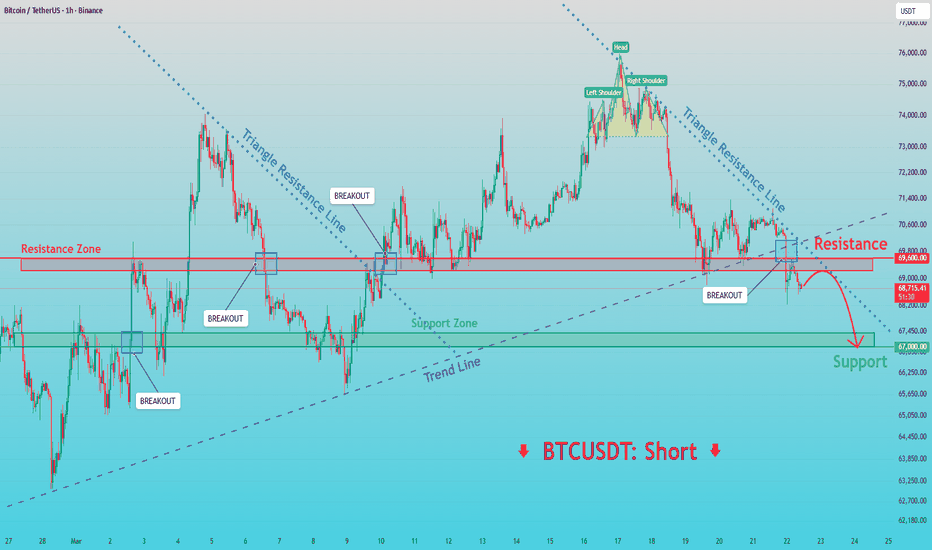
BTCUSDT: Failed Breakout and Trendline Loss Open Path to 67,000Hello everyone, here is my breakdown of the current BTCUSDT setup.
Market Analysis
BTCUSDT is trading below a key resistance zone after forming a head and shoulders pattern, which signals a potential trend reversal to the downside. Price previously respected a triangle resistance line and failed to break higher, confirming selling pressure.
Currently, after the breakdown, BTC lost the ascending trend line support and is now consolidating below the 69,600 resistance zone, showing weak bullish attempts and rejection from this level.
My Scenario & Strategy
As long as price remains below 69,600 resistance, the bearish bias remains valid. A rejection from this area could push BTCUSDT toward the 67,000 support zone, which is the main downside target.
However, if price breaks and holds above 69,600, the bearish scenario would weaken and the market could shift into consolidation.
That’s the setup I’m tracking. Thank you for your attention, and always manage your risk.
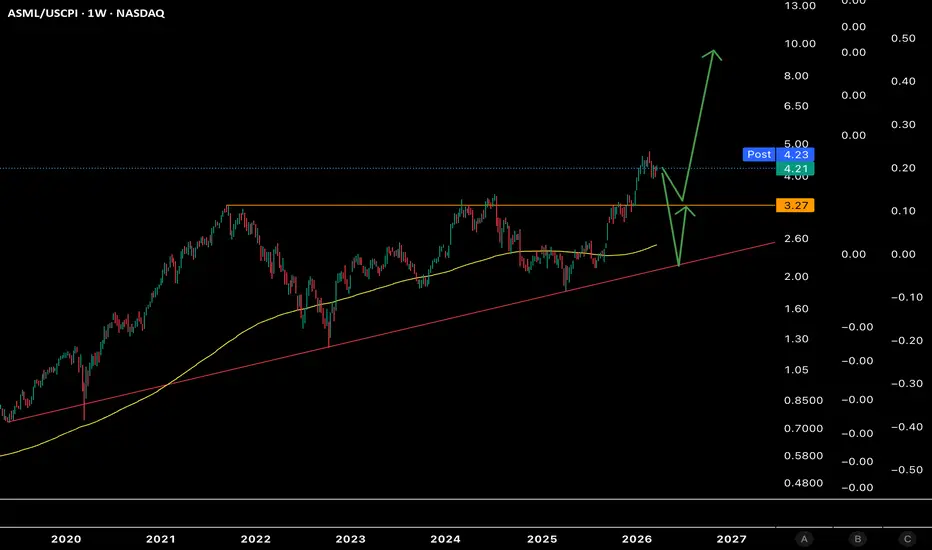
ASML - next NVDA?I have posted few gloom and doom notes on the market. I did mention that downside while deep could be quick to recover. So what's worth buying?
I am watching various stocks, but here are 3 companies at the top of that list that I like. In no particular order: ASML, GOOGL and AGX
ASML has been outperforming SPY, XLK, and SMH since April of 2025. It's essential company to chip producing process. It would be very hard if not impossible for anyone to compete considering $$ and R&D barriers to entry. Maybe long term China could develop something domestically, other than that no known competitors on the horizon.
If stock market would see significant decline, this is the stock I would be buying on discount. Of course I would watch how it performs in that decline.
From technical perspective there is a 4-5 years long triangle formation on the weekly chart (adjusted for inflation) that has been broken out to the upside and any decline from todays price level could be just a retest of that formation.
Obviously dollar cost average can be considered to build a position, but I personally will wait - hopefully this thing doesn't run away from me.
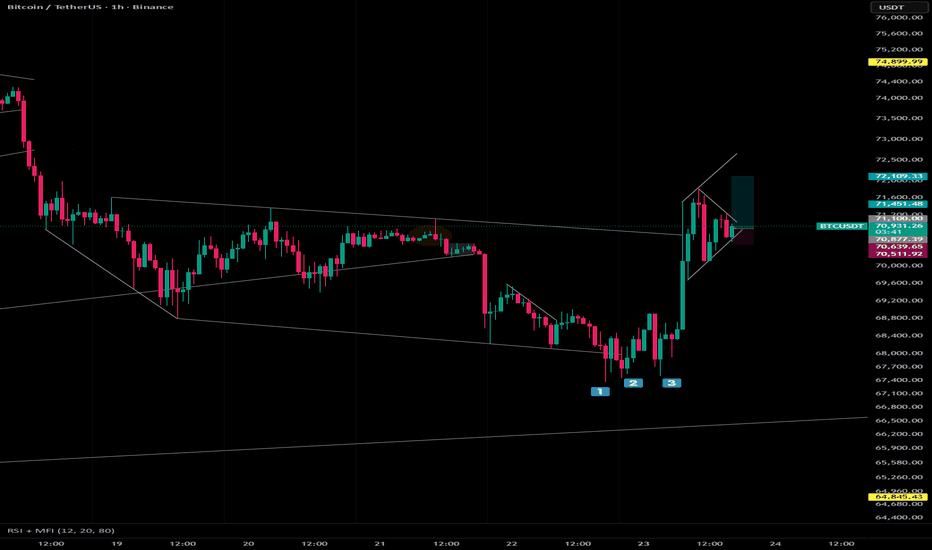
BTC UpdateWe had 3 pushes down at the bottom of the channel, then got an unexpected breakout toward the top of the channel.
The breakout was strong, but it did not get very good follow-through, so for now I do not want to treat it as a clean bull breakout yet.
On the 15m, price is now forming more of a triangle / channel cycle after the breakout. Because of that, I think the better way to frame this trade is not “buying a major breakout” and also not “shorting a failed breakout.”
The trade here is more like:
betting on a 15m channel up / second leg up after a very strong reversal from the bottom of the 1H channel.
So if I take the trade here, I am treating it as an anticipatory long, not a confirmation breakout long.
Idea:
Entry around current area
Stop below the recent 15m higher low / lower edge of the structure
First target = retest of the spike high
Second target = extension higher if bulls get a second leg
If the 15m structure breaks down cleanly, then the idea is invalid.
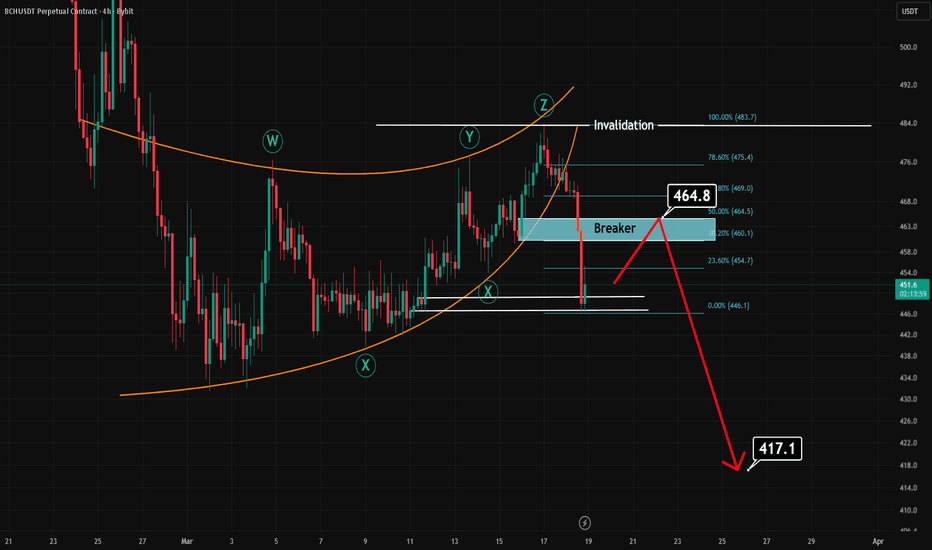
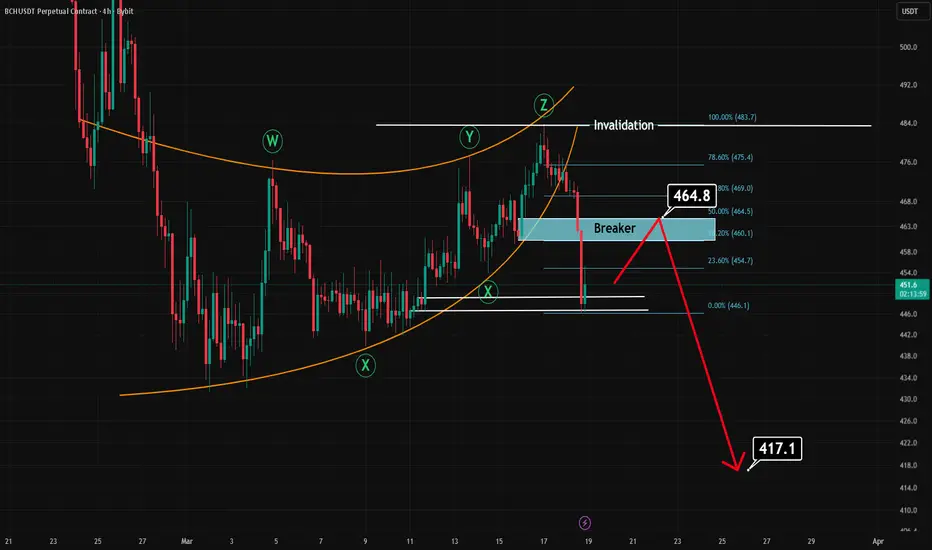
BCH UPDATE (4H)I don't want to waste your time with boring cycle analysis. Here is your short setup.
BCH has broken another triangle and is currently continuing its bearish move.
The target on the chart is the minimum level after this breakout. Invalidation is the last high. Good luck.
By the way, check the other analysis about BCH in the "related ideas" section.
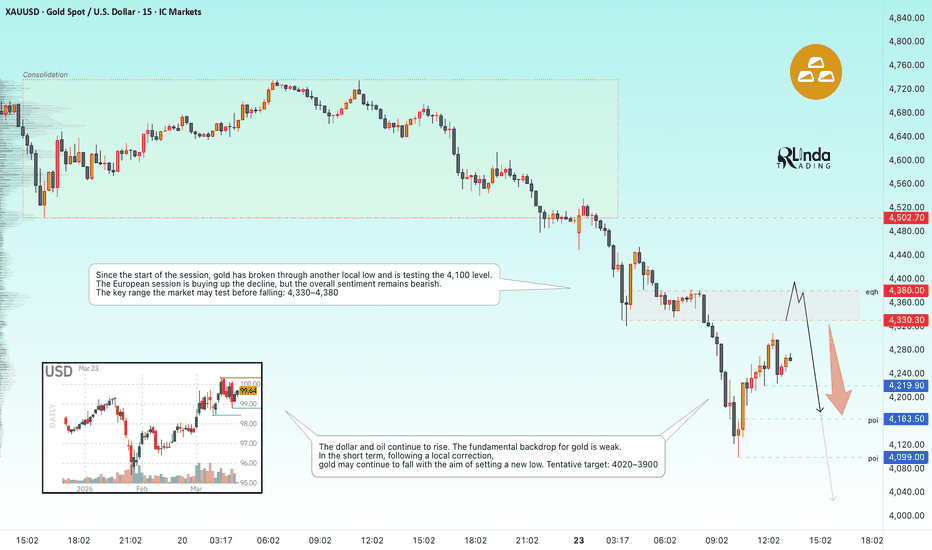
GOLD - Correction before the fallICMARKETS:XAUUSD continues its plunge: down 8% on Monday, extending its decline of more than 10% from the previous week. Sellers face little resistance as the dollar and oil strengthen amid the escalating conflict in Iran
The dollar dominates as the primary safe-haven asset. Oil continues to rise due to the escalating situation. Gold’s appeal is waning.
The escalation of the conflict heightens risks of energy disruptions and inflation → markets are pricing in rate hikes → yields are rising → gold is under pressure.
If the tit-for-tat continues, a broad market sell-off will begin, and gold will be sold to cover losses on other assets.
Gold is caught in a trap: the geopolitics that should be supporting it are now working against the asset, strengthening the dollar and expectations of rate hikes. As long as the “war for the strait” continues, the dollar and oil remain the main beneficiaries. A rebound is possible only on technical oversold conditions, but the fundamental bearish trend persists
Resistance levels: 4330, 4380
Support levels: 4220, 4163, 4100
A retest of the key zone of interest and a short squeeze could trigger a decline. Locally, gold may consolidate within the 4400–4150 range; however, the technical and fundamental backdrop is bearish, so selling should be prioritized!
Best regards, R. Linda!
USDCAD: Waiting For Breakout 🇺🇸🇨🇦
I see a massive bullish accumulation on USDCAD on a daily time frame.
Your strong signal to buy will be a breakout of its horizontal resistance
and a daily candle close above 1.3753.
A bullish continuation will be expected then.
❤️Please, support my work with like, thank you!❤️
I am part of Trade Nation's Influencer program and receive a monthly fee for using their TradingView charts in my analysis.
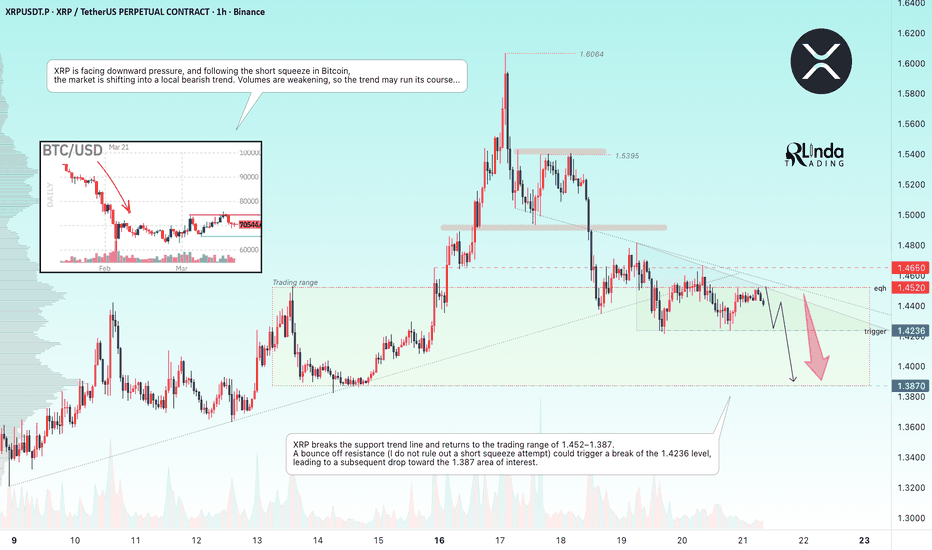
XRPUSDT - A break in the uptrend. Are we heading toward 1.380?BINANCE:XRPUSDT has broken through the uptrend support and is consolidating below 1.450, indicating that the market is poised to head toward support. Crypto winter continues...
XRP is facing downward pressure, and following a short squeeze in Bitcoin, the market is shifting into a local bearish trend.
Volumes are weakening, so the trend may run its course...
XRP breaks the support trend line and returns to the trading range of 1.452–1.387. A bounce off resistance (I do not rule out a short squeeze attempt) could trigger a break of the 1.4236 level, leading to a subsequent drop toward the 1.387 zone of interest
Resistance levels: 1.452, 1.465
Support levels: 1.4236, 1.387
A bounce off the 1.452 resistance zone confirms a trend break and relatively bearish sentiment. The price may test 1.4236 before breaking through and falling further to the 1.387 area of interest.
Best regards, R. Linda!
AUD/USD: Downside opens as triangle support failsAUD/USD has broken out of the symmetrical triangle it had been coiling in over the past two weeks on the H4 timeframe, slicing through uptrend support earlier Monday before retesting and failing at the level again as losses mounted across major Asian equity markets. That saw price break beneath the March 14 swing low of .6980 before extending lower.
.6957 is the next downside level to watch, marking the start of the triangle structure along with the double bottom seen on March 9. Having already moved well away from .6980, I’m not inclined to chase the move at these levels. However, if we were to see a retracement and rejection at .6980, it would provide a decent entry for shorts, allowing for a stop to be placed above for protection, targeting .6957.
The message from the oscillators is consistent with playing the pair from the short side for now. RSI (14) is trending lower but is not yet oversold, while MACD has staged a bearish crossover, confirming downside pressure is building and favouring shorts over longs.
Should .6957 be reached, traders could assess whether to square, flip or hold, looking for a retest of the .6945 low set when the Iran conflict first escalated.
If price were to reverse back above former triangle support and hold there, the bearish bias would be invalidated.
Good luck!
DS
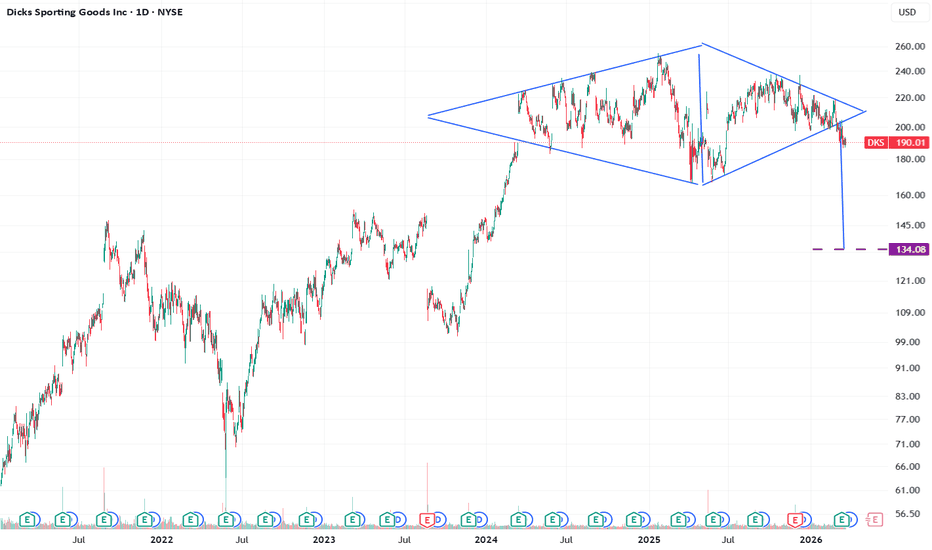
DKS Diamond top formed Bearish chart set up
📉 Reasons DKS could reduce in price (ranked)
1. 📊 Consumer spending slowdown (MOST IMPORTANT)
DKS is highly dependent on discretionary spending
If the US economy weakens:
Fewer people buy sports gear, apparel, equipment
This directly hits revenue and margins
2. 🧾 Margin compression (shrinkage, discounts, costs)
Retail margins are sensitive to:
Theft (“shrink” — a known issue in US retail)
Heavy discounting to clear stock
Rising wage and operating costs
Even small margin drops can significantly impact profit → stock falls
3. 📦 Inventory mismanagement
Too much stock → forced discounting
Too little → missed sales
DKS has historically been impacted by inventory swings
4. 🏪 Weak store performance / footfall decline
Declining physical store traffic
Shift to online competitors
Underperformance of new store formats
5. 🛍️ Competition pressure
From:
Amazon
Nike direct-to-consumer
Walmart / Target
Brands selling direct reduces DKS’s pricing power
6. 📉 Earnings miss / guidance cuts
If DKS reports:
Lower-than-expected earnings
Weak forward guidance
Market reaction is often immediate and sharp
7. 📦 Brand partner risks
Heavy reliance on big brands (Nike, Adidas, etc.)
If those brands:
Change distribution strategy
Limit wholesale supply
→ DKS loses key revenue streams
8. 💵 Overvaluation / multiple compression
If stock is priced high relative to earnings:
Even good results may not sustain valuation
Rising interest rates often compress retail valuations
9. 📉 Macro factors (rates, inflation)
Higher interest rates:
Reduce consumer spending
Lower equity valuations
Inflation squeezes both:
Customers
Company costs
10. 🔄 Shift in consumer trends
Changes in:
Sports participation
Fitness trends
Apparel preferences
Can leave DKS with outdated inventory
11. ⚠️ Execution risk (strategy missteps)
Poor rollout of new concepts (e.g. experiential stores)
Supply chain issues
Pricing strategy mistakes
12. 📰 Market sentiment / sector rotation
Retail sector going out of favour
Investors moving to:
Tech
AI
Defensive stocks
🧠 Bottom line
The big driver is consumer health + margins.
Everything else (inventory, competition, valuation) feeds into those two.