Wolfe Wave - NIFTY – Wave 5 Completion and Downside ProjectionNIFTY is currently completing the marked Wolfe Wave structure, with Wave (5) approaching the upper resistance/trendline zone.
The current setup suggests a final corrective/retracement move followed by an impulsive downside leg. The projected path indicates an initial move lower toward 22,440–22,450, followed by a brief retracement, and then another downside move toward 22,390–22,400.
The Wolfe Wave line and the broader descending structure project the downside target.
Key levels:
• Current re
Wolfe Wave
Gold – Wave 5 at Resistance | Downside ProjectionGold is approaching the completion of the marked Wave (5) near the 4,200–4,205 resistance zone.
The current structure shows a clear 1–2–3–4–5 progression, with Wave (5) now reaching the upper trendline and horizontal resistance. The Wolfe Wave line and equilibrium line also provide confluence around the projected reversal area.
If price gets rejected from the current resistance zone, the expected move is an impulsive decline toward the 4,120 area, as marked on the chart.
Key levels:
• Wave (5
GOLD (XAUUSD) Bearish Re Distribution Setup 📊 TECHNICAL ANALYSIS: Re-Distribution Continuation Setup on Gold (XAUUSD)
Market has paused its downward movement to form a clear Re-Distribution phase. Volume Spread Analysis (VSA) indicates that smart money is building fresh sell positions during consolidation to continue the dominant bearish trend.
🔑 VSA & TECHNICAL INDICATORS:
Re-Distribution Phase: Weak bounce attempts on low volume confirming a complete lack of buying demand.
Volume Spread Analysis: High-volume rejection at lower highs
USDT dominance may be approaching a turning pointUSDT Dominance (USDT.D) is widely used to gauge the direction of the broader crypto market. Most traders analyze it through technical patterns, support/resistance, trendlines, and other forms of classic TA.
Sometimes they work. Sometimes they don’t.
So I decided to run USDT.D through my VDS (Volume Divergence Scanner) with a configuration specifically adapted to this asset.
And the result is pretty damn interesting.
Yes, there is some noise on the 6H timeframe. But most of the signals app
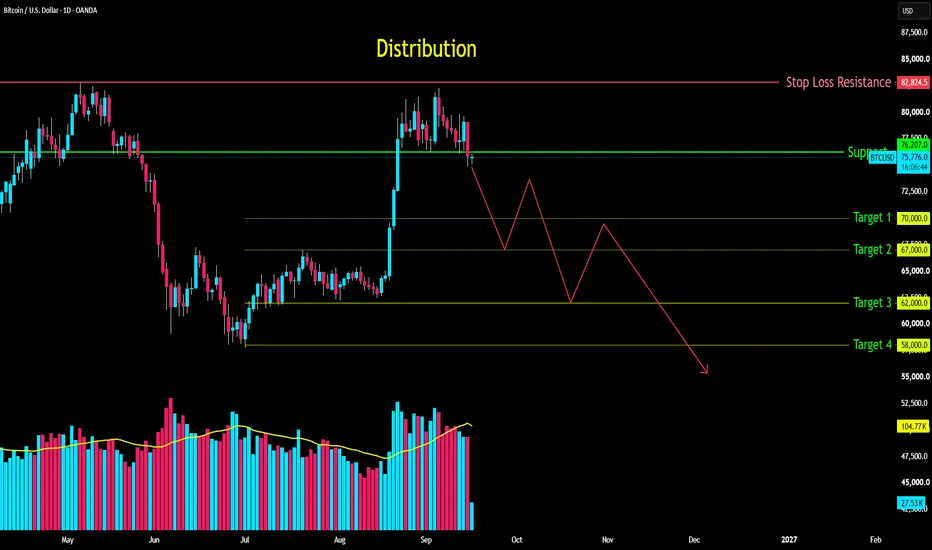
BTC: Wyckoff Distribution Setup Markdown Expected📊 TECHNICAL ANALYSIS: Institutional Distribution Setup On (BTC)
Bitcoin (BTC) is forming a classic Wyckoff Distribution range following an extended markup smart money is actively shifting supply to retail buyers near the range highs signaling an upcoming markdown.
🔑 VSA & TECHNICAL KEY LOGIC:
Structure Distribution Top / UTAD confirmed
Volume Decreasing buying volume on highs with rising volume on bearish candles indicating institutional selling pressure.
🎯 TRADE SETUP & Execution Plan:
QQQ Technical Outlook: Critical Price Levels, Support Resistance📊 QQQ TECHNICAL OUTLOOK
Critical Price Levels • Support • Resistance • Price Structure
⚡ KEY LEVELS AT A GLANCE
🔴 721.86–724.13 MAJOR RESISTANCE | 🔴 718.00–720.00 RESISTANCE | 🟢 713.00–715.00 SUPPORT | 🟢 709.00–712.00 SUPPORT | 🟣 700.00–705.00 MAJOR SUPPORT
QQQ is trading at an important technical junction following Thursday's strong rebound. The immediate question is no longer simply whether momentum is bullish or bearish.
The key is how price reacts at these clearly defined levels.
🔴 718.00–
WTI Crude Oil – Bullish Wolfe Wave Reversal SetupThe chart shows a potential bullish Wolfe Wave formation, with point (5) developing near the 100.5–101.0 support zone. A sustained hold around this area could trigger a reversal, with the first important confirmation coming from a break above the descending Wolfe Wave resistance line. The marked level around 101.94 is an important short-term trend-reversal zone; trading above this level could strengthen the bullish scenario toward 104–106. The setup remains invalid if price breaks decisively bel
ZEC VDS LONG SetupI’ve been asked a few times to take a look at ZEC and tune VDS for it, so I finally did.
I configured VDS specifically for LONG (BUY) setups on the 4H timeframe.
ZEC is currently in an uptrend, and the SELL signals are still too noisy to be useful. So for now, I’m intentionally focusing only on BUY setups.
On higher timeframes, there simply isn’t enough history yet to build a setup I’d consider reliable.
One thing I find interesting is that the signals become noticeably cleaner as more his
WTI Crude Oil – Triple Top / Bearish Wolfe Wave Setup - Updated.
The updated chart shows a potential triple-top formation near the 105.0–105.5 zone, with price testing the same resistance area for the third time.
The setup is valid only while price remains around the current resistance levels; a decisive move to a new higher high would invalidate the triple-top structure and the bearish Wolfe Wave scenario. If price gets rejected from this zone, the immediate focus would be on the rising support line around 101–102, followed by the Wolfe Wave projected t
WOLF | The time to go long has come- Timeframe: Weekly
- Trade type: Buy stop order
- Price: 27.65
- Take Profit: Open
- Stop Loss: 23.37 (-15.50 %)
Idea: Long on a breakout above last week's high - bullish momentum continuation.
Entry: Buy stop above last week’s high.
Stop-loss: Below the low of the same candle.
If the weekly candle closes below this level, the trade is invalidated.
Take Profit: Trailing stop following the lows of new weekly candles.
WTI Crude Oil – 30-Minute Wolfe Wave SetupThe chart shows a developing bearish Wolfe Wave, with price approaching point (5) around the 103.5–104.0 zone. If point (5) holds as a rejection area, the pattern suggests a potential decline toward the projected Wolfe Wave target around 98.0–98.5. The setup would gain strength if price breaks below the immediate 101.0 support with follow-through, confirming bearish momentum. A sustained move above point (5) would weaken the pattern and could invalidate the projected downside move. Overall, the
Gold cools off after sharp intraday push higherPrice
Gold is trading near 4,370, up about 1.2% on the day after touching highs near 4,402 earlier in the session, though price has pulled back roughly 0.7% from that intraday high.
Volume Sentiment
On the 1H chart, the Heikin-Ashi layer sits in FOMO territory and continues to push higher, while the raw layer remains below the FOMO threshold and has not yet confirmed the move. On the daily chart, the Heikin-Ashi layer has crossed into FUD territory, while the raw layer sits close to the zero li
TIA is showing a strong confluence of signals on the 4H timeframVDS → SELL
Price is pushing into the upper liquidity zone while RSI is heavily overheated. At the same time, we can see a clear bearish divergence between price and RSI.
OI spike
Open Interest has sharply increased during the latest move higher, suggesting a significant buildup of positions near the highs.
Liquidity sweep
Price has already swept the liquidity above the previous local highs and entered the marked upper liquidity zone.
Liquidity below
There is a well-defined liquidity ar
My view on Intel Stock: Going against the crowd (#INTC)NASDAQ:INTC
While most market participants react blindly to the initial impulse, believing in an immediate and sharp reversal to the upside, I prefer to look deeper into market mechanics. My view contrasts sharply with the crowd: I believe it is way too early to celebrate this local bounce in Intel shares, and the technical structure clearly points to another wave of downside.
On the daily timeframe, a well-defined descending channel is unfolding. From above, price is facing heavy pressure f
TradingView Idea – WTI Crude Oil - 1 hourWTI appears to have completed a **5-wave impulsive advance**, with Wave (5) topping near **$95.5**, followed by a rejection. The current decline from Wave (5) suggests that a corrective phase may now be developing, with the rising lower trendline around **$92–92.5** acting as the first important support. A decisive break below this trendline would strengthen the bearish setup and could open the way toward **$90**, followed by the **$87–86** zone near the projected Wolfe Wave line. The structure
15 mins Crude Oil – Bearish Wolfe Wave SetupThe chart shows a potential **bearish Wolfe Wave**, with **Point 5 forming around $93.2–$93.5**, close to the upper Wolfe Wave boundary. The price action at Point 5 suggests a possible exhaustion/rejection zone after the preceding upward move. If the reversal confirms, the projected path indicates a decline toward the **$86.5–$87.0 area**, where the extended Wolfe Wave line provides a potential target zone. The rising lower trendline around **$91–$92** is an important intermediate support; a dec
15 mins. Gold – Bullish Wolfe Wave SetupGold appears to be developing a bullish Wolfe Wave, with Point 5 forming around 4,380–4,400** near the lower Wolfe Wave support line. The current structure suggests a potential reversal from this Point-5 area, with the projected path targeting the 4,520–4,550 zone, where multiple trendlines provide confluence. The key confirmation would be a sustained move above the nearby 4,420–4,440 resistance area, which would strengthen the bullish reversal scenario. A decisive break below the Point-5/suppor
Crude Oil – Bearish Wolfe Wave Setup - 2 hour timeThe chart shows a developing **bearish Wolfe Wave**, with price appearing to complete **Point 5 around $94–95**, near the upper Wolfe structure resistance. From this area, the projected path indicates a potential reversal toward the **Wolfe Wave target near $79–80**, which also aligns with the broader descending reference line. The recent rejection from Point 5 and the move back toward the rising lower trendline are important signals; a decisive break of this support could accelerate the downsid
Crude Oil – Bearish Wolfe Wave Setup - 2 hours time frameThe chart appears to be forming a **bearish Wolfe Wave**, with price completing/approaching **Point 5 near the 8,700–8,900 zone**, which is also close to the upper trendline resistance. The marked **false breakout** above the upper structure adds confluence to the bearish reversal thesis if price fails to sustain above this area. From Point 5, the projected path suggests a corrective decline through **Points 1–4**, followed by a potential **Point 5 / Wolfe Wave target around 6,800–7,000**. The d
ETH/USDT — 1D: another sell signal at $2,500The VDS signals have historically captured the major reversal points on ETH since 2022.
A new SELL signal has just appeared around $2,500, following a strong move higher from the previous BUY signal near $1,600 .
The timing is interesting. When the market turns extremely bullish and social media is filled with expectations of a new bull market, it may be worth looking at the chart from a purely technical perspective rather than following the crowd.
That said, this is a daily timeframe, so th
Currenlty only IDEA is short in CHZUSDTWe are currently seeing that in pair has been declining the higher prices consolodation zone . probability it breaks down POC and go to lower is high due to seller were increasing momentum in previous impulses . only at the bottom we get absorption of sellers we look for longs . if they build liquidity at the end of the consolodation range the price collapse again
REMEMBER ONLY REACT TO MARKET , NEVER PREDICT IT
Not a financial advice