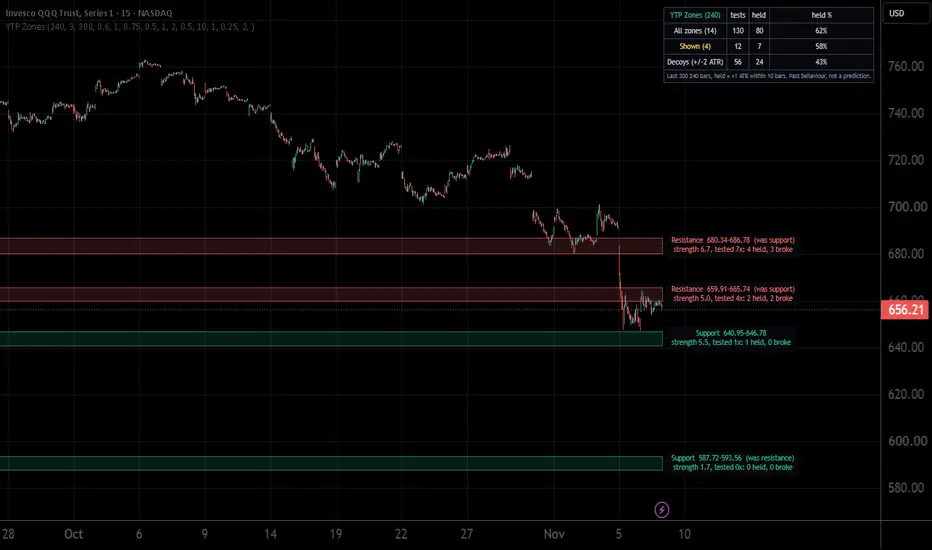
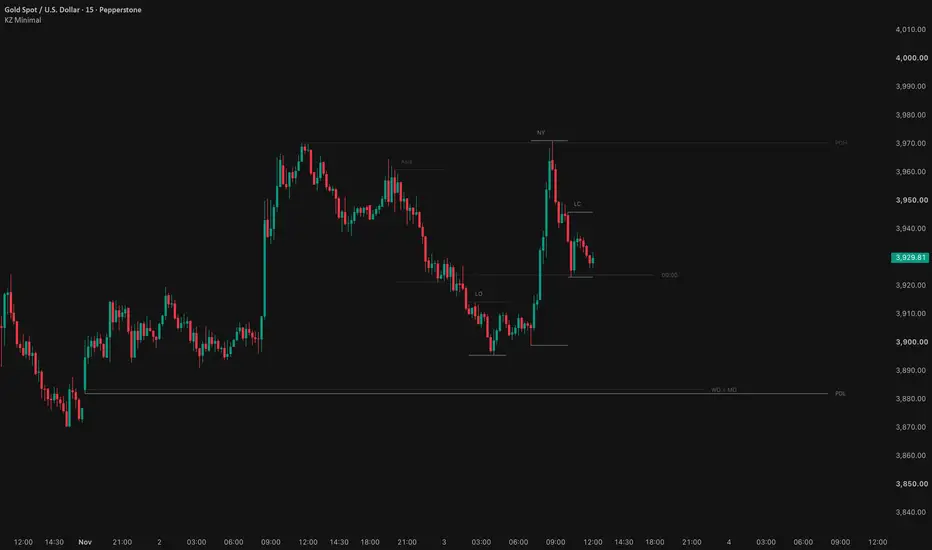
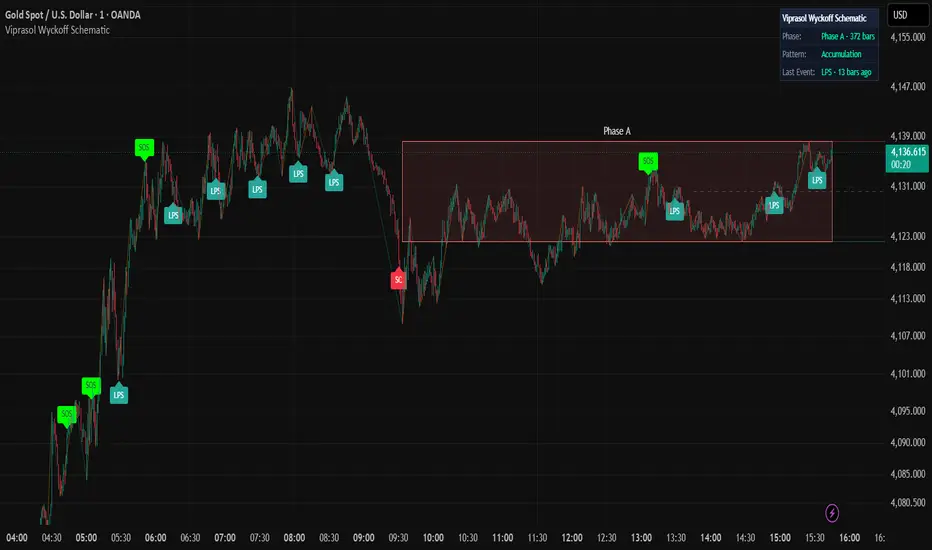
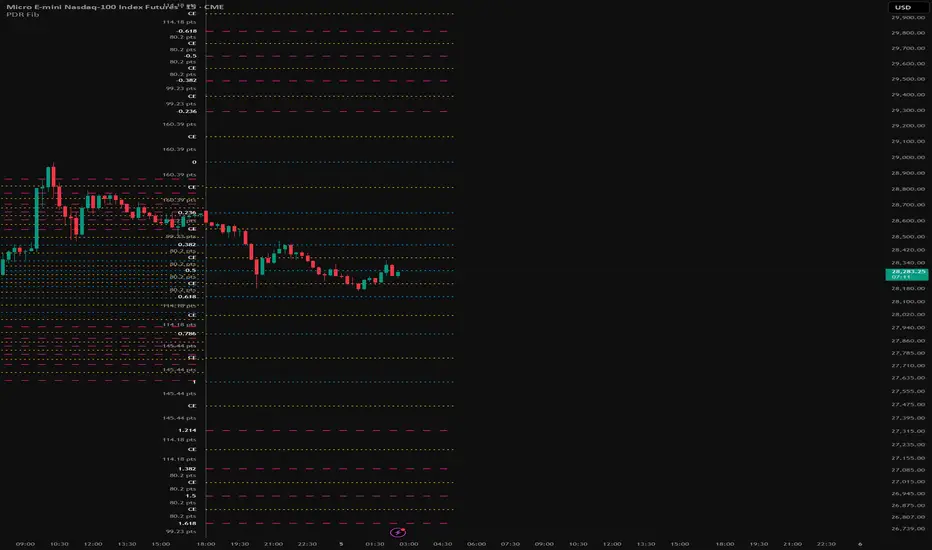
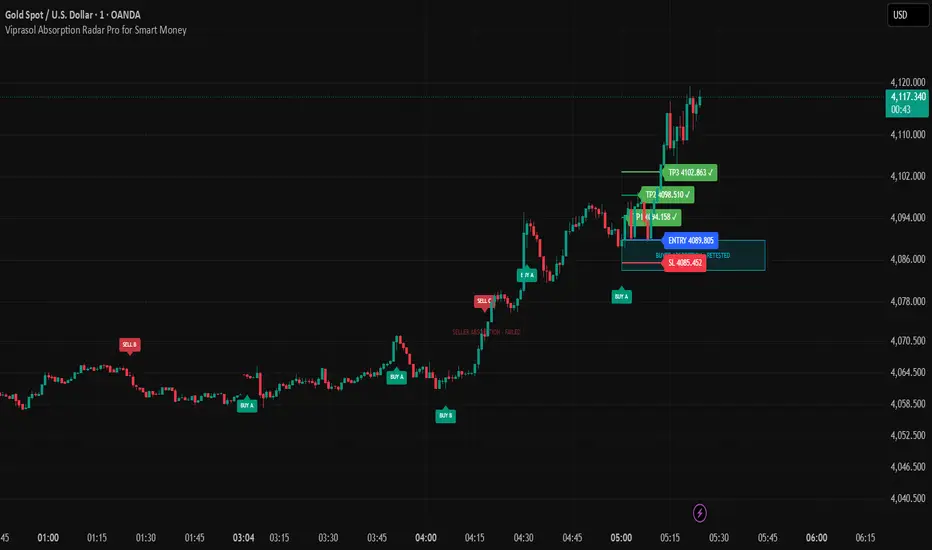
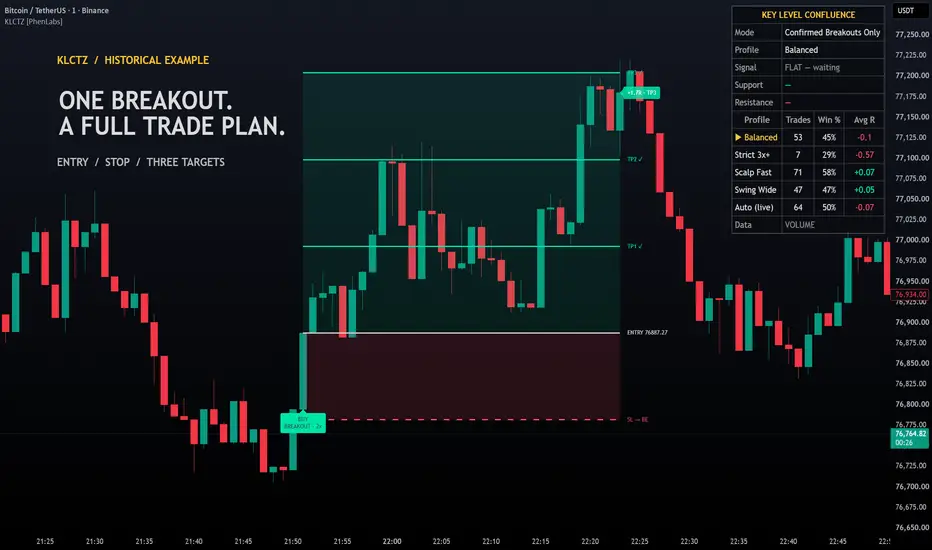
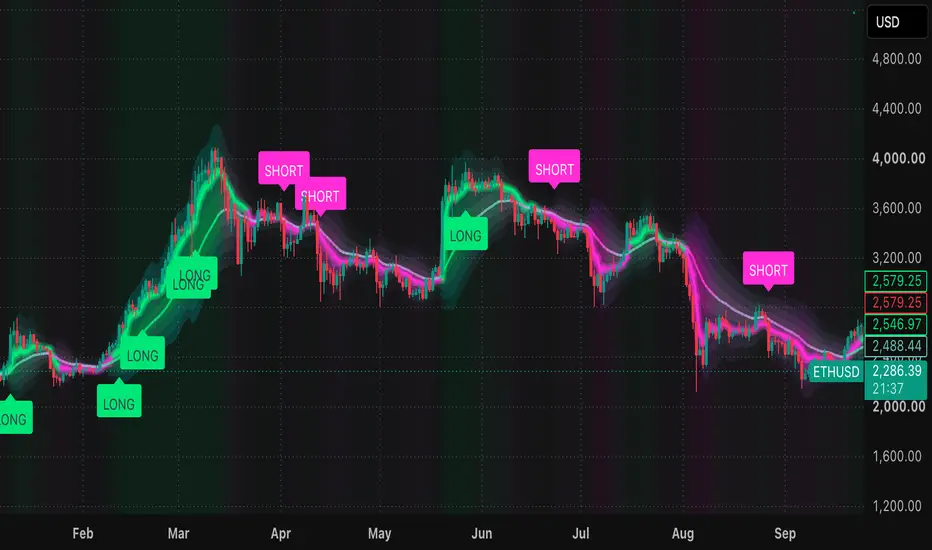
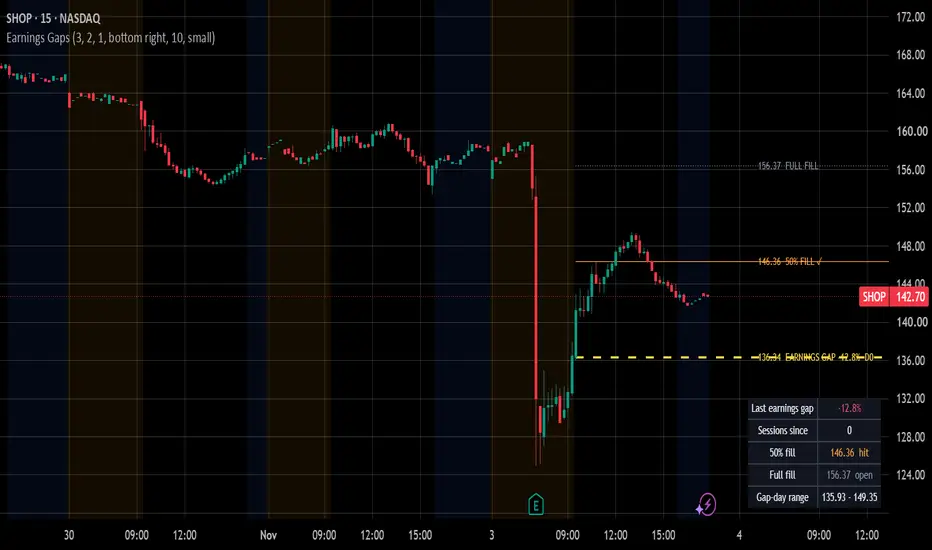
YTP Zones - Higher-Timeframe S/R Zones with a Decoy TestYTP Zones draws a few higher-timeframe support and resistance zones on any chart and shows how price has behaved at each one, next to a decoy baseline, so you can judge whether the zones mean anything on that symbol before you rely on them.
WHAT IT DOES
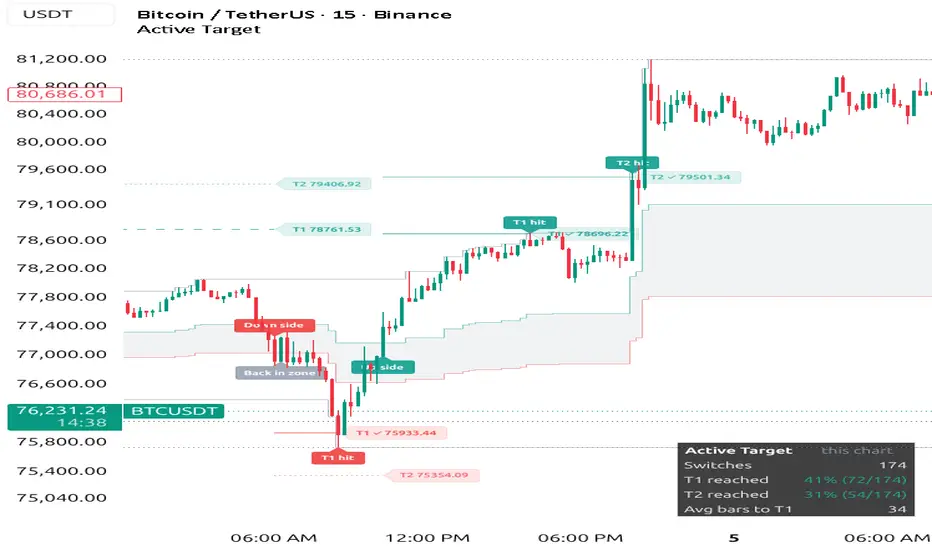
- Builds zones from confirmed swing highs and lows on a zone timeframe (default 4 hours) and draws them on the chart you are viewing. A 15-minute chart shows a handful of 4h zones instead of many thin intraday slices.
- Shows up to two zones abo
Indicador