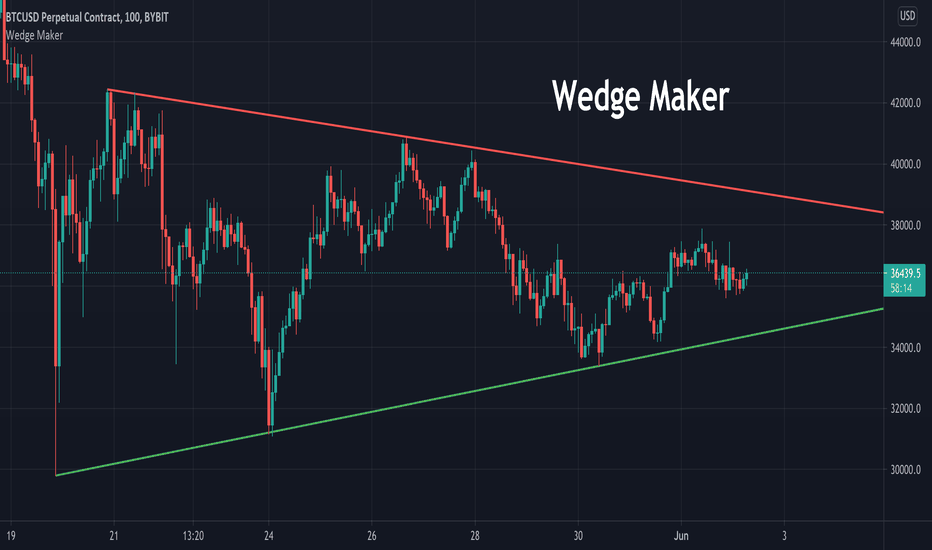
Rising & Falling Wedge Detector [HexaTrades]Overview
Wedge Detector automatically identifies and draws the two most actionable wedge patterns: the Rising Wedge (bearish) and the Falling Wedge (bullish). It marks each as a converging cone, validates the geometry, waits for a bar-close breakout, then plots a measured-move target and a structure-based stop without repainting the pattern structure.
It is built around quality over quantity: a strict, perfect-shape gate ensures only genuinely converging, textbook wedges appear. Every part of the logic is transparent and tunable. Ideal for swing and intraday traders who trade chart patterns and want an objective, rules-based way to spot wedges and define risk.
What it detects
Rising Wedge( bearish)
Higher highs and higher lows, but the lows rise faster than the highs (the lines converge upward). Signals a likely breakdown confirmed on a close below the lower trendline.
Falling Wedge ( bullish)
Lower highs and lower lows, but the highs fall faster than the lows (the lines converge downward). Signals a likely breakout confirmed on a close above the upper trendline.
How the Indicator Works
- Pivots: confirmed swing highs/lows (locked pivotLen bars after they occur).
- Boundaries: upper line from the two most recent swing highs; lower line from the two most recent swing lows, projected as straight lines.
- Slope & convergence: rising = both up, lows rising faster; falling = both down, highs falling faster (set by Convergence strictness).
- Perfect-shape gate: no crossing inside, real narrowing, minimum contraction, apex ahead, sensible duration, minimum ATR height.
- Forming preview: dashed shaded cone while developing.
- Breakout: bar-close below lower line (rising → bearish) / above upper line (falling → bullish).
- Filters: optional EMA trend, volume, breakout-candle ATR size.
- Targets/stops: measured-move target + opposite-boundary stop, drawn as persistent right-extending lines.
Features
- Automatic detection of rising & falling wedges from confirmed pivots.
- Perfect-shape validation rejects crossing, barely-narrowing, diverging, past-apex, too-small or too-long shapes.
- Forming preview dashed shaded cone before breakout.
- Bar-close breakout confirmation, no intrabar fakes.
- Measured-move target + structure stop (opposite boundary).
- EMA trend filter, volume filter, breakout-candle ATR filter (all optional).
- Theme-aware dashboard + shaded wedge zone + 3 alerts.
Dashboard
Status: Forming while developing → Confirmed on breakout
Last wedge: Rising Wedge / Falling Wedge
Bias: Bearish / Bullish
Target: Projected take-profit level
Stop: Structure-based invalidation level
Filters: EMA / Volume / ATR shown as On / Off
Settings
Detection:
Pivot length: swing sensitivity. Lower = more (and smaller) wedges.
Min wedge height (ATR): rejects wedges smaller than this many ATR.
Convergence strictness: how strongly the lines must converge (higher = stricter).
Min width contraction: minimum narrowing from start to breakout.
Max wedge duration: rejects over-stretched patterns.
Show forming wedge: preview wedges before breakout.
Filters:
EMA trend filter: only confirm breakouts aligned with the EMA (falling wedge above EMA, rising wedge below).
Volume confirmation: requires above-average volume on the breakout candle.
Min breakout candle size: require a breakout candle of at least N×ATR.
Visuals
Toggle target/stop lines, colors for bullish/bearish / forming, and the dashboard.
Alerts:
Rising Wedge breakdown:bearish confirmation.
Falling Wedge breakout: bullish confirmation.
Any wedge confirmed - either of the above.
Create alerts with “Once per bar close” for non-repainting behaviour.
Trading Guide
- Identify: dashboard Status = Forming + clean dashed cone.
- Enter: on the bar-close breakout (▲/▼) in the wedge's direction.
- Avoid: when filters reject the breakout, or in choppy ranges.
- Stop: the drawn SL (opposite boundary). Target: the drawn TP (measured move).
- Risk: size so breakout→stop is an acceptable risk; R:R = (TP−entry) ÷ (entry−SL).
Bullish Example (Falling Wedge)
Down-trend forms a dashed falling cone → a candle closes above the upper line → ▲ prints, wedge turns solid green, Status = Confirmed → enter, SL = lower line, TP = breakout + wedge height.
Bearish Example (Rising Wedge)
Up-grind forms a dashed rising cone → a candle closes below the lower line → ▼ prints, wedge turns solid red → enter short, SL = upper line, TP = breakout − wedge height.
Best Markets & Timeframes
Markets: works on crypto, forex, stocks, indices, futures, commodities. Best on liquid instruments with clean swings (the volume filter is most meaningful on stocks/indices).
Timeframes: 5m/15m = more signals, more noise (use stricter filters); 1H/4H = the sweet spot; Daily/Weekly = highest quality, fewer & slower.
We would love to hear your suggestions. If you have ideas for new features, indicators, analytics, or improvements, please share your feedback. Your input helps guide future updates and improve the indicator for all traders.
Wedge pattern detector indicator is for educational and analytical purposes only. It is not financial advice. Trading involves risk. Always use proper risk management and combine this indicator with your own analysis before taking any trade.
Indicador

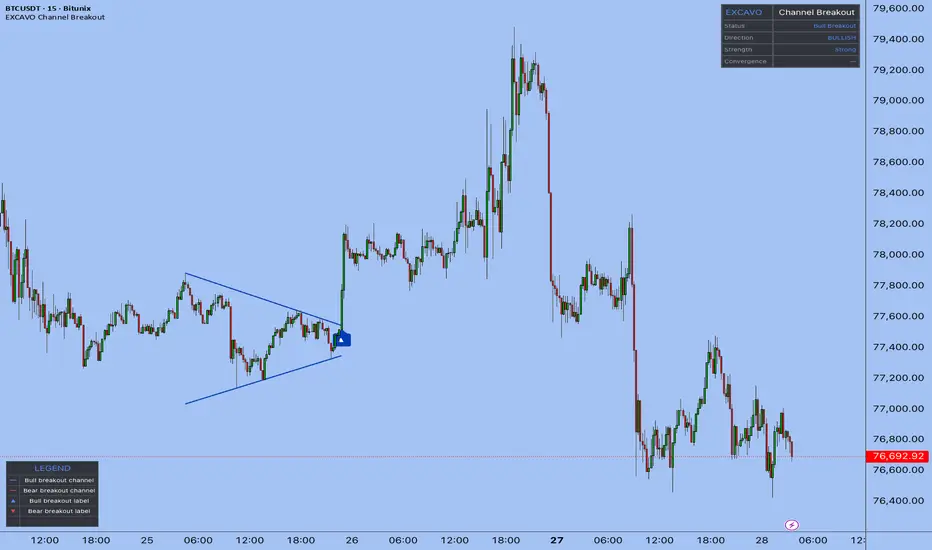
Channel Breakout [EXCAVO]Automatic Convergent Channel Detection with Multi-Filter Breakout Confirmation
The Channel Breakout automatically detects convergent channel patterns — wedges, flags, and triangles — by fitting trendlines through confirmed swing pivots on both boundaries simultaneously. When price breaks out with volume and momentum confirmation, the indicator signals the direction with colored channel lines and an entry label on the breakout candle.
This is not a basic highest/lowest channel. The boundaries are built from verified pivot points, and a convergence filter ensures only genuinely contracting channels qualify — expanding ranges and sideways boxes are excluded.
━━━━━━━━━━━━━━━━━━━━━━━━━━━━━━━━━━━━━━━
▸ HOW TO USE
Step 1 → Add the indicator. It begins scanning for convergent channel
patterns using swing pivots on the current timeframe.
Step 2 → Wait for a channel to form. The indicator draws the upper and
lower boundary lines in blue while price remains inside.
Step 3 → Watch for the breakout signal. When price closes beyond either
boundary with confirmation, channel lines turn blue (bull) or
red (bear), and an arrow label appears on the breakout candle.
Step 4 → Check the dashboard. It shows the current pattern state,
breakout strength (Strong / Medium / Weak), and the directional
bias score that built up while price was inside the channel.
Step 5 → Read the strength rating. Strong breakouts combine high volume,
deep body penetration, and RSI alignment. Weak breakouts show
fewer confirming factors and may warrant additional analysis.
━━━━━━━━━━━━━━━━━━━━━━━━━━━━━━━━━━━━━━━
▸ HOW IT CALCULATES
◆ Pivot Detection
Swing highs and lows are identified with ta.pivothigh / ta.pivotlow using a
configurable lookback (Pivot Detection Length, default 5 bars each side). Only
confirmed, closed pivots are used — no repainting. All recent pivots within the
Max Channel Width lookback are stored and passed to the trendline fitting engine.
◆ Best-Fit Trendline Algorithm
For the upper boundary, the engine tests every pair of stored pivot highs (a, b).
For each candidate line through (a, b), it counts how many other pivot highs lie
within ATR × Touch Tolerance of the line while no pivot exceeds it by more than
ATR × Max Deviation. The line with the most qualifying touches becomes the upper
boundary. The same process runs independently for pivot lows to find the lower
boundary. Both boundaries must exist with at least Min Touches (default 2) to
form a valid channel.
◆ Convergence Filter
Once both boundaries are found, the engine measures channel width at the earliest
shared bar (widthStart) and at the current bar (widthNow):
convRate = 1 − (widthNow / widthStart)
A channel is only accepted when convRate >= Min Convergence Rate (default 0.02).
This rejects expanding wedges and flat ranges, keeping only contracting patterns.
◆ Breakout Detection and Strength Score
On each confirmed bar close, the engine projects both boundary lines to the current
bar. A bull breakout fires when close > upper boundary; a bear breakout when
close < lower boundary. The breakout strength score blends five components:
penetration depth relative to ATR (25%), candle body ratio (15%), body commitment
relative to the broken boundary (15%), volume vs SMA-20 spike (25%), and RSI
alignment above/below 50 (20%). Score >= 65 = Strong, >= 35 = Medium, < 35 = Weak.
◆ Confirmation Filters
Three optional filters gate the breakout signal. Volume Spike Multiplier requires
the breakout bar's volume to exceed 20-bar SMA by a configurable factor. Volume
Contraction Filter requires that average volume inside the channel was lower than
before the channel formed — confirming energy compression. Momentum Confirmation
requires RSI > 50 for bull breakouts and RSI < 50 for bear breakouts. Any filter
can be disabled for forex or low-volume instruments.
━━━━━━━━━━━━━━━━━━━━━━━━━━━━━━━━━━━━━━━
▸ WHAT MAKES IT DIFFERENT
◆ Pivot-Confirmed Boundaries
Most auto-channel scripts use ta.highest / ta.lowest, which anchors lines to the
highest wick in a window regardless of pattern shape. This indicator builds
boundaries only through confirmed swing pivot points, the same anchor logic a
trader would use when drawing manually.
◆ Convergence-Only Filter
The convRate filter rejects any channel that is not actively narrowing. Sideways
ranges, expanding wedges, and parallel channels are all excluded. Only patterns
where price is compressing toward a decision point qualify.
◆ Best-Fit Touch Counting
The engine evaluates every pair of pivots and selects the line with the highest
touch count, not just the first two pivots it finds. A channel supported by four
touches is stronger than one supported by two, and the algorithm reflects that
by preferring denser confirmation.
◆ Multi-Component Strength Score
The breakout strength is not a simple volume check. It combines five independent
signals — penetration depth, body ratio, body commitment relative to the broken
level, volume spike, and momentum direction — into a single 0-100 score that
classifies the breakout as Strong, Medium, or Weak.
◆ Directional Bias Score
While price is inside the channel, the dashboard tracks a real-time directional
bias built from channel slope (35%), RSI deviation from 50 (35%), and price
position within the channel range (30%). This gives a probabilistic lean on
which side of the channel is more likely to break before the signal fires.
━━━━━━━━━━━━━━━━━━━━━━━━━━━━━━━━━━━━━━━
▸ DASHBOARD
Real-time panel (top right) with key state metrics:
Status - Active (channel forming) / Bull Breakout / Bear Breakout / Scanning
Direction - directional bias with arrow and % while channel is active (e.g. ▲ 64%); BULLISH or BEARISH after breakout
Strength - Strong / Medium / Weak (breakout strength score); — while channel is forming
Convergence - narrowing rate of the active channel in %; — when no channel
Legend table (bottom left) explains every visual element. Toggle in Dashboard settings.
━━━━━━━━━━━━━━━━━━━━━━━━━━━━━━━━━━━━━━━
▸ SETTINGS
Main Settings
Pivot Detection Length - 5 (bars left/right for swing pivot confirmation; lower = more sensitive)
Min Touches per Boundary - 2 (minimum pivot touches required per trendline)
Max Channel Width (bars) - 120 (maximum lookback for channel search)
Min Convergence Rate - 0.02 (minimum narrowing ratio; higher = stricter contraction)
Filters
Volume Spike Mult - 1.2 (breakout bar volume vs SMA-20; set 0.5 to disable on forex)
Volume Contraction Filter - ON (require declining volume inside the channel)
Momentum Confirmation - ON (RSI > 50 for bull, < 50 for bear)
Visual
Show Channel Patterns - ON (draw boundary lines)
Show Pattern Background - OFF (subtle bgcolor while inside active channel)
Channel Lines
Line Width - 2 (boundary line thickness; 1-4)
Risk Management
Show Entry Labels - ON (arrow label on the breakout candle)
Dashboard
Show Dashboard - ON
Position - Top Right (Top Left / Top Right / Bottom Left / Bottom Right)
Font Size - Small (Small / Normal)
Advanced
Touch Tolerance (ATR) - 0.15 (pivot distance to count as a touch; 0.10-0.25)
Max Deviation (ATR) - 0.30 (maximum pivot overshoot from the line)
Min Channel Width (ATR) - 0.5 (minimum channel width filter)
Alerts
JSON Alerts - OFF (structured JSON payload for 3Commas, Wunderbit, and similar bots)
━━━━━━━━━━━━━━━━━━━━━━━━━━━━━━━━━━━━━━━
▸ ALERTS
Bull Breakout - price closes above the upper channel boundary with confirmation
Bear Breakout - price closes below the lower channel boundary with confirmation
Any Breakout - either direction; use for a single alert covering both signals
New Pattern - a new convergent channel has been detected and is now active
━━━━━━━━━━━━━━━━━━━━━━━━━━━━━━━━━━━━━━━
Best regards,
EXCAVO
Disclaimer
Trading involves significant risk. This indicator is a technical analysis tool
and does not constitute financial advice, investment recommendations, or a
guarantee of future results. Past indicator behavior does not guarantee future
performance. Always use proper risk management and your own judgment.
Indicador

Wedge Reversal Detector [AGPro Series]Wedge Reversal Detector
🔷 Overview
Wedge Reversal Detector is a focused chart-pattern engine built for one specific structure: the rising wedge and falling wedge. Instead of scanning every possible reversal pattern, drawing broad support and resistance, or behaving like a generic breakout dashboard, this script studies the geometry of a wedge itself: confirmed pivot boundaries, slope convergence, pattern maturity, reversal break quality, projected reaction zone, and invalidation context.
The goal is to make wedge analysis cleaner and more objective on a live chart. A valid wedge is not treated as just two random trendlines. The script requires a confirmed pivot structure, a meaningful initial width, a narrowing final width, and the correct slope relationship for either a rising wedge or a falling wedge. Once a qualified structure is active, it draws the converging boundaries directly on the chart and waits for a reversal-side break.
The detector also includes two visual preparation layers. The developing-wedge preview layer can draw dashed boundaries before the structure is fully armed. The Wedge Radar layer keeps the latest compression window visible when no confirmed candidate is active. Radar projection is capped so higher-timeframe charts stay clean, and low-compression radar states can remain boundary-only until the structure becomes visually meaningful. Break labels, reaction zones, and invalidation guides remain reserved for stricter confirmed candidates. This keeps the chart visually informative without weakening the actual confirmation logic.
The visual layer includes compact boundary tags that label the upper and lower rails directly on the right side of the structure. These tags are designed as chart annotations, not signal spam: they identify whether the rail is acting as a rejection rail, compression rail, reclaim rail, break rail, or invalidation rail. A single optional compression tag can also summarize the current radar or wedge state.
🔶 Why This Is Different
Many wedge indicators stop at pattern drawing. Others become broad pattern scanners that mix wedges with channels, double tops, double bottoms, triangles, support and resistance zones, and unrelated reversal signals. Wedge Reversal Detector intentionally stays narrower.
Its edge is the sequence:
1. Detect a qualified rising or falling wedge from confirmed pivots.
2. Measure whether the boundaries are genuinely converging.
3. Grade wedge maturity before any break occurs.
4. Confirm the reversal-side break with an optional close-based rule and ATR buffer.
5. Score break quality using maturity, boundary expansion, candle structure, close location, and volume participation.
6. Project a concept-native reaction zone from the wedge width.
7. Display a clean invalidation guide so the structure remains readable after the break.
This makes the script a wedge lifecycle tool, not a general reversal scanner.
💎 Unique Edge
The most important difference is that the script treats a wedge as a living geometric compression structure. It does not simply connect the latest two highs and lows and call the pattern complete. A candidate must pass span, width, convergence, and slope requirements before it becomes active.
For rising wedges, the script looks for rising pivot highs and rising pivot lows where the lower boundary is climbing faster than the upper boundary. This creates upward compression, which is the core geometry behind a rising wedge. For falling wedges, it looks for falling pivot highs and falling pivot lows where the upper boundary is falling faster than the lower boundary. This creates downward compression, which is the core geometry behind a falling wedge.
That difference matters because many weak wedge tools confuse ordinary channels with wedge compression. This script separates those structures by requiring the final width to be materially smaller than the starting width.
🔹 Methodology
The engine begins with confirmed pivot highs and pivot lows. The user controls the pivot confirmation length, which allows the detector to be tuned for intraday, swing, or higher-timeframe charts.
From the latest confirmed swing pair, the script builds two boundary lines:
- Upper boundary from confirmed pivot highs
- Lower boundary from confirmed pivot lows
The detector then evaluates:
- Pattern span in bars
- Initial boundary width measured against ATR
- Final boundary width relative to the starting width
- Upper boundary slope
- Lower boundary slope
- Correct rising-wedge or falling-wedge geometry
Only when those requirements align does the pattern become an active wedge.
🔸 Break Quality Model
A wedge break is scored only after the reversal-side boundary is broken. The break quality score is built from multiple factors:
- Wedge maturity
- Distance beyond the broken boundary
- Candle body participation
- Close location inside the break candle
- Volume ratio versus recent average volume
The score is translated into a simple grade so the chart stays easy to read. This does not claim that a break must continue. It gives the user a structured read of how strong the confirmed break appears under the script's own rules.
🎯 Projected Reaction Zone
After a confirmed wedge reversal break, the script projects a reaction zone using the initial wedge width. This zone is not a generic support/resistance box. It is tied directly to the wedge geometry and appears only after the structure confirms. The goal is to show the next area where price may naturally react after escaping the compression.
The zone width and projection length are configurable, so users can keep the chart compact or allow more forward context depending on timeframe and style.
🧭 Invalidation Context
The script also draws an invalidation guide after a confirmed break. For a bullish falling-wedge break, invalidation is tracked below the opposite wedge boundary with an ATR buffer. For a bearish rising-wedge break, invalidation is tracked above the opposite wedge boundary with an ATR buffer.
This keeps the post-break structure organized without adding trade instructions or turning the script into a strategy.
📊 Panel
The compact AGPro panel summarizes the current wedge lifecycle:
- Wedge Type
- Maturity
- Break Quality
- Target Zone
Panel location, panel theme, and panel font size are adjustable from settings. The first panel row uses the AGPro standard: one merged blue header row containing only the panel title.
⚙️ Key Settings
- Pivot Confirmation Length controls how strict the swing structure is.
- Minimum Wedge Span filters out tiny patterns.
- Maximum Final Width Ratio controls how much convergence is required.
- Developing Wedge Preview Ratio controls how early dashed formation boundaries can appear.
- Wedge Radar controls the latest-window visual radar that prevents panel-only charts while waiting for confirmed wedge geometry.
- Radar Projection Bars limits how far radar boundaries extend into future bars.
- Radar Fill Threshold keeps low-compression radar structures from creating oversized filled areas.
- Boundary Tags add compact right-side rail annotations so the structure is easier to read without covering candles.
- Compression Tag shows one status label for radar compression or armed-wedge maturity.
- Boundary Break Buffer ATR adds confirmation distance beyond the wedge boundary.
- Volume Confirmation Ratio contributes to break quality scoring.
- Projection Length Bars controls how long the reaction zone extends forward.
- Label Font Size and Label Offset ATR help maintain a clean chart presentation.
🧩 How It Differs From Other AGPro Tools
This script is intentionally separate from AGPro channel, breakout, liquidity, and broad reversal tools.
It is not a channel map. Channel tools organize parallel or multi-family structure. Wedge Reversal Detector only studies converging wedge geometry.
It is not a double top or double bottom detector. Those patterns are based on repeated horizontal rejection and neckline behavior. This script is based on converging diagonal boundaries.
It is not a broad reversal scanner. It does not combine every reversal pattern into one dashboard. It stays focused on wedge compression, wedge maturity, reversal break, projected reaction zone, and invalidation.
It is not a generic breakout quality tool. Break quality is evaluated only after a valid rising or falling wedge exists.
🔔 Alerts
The script includes alerts for:
- Bullish falling wedge break
- Bearish rising wedge break
- High quality wedge break
- Wedge invalidation
These alerts are event notifications for the detected structure, not automated trading instructions.
✨ Best Use Case
Wedge Reversal Detector is best suited for traders who already watch chart patterns, market structure, compression, and failed trend continuation. It helps reduce manual drawing by highlighting qualified wedge structures, then keeping the chart organized through the confirmation, projection, and invalidation phases.
The result is a clean, premium, wedge-specific workflow designed for public chart reading: fewer random lines, fewer noisy labels, and a clearer view of whether the wedge structure is still forming, breaking, projecting, or invalidating.
Indicador

Indicador
Indicador